8 - Storage options with EOR
Injection of CO2 in oil fields has for many years been used as a method to enhance oil recovery (EOR), primarily in the United States, where the CO2 mostly comes from reservoirs with naturally occuring CO2. CO2 may also be used to obtain recovery from residual oil zones. The CO2 injected to enhance recovery is stored in the reservoir but the amount of stored CO2 is reduced as more and more CO2 will be recycled after breakthrough in production wells. On the Norwegian shelf, several oil fields have been examined with regard to enhanced recovery through CO2 injection. Some of the fields have proved to be promising candidates. In the beginning of this century studies carried out by the operator on the Gullfaks Field showed a good potential for increased recovery by CO2 injection. Studies on the Ekofisk field by ConocoPhillips have shown large reserve potential but with concerns regarding dissolution/compaction. On Haltenbanken the Draugen and Heidrun Fields have been studied but these fields show less EOR potential. For all the fields lack of access to CO2 has stopped further evaluation.
A study carried out by the Norwegian Petroleum Directorate (NPD) in 2005 and updated in 2012 on fields in the North Sea, indicated a large potential for additional oil recovery with an increase in recovery factor varying from 5-12 percent points. These numbers are also confirmed by a study from the BIGCO2 project (Climit). This study shows an increased oil recovery of more than 370Mt from 19 fields in the North Sea, with an injection of 80Mt/y CO2.
The amount of stored CO2 in oilfields is than 1,5 Gt and the amount stored in aquifers is 1,9 Gt CO2. The best effect of CO2 is obtained when CO2 and oil are miscible in the reservoir. CO2 also swells the oil, reduces oil viscosity and increases oil density and thereby increase recovery of the oil. CO2 is soluble in water, can evaporate and extract oil, and it reduces surface tension between oil and water which also help the recovery. The sweep efficiency of CO2 flooding is not good but can be improved by applying WAG, by alternating injection of CO2 and water. Using foam with the CO2 is also a way to help conformance control of the CO2 movement in the reservoir.
A critical factor in this process is the corrosivity of CO2 when mixed with water.The CO2-water mixture will break through in the production wells and reach the process facility. This may cause corrosion in wells and process equipment if not protected. Technological solutions for injection and reproduction of CO2 have to be improved before this can be a viable method for EOR, especially in older oil fields.
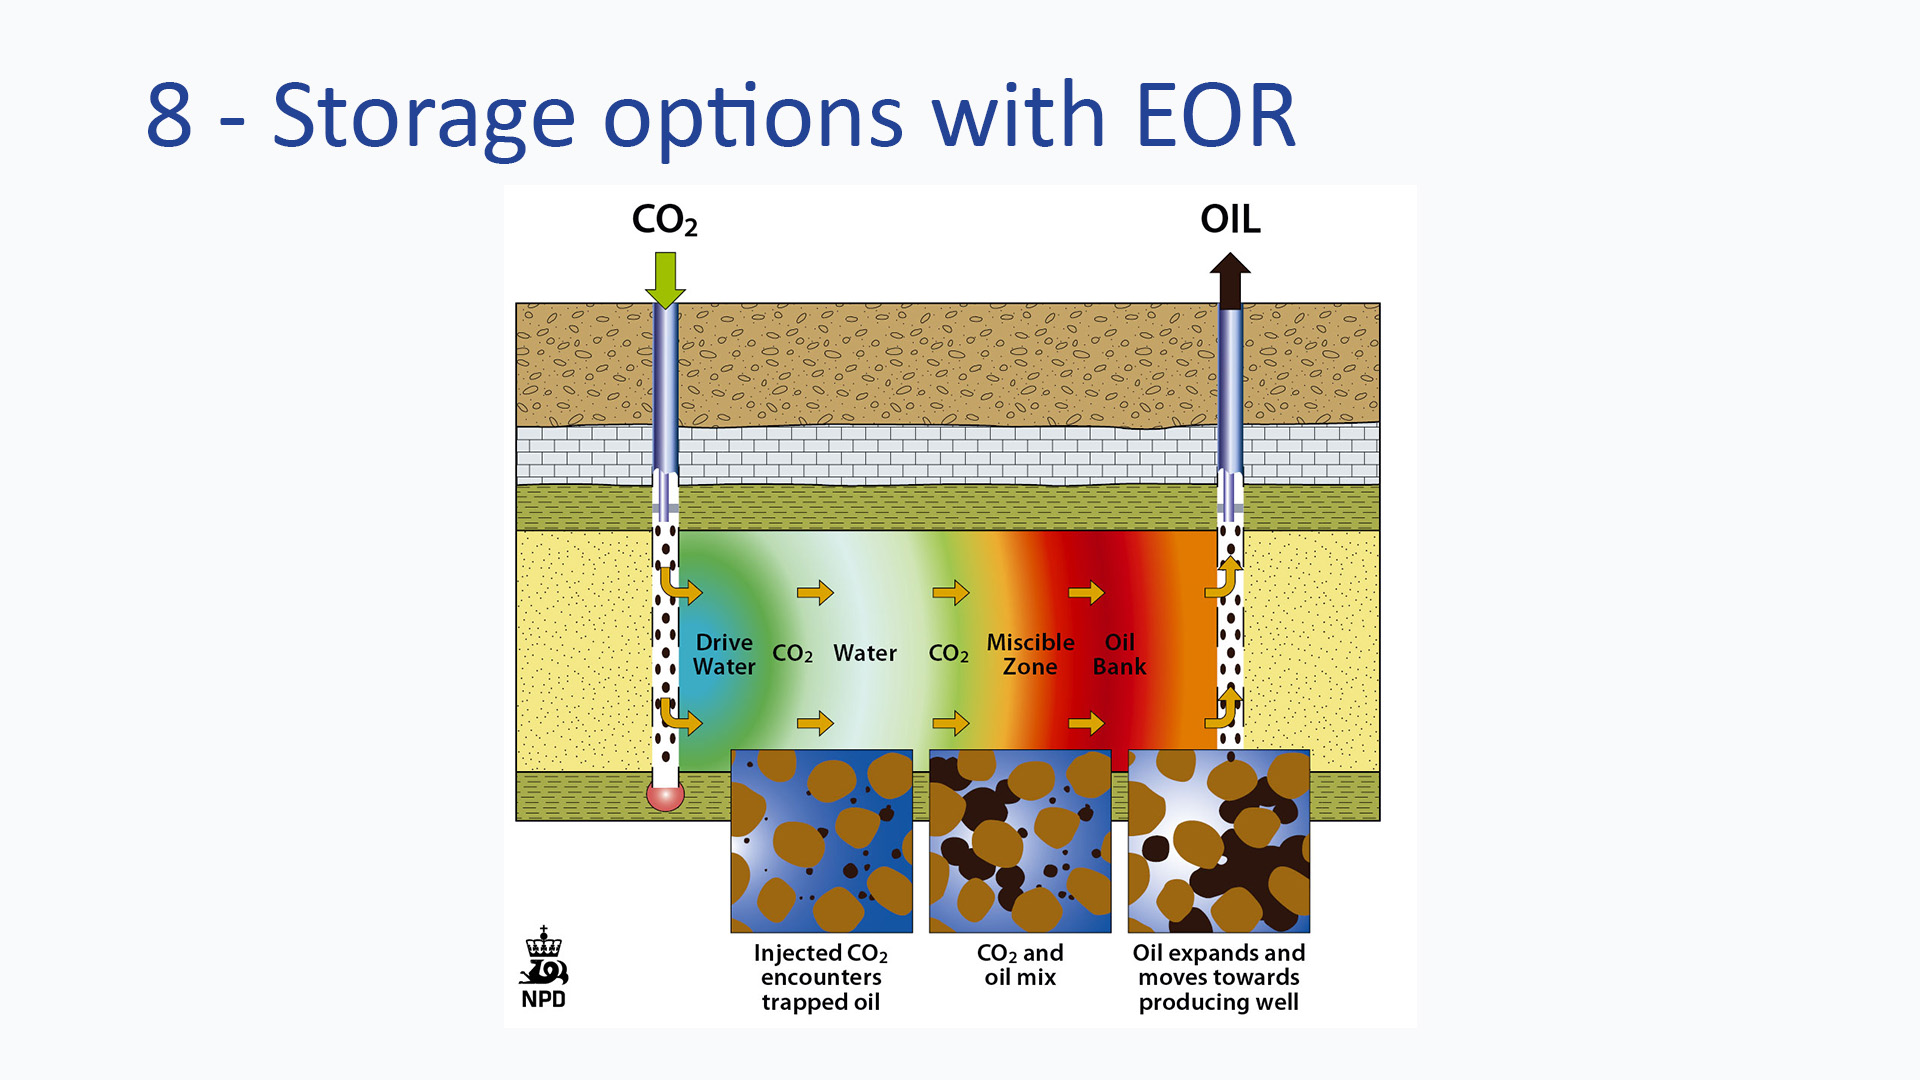
Fig-8-1
Cross section of a reservoir with CO2 WAG
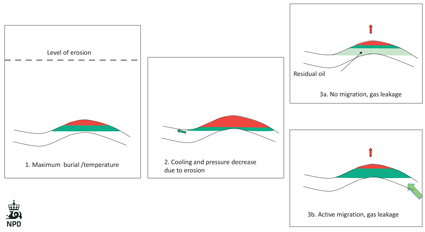
Fig-8-2
Hypothesis for formation of residual oil zone by natural gas seepage. After maximum burial the rate of seepage of gas is greater than the rate of migration of hydrocarbons into the accumulation. Consequently fluid contacts move upwards. Residual oil (light green) is formed where water replaces oil in the initial oil zone (green).
Residual oil zones In the late stage of production of an oil field, formation water and injected water will have replaced much of the initial oil. When oil is swept by water, a certain amount of immobile oil will remain. The saturation of this residual oil is typically in the order of 20 %, depending on reservoir properties. Residual oil zones can also form by natural processes. In the Norwegian Continental Shelf, residual oil is common in the Jurassic aquifer of the Hammerfest Basin in the Barents Sea. Significant residual oil zones are also associated with some of the giant oil fields in the North Sea. These zones were formed when oil was redistributed in the trap and water replaced the oil by natural processes. Two common processes which can result in formation of residual oil appear to be tilting of traps and seepage from traps, as shown in the sketches.
Under miscible conditions, CO2 can be used to mobilize residual oil and make it possible to produce oil from both natural ROZ and ROZs from oil production.
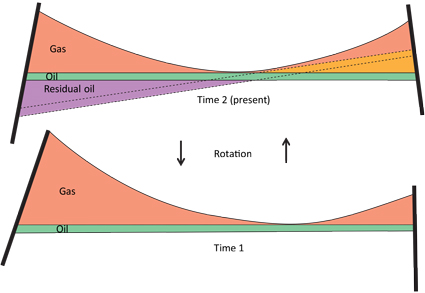
Fig-8-3
Formation of residual oil zone by rotation of a structural trap with oil and gas. Fluid contacts are controlled by pore pressure and will equilibrate to horizontal surfaces . The pore space where oil is replaced by water will remain with a residual oil saturation (purple zone). There will also be a residual oil saturation in the gas zone (orange zone), but this saturation is much lower than in the water zone. Time 1 – initial trap, Time 2 - rotated trap, dotted lines show the present location of the inital contacts.
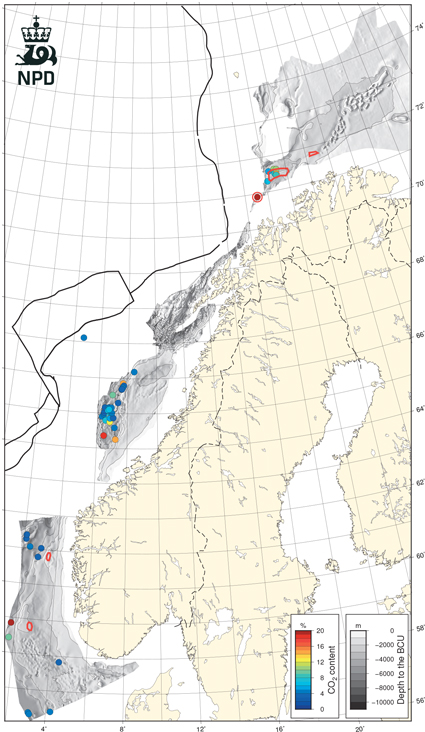
Fig-8-4
Map of Base Cretaceous unconformity showing location of exploration wells where the measured CO2 concentration in natural gas exceeds 3 %. 7019/1-1 is marked by a red ring. Residual oil zones are indicated by red lines.
CO2 flooding will usually be a tertiary process with recovery from residual oil zones after water flooding. Some fields have residual oil below the main oil zone originally in the field, so called paleo oil. In the Barents Sea residual oil or paleo oil have a wide distribution. A simulation study was performed on a structure with residual oil in the southernmost Bjarmeland Platform in the Barents Sea to investigate if some of the residual oil could be produced. Data was obtained from the wells 7125/1-1 and 7125/4-1.
The main oil zone was 1-1,5 m thick in well 7125/1-1 with a 32,5 m residual oil zone below. The study indicated that the main oil zone could be up to 30 m thick in average. Simulation cases were run both on a thin and a thick oil zone.
The oil was produced (well OP in figure below) from the main oil zone while CO2 was injected down flank (well GI on figure) in the residual oil zone with an injection period of 30 years. Results from the simulation with a 30 m thick main oil zone showed a reduction in oil production when water coned into the producer. However, the oil production increased again when CO2 together with swept oil from the residual oil zone reached the well.
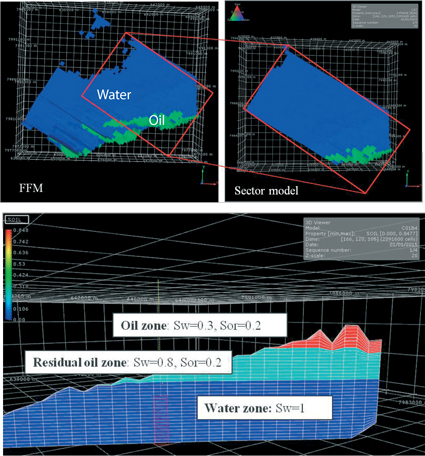
Fig-8-5
Setup of simulation model, showing the location of the sector model and the distribution of oil and residual oil.
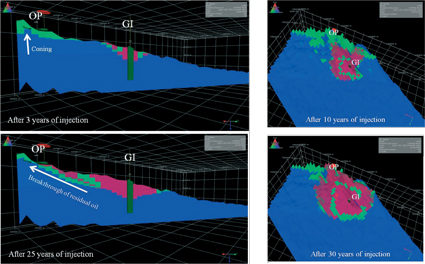
Fig-8-6
Profiles through the CO2 injector (GI) and the oil producer (OP), showing distribution of CO2 (red), oil (green) and water (blue) 3 and 25 years after the injection start. The maps to the right show the distribution of the CO2 plume. North is down to the left.
With a thin oil zone (3 m thick) the water coned very rapidly into the well and the well died before the the CO2 and the residual oil reached the well. To optimize recovery from a thin oil zone overlying a residual zone, CO2 injection should start some years ahead of the production to keep a continuous production and thereby optimize the economics. The input data and the results for both cases are shown in the figures.
The sector model with a thick oil zone gave a recovery of 6.3 mill Sm3 including the residual zone. That means a total recovery of 18 %. For the thin oil case the recovery was 4.5 % including the residual zone. It was not easy to distinguish between the main zone and the residual zone recovery in the model. The stored CO2 in the two cases was 40 and 30 mill tonn respectively. The recovery of oil is to a large degree dependant on the amount of CO2 injected.
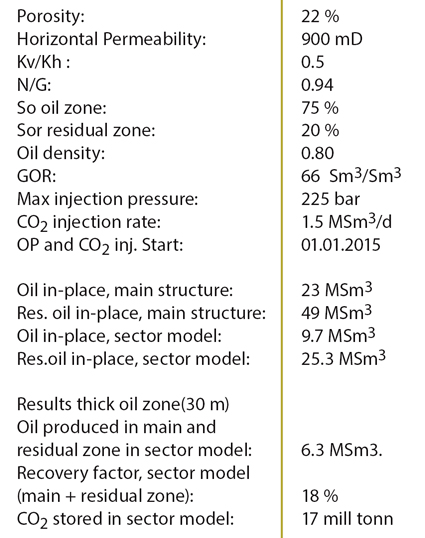
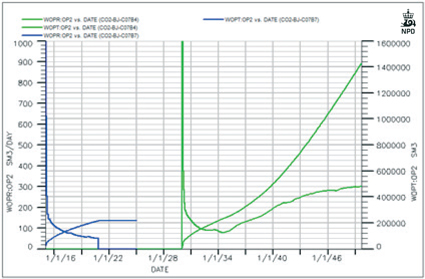
Fig-8-7
Input data and results.
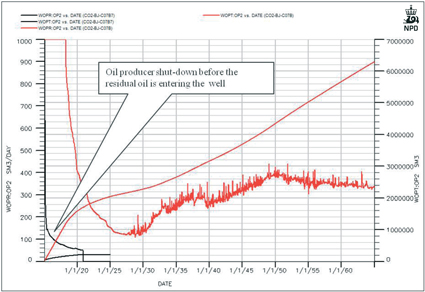
Fig-8-8
Oil production profiles with sensitivities (Red: basecase model with 30 m oil zone. Black: sensitivity with 3 m oil zone. Oil production and CO2 injection start 01.01.2015)