2 – Discovered resources
Shortcut:
2 Fields
The NPD's resource classification system defines oil and gas resources as reserves once the operator has submitted a plan for development and operation (PDO) or decided to implement a measure to optimise recovery that does not require a PDO. Discoveries are classified as fields once an approved development plan is available. 93 fields were in production at year-end.
The fields that have produced the most oil and gas in 2022 are shown in the figures below:
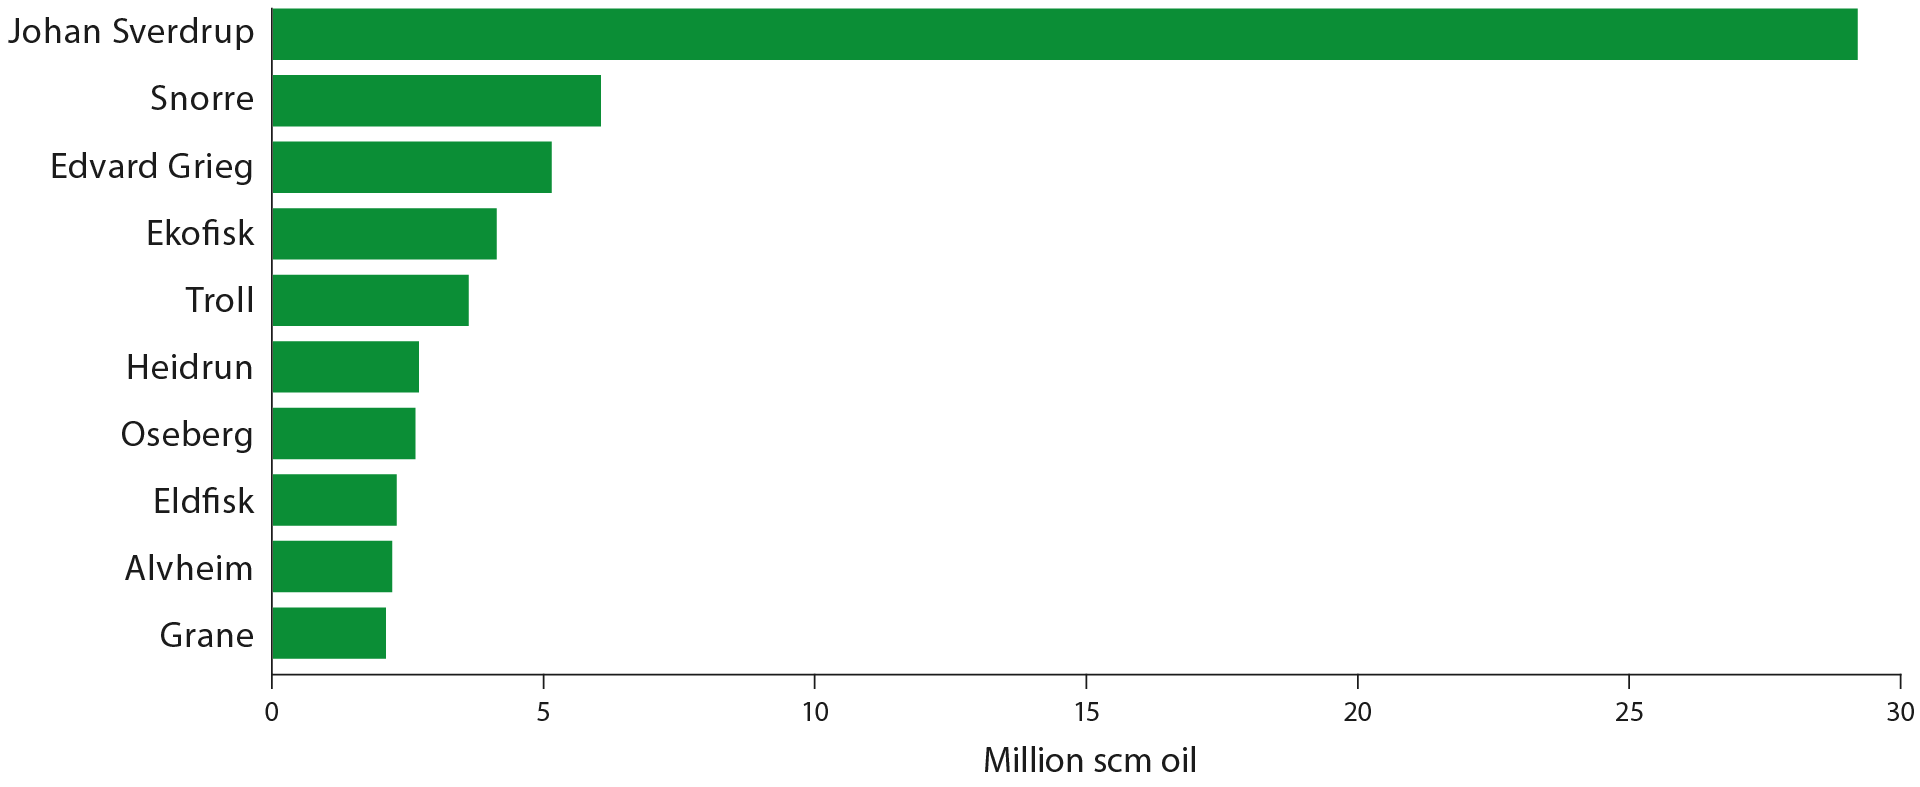
Figure 2-1 The ten largest fields in 2022 measured by oil production.
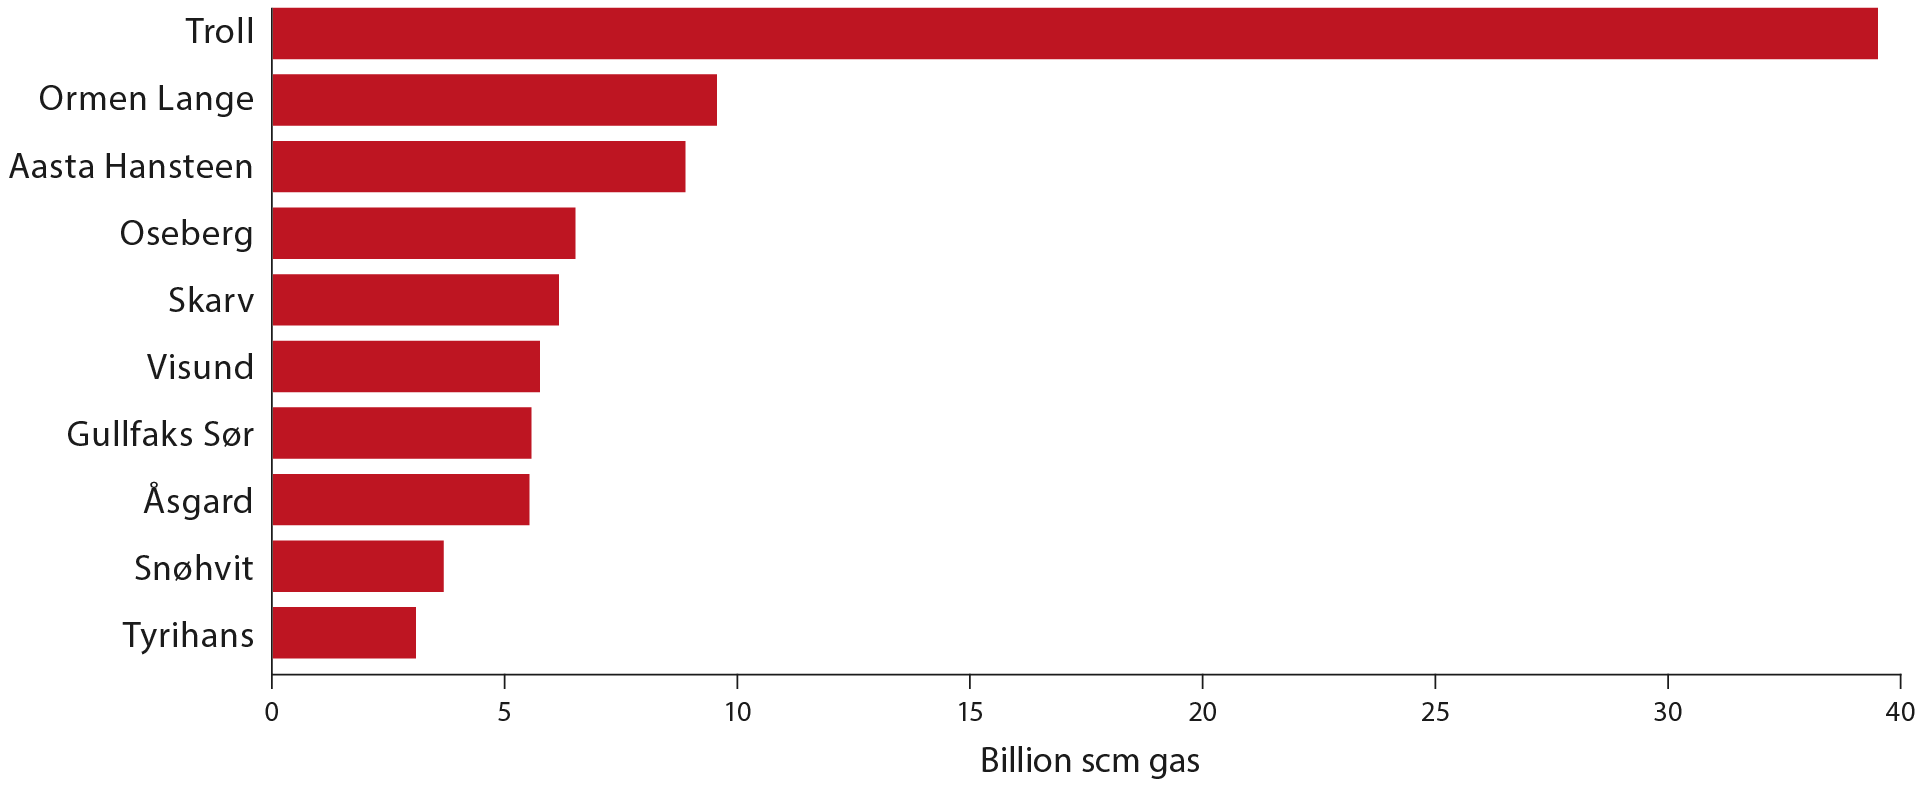
Figure 2-2 The ten largest fields in 2022 measured by gas production.
2.1.1 Reserves
Remaining reserves amount to 1,051 million Sm³ of oil and 1,469 billion Sm³ of gas. The increase in overall remaining reserves from 2021 is 31 million Sm3 oe; see Table 1-1. The Troll and Johan Sverdrup fields have the largest remaining reserves on the Norwegian shelf, with 645 billion Sm3 of gas and 315 million Sm3 of oil, respectively. For information on additional fields, please see Resource Accounts as per 31 December 2022 (Excel) link.
This year's resource accounts reflect good growth in gross reserves, which means reserves before deducting total production. Gross reserve growth for oil is 103 million Sm3 and 144 billion Sm³ for gas. A total of 231 million Sm3 oe was produced in 2022.
The authorities approved eight plans for development and operation (PDOs), and five PDO exemptions. The companies submitted 18 PDOs and six applications for PDO exemptions, 22 of which are still being processed. Estimates of reserves and production for each field can be found in the Resource Accounts as per 31 December 2022 (Excel).
In 2014, the Norwegian Petroleum Directorate established a goal for oil reserve growth of 1,200 million Sm³ for the 2014-2023 period. This was done in an effort to ensure necessary focus on reserve growth, and to simultaneously follow up the development in a systematic manner.
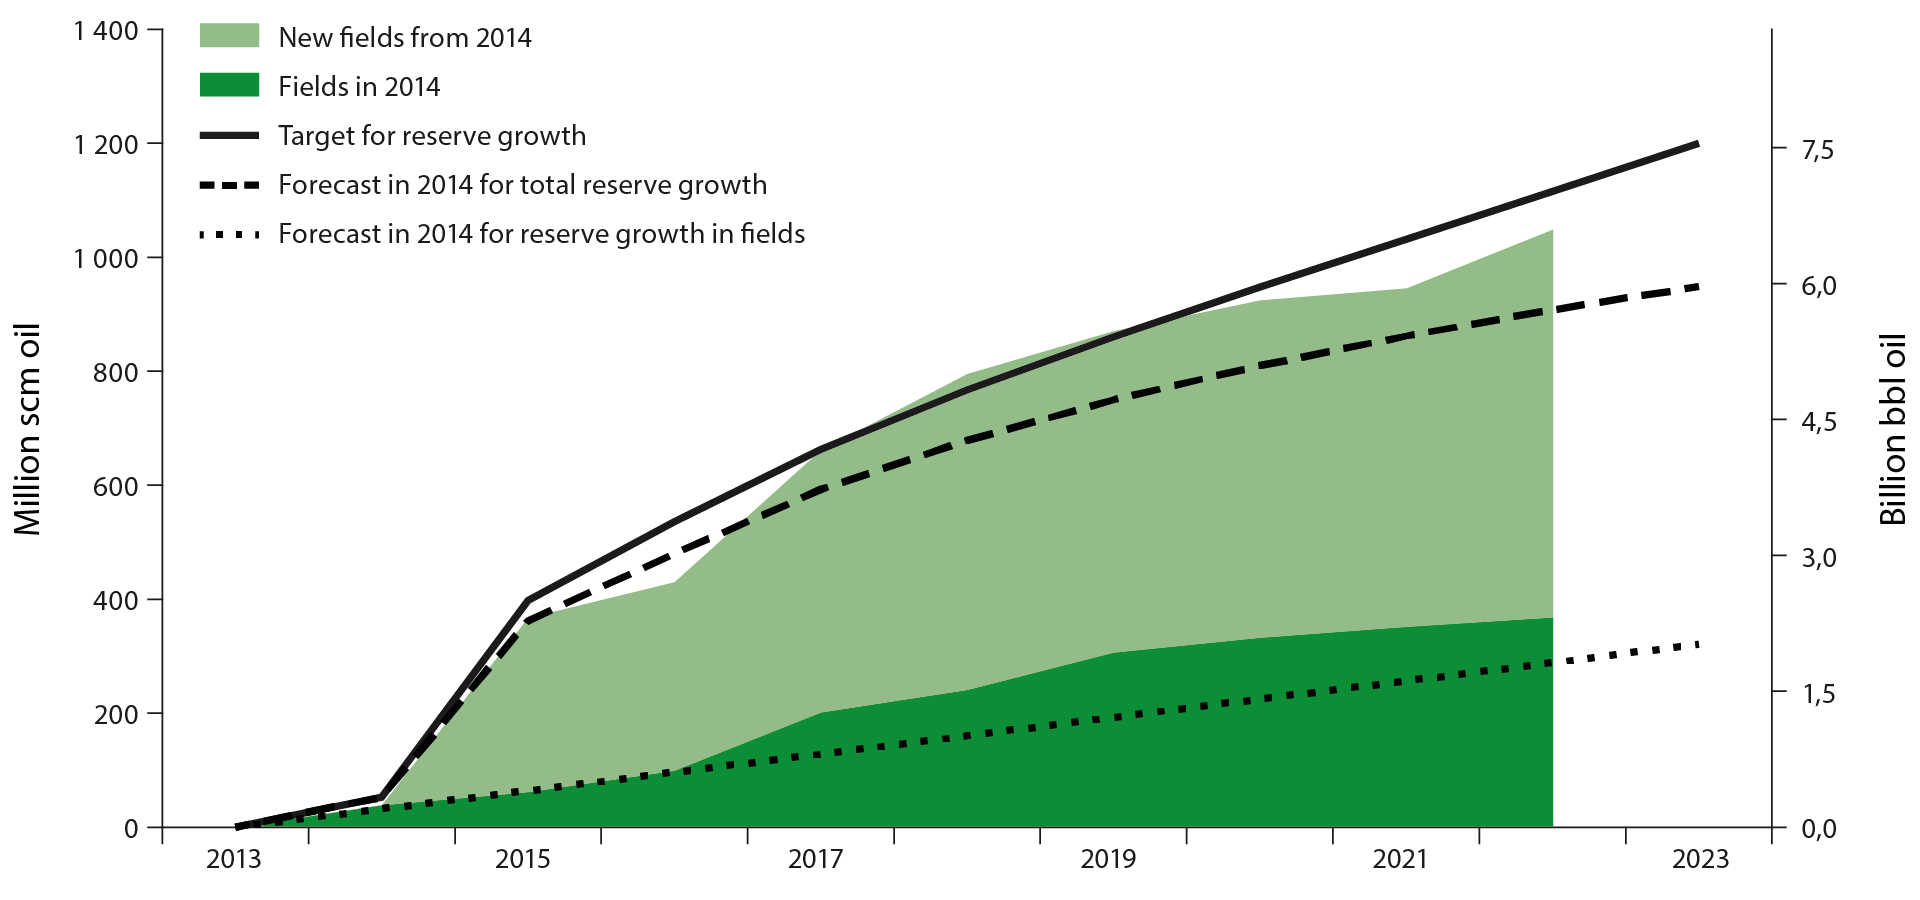
Figure 2-3 Growth in oil reserves from 2014 to 2022 compared with the NPD's forecast and goal from 2014. The growth is distributed between reserves from fields and from new discoveries that have come on stream.
The figures below show the changes in reserves, including produced volumes during the 2013-2023 period. The production is replaced by reserve growth in the years where the columns exceed production, shown by the dotted lines. The last ten-year period has seen an increase in liquids reserves, while there has been a reduction for gas; see Figure 2.
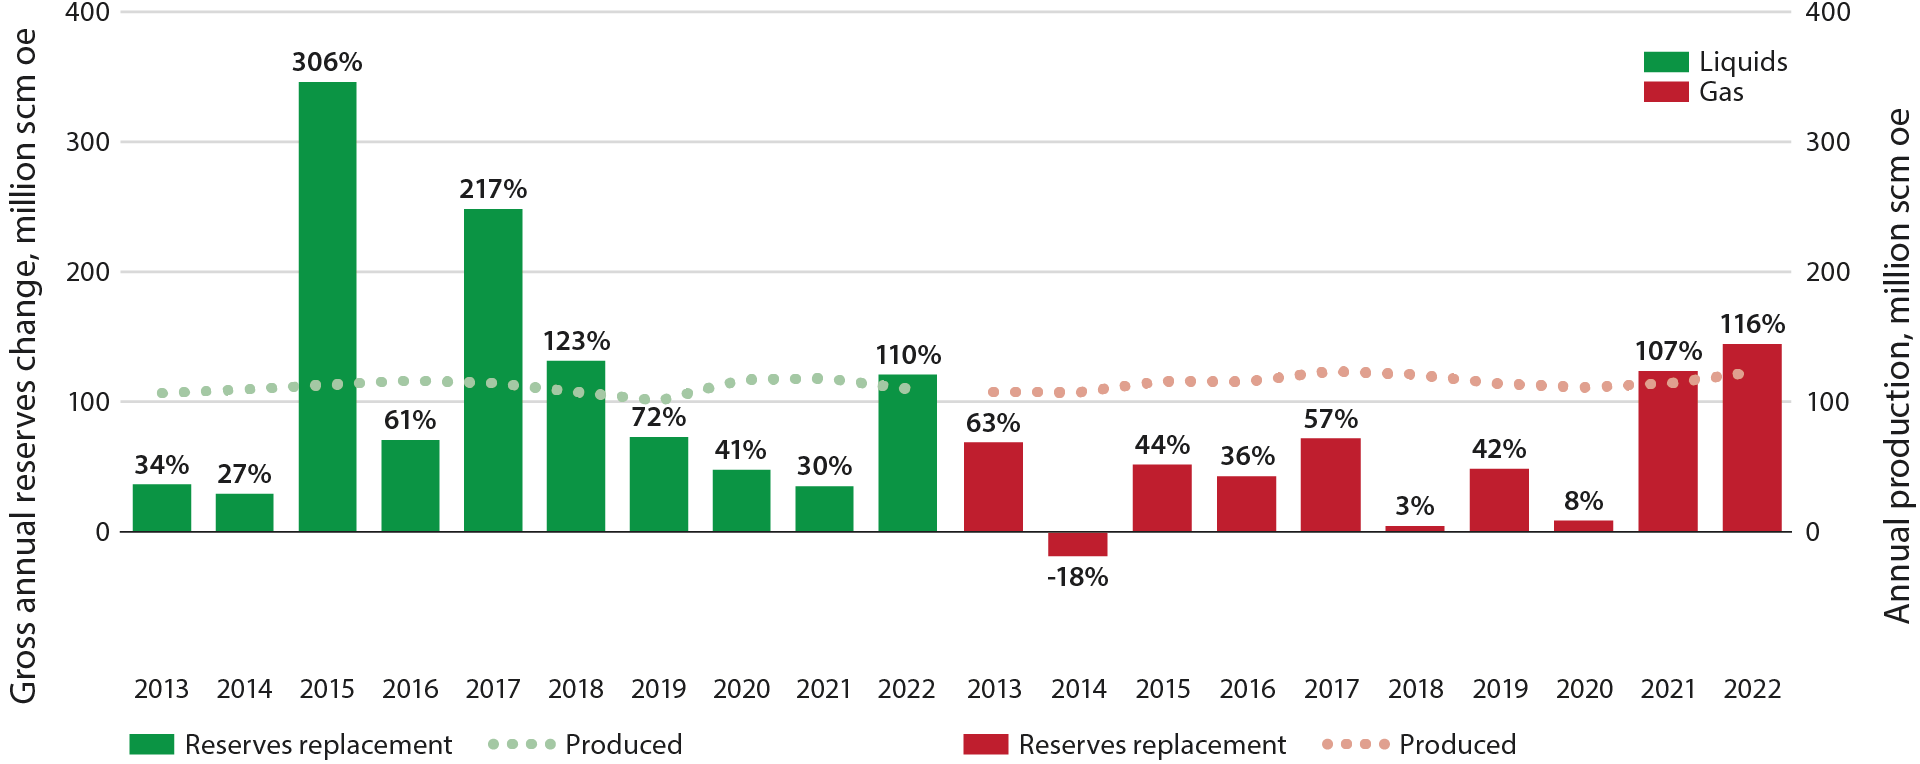
Figure 2 -4 Reserves replacement- and production development for liquids and gas over the last ten-year period. The percentage shows annual reserve replacement.
1,112 million Sm³ of liquids has been produced over the last ten years, and the Resource Accounts show that the remaining reserves are 26 million Sm³ higher than in 2012. This means that the reserve replacement for liquids has exceeded 100 per cent over the last 10 years. 110 per cent of produced liquids reserves were replaced in 2022.
Gas production since 2012 totals 1,164 billion Sm³, and the Accounts show that the remaining reserves are 621 billion Sm³ lower than in 2012. This yields a reserve replacement for gas of just under 50 per cent over the last 10 years, while 116 per cent of the produced gas reserves were replaced in 2022.
2.1.2Contingent resources in fields
The expected value for contingent oil resources (no decision to develop) in fields is 311 million Sm³; see Table 1-1. This is a reduction of 66 million Sm³ from 2021. For gas, the expectation is 260 billion Sm³, and this is a reduction of 57 billion Sm³ from the previous year. The reductions are primarily caused by maturing resources into reserves, but they are also caused by revised projections for individual projects.
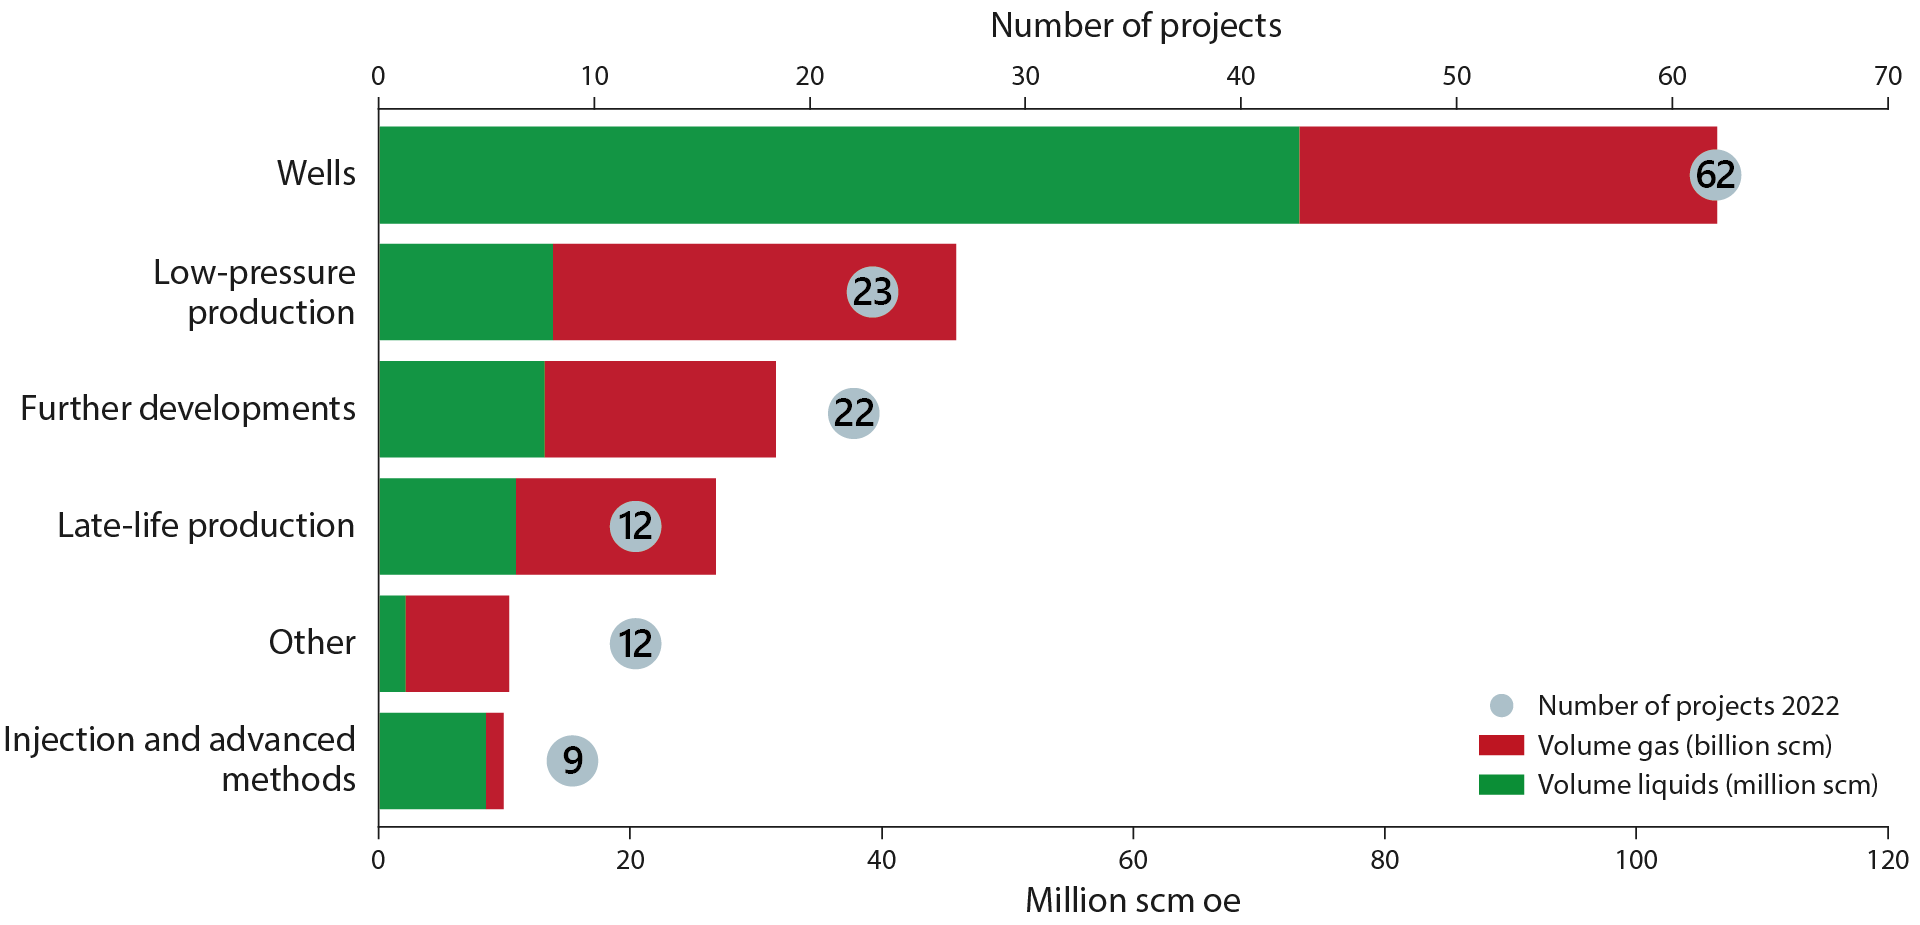
The Resource Accounts for 2022 include 140 specific, but not yet adopted, projects for improved oil and/or gas production and extended lifetime. Implementation of new technology is important in order to realise these projects and establish new ones. Figure 2-5 shows these projects distributed by project type with associated resources distributed between liquids and gas.
Projects to improve recovery are dominated by new wells, both in the number of projects (65) and volume (approx. 110 million Sm³ oe). Other projects that could provide substantial contributions are further developments, low pressure- and late-life production. Fewer measures have been identified which utilise new injection or advanced methods.
Figure 2 -5 Specific projects for improved recovery from fields; number of projects and resources
2.2 Discoveries
12 discoveries were made in 2022 with a total resource estimate of 52 million Sm3 oe. Four of the discoveries were made in the North Sea, five in the Norwegian Sea and three in the Barents Sea.
On 1 January 2022, the discovery portfolio consisted of 88 discoveries. On 31 December 2022, the discovery portfolio consisted of 79 discoveries. This can be explained by the fact that PDOs were submitted for 18 discoveries, and that resources have matured into reserves. In 2022, six discoveries changed their status from unlikely and are now being considered for development, while nine discoveries are considered to be unlikely for development.
Figure 2-6 shows an overview of developments in the number of discoveries in the portfolio through 2022, and Figure 2-7 shows equivalent info for the resource estimates.
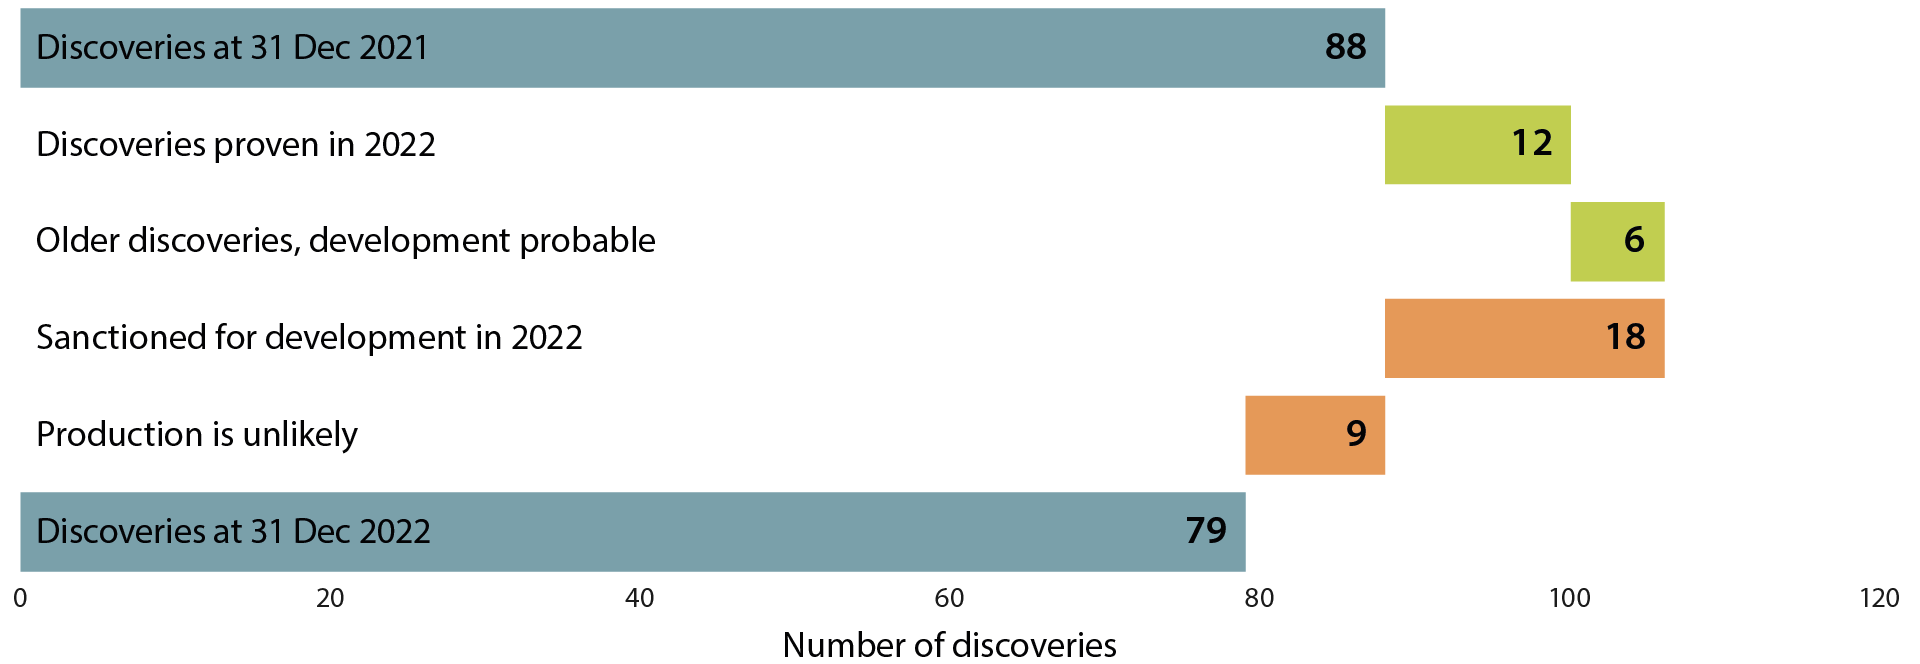
Figure 2 -6 Overview of development in discovery portfolio through 2022. Categories in green show contributions to growth and categories in red show contributions to a reduction in the number of discoveries.
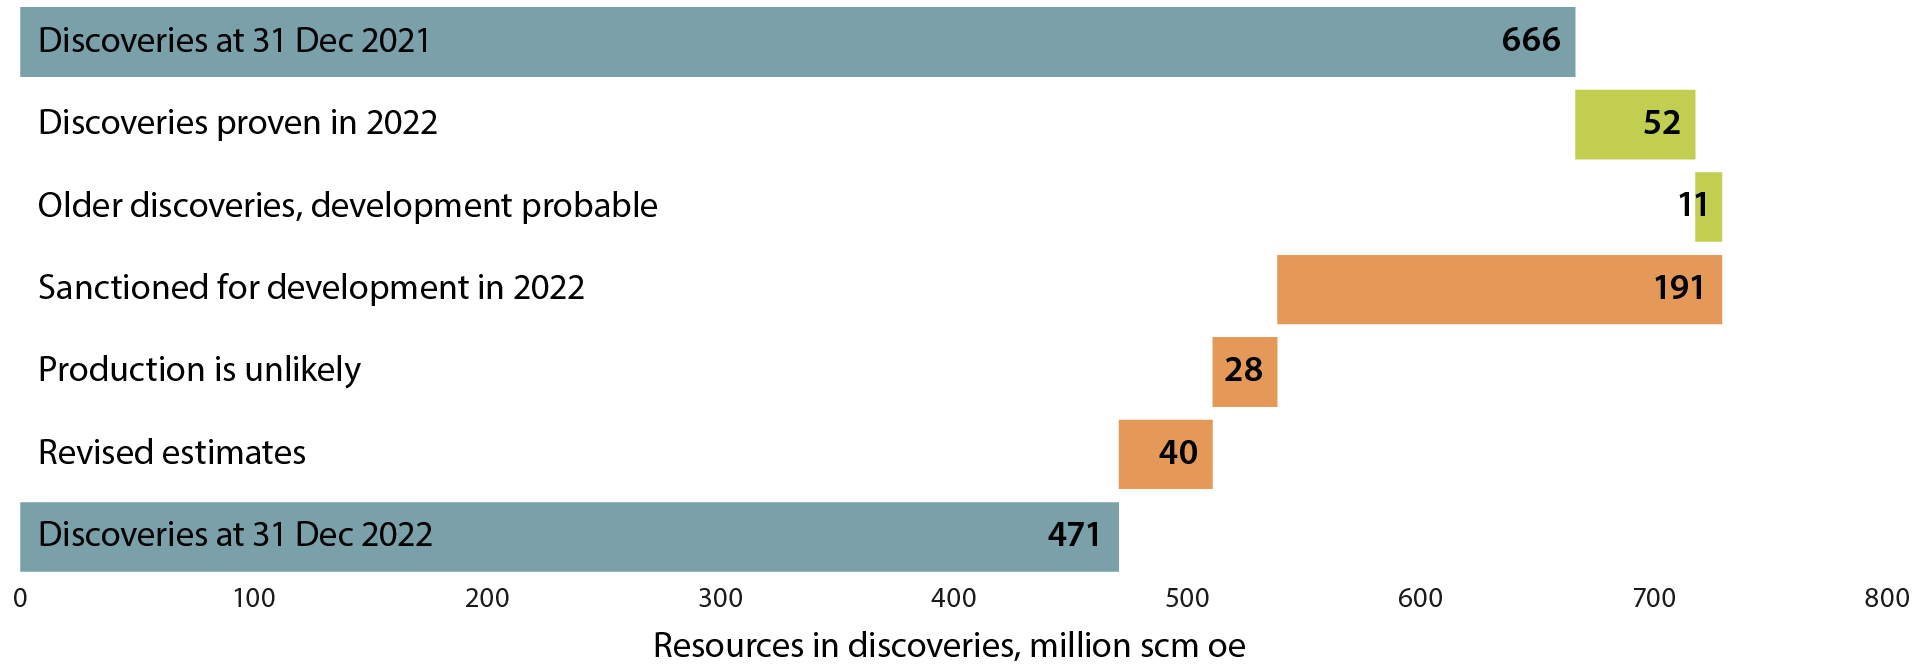
Figure 2-7 Overview of resource development in the discovery portfolio through 2022; categories in green show contributions to growth and categories in red show contributions to a reduction in resources awaiting a development decision.
In 2022, development plans were submitted for 20 per cent of the discoveries in the portfolio at year-end 2021. These plans covered 29 per cent of the resources in the discovery portfolio. Assessments of whether discoveries will be profitable to develop will vary over time. Studies and measures could cause this status to change.
In addition to changes associated with new discoveries and new categorisation, the updates also cover projections of what can be recovered from the various discoveries. Work is under way on new studies of the subsurface, changes in concept for development solutions and conditions on the host installations.
Of the 88 discoveries in the Accounts as per 31 December 2021, 61 are also included in the 2022 Accounts. The projection for recoverable resources for these discoveries has been reduced by 40 million Sm³ oe.
2.2.1 Contingent resources in discoveries
There is a total of 227 million Sm³ of oil and 230 billion Sm³ of gas in discoveries yet to be developed; see Table 1-1. The total volume in discoveries has been reduced by 196 million Sm3 of oe compared with last year's Accounts. This reduction was mainly caused by resources maturing into reserves for several discoveries, in addition to a reduction in expected recoverable volumes in certain discoveries, such as 7324/8-1 (Wisting), 6507/5-10 S (Slagugle) and 35/12-2 (Grosbeak).
2.2.2 Many small and a few larger developments
Figure 2-8 shows the discovery portfolio in the Resource Accounts by sea area and size. There are certain larger discoveries and many minor ones in all areas. The North Sea has the most discoveries. The largest discovery is 7324/8-1 (Wisting), which is located in the Barents Sea. In the Norwegian Sea, 6406/9-1 (Linnorm) is the largest, while the gas discovery 35/2-1 (Peon) is the largest in the North Sea.
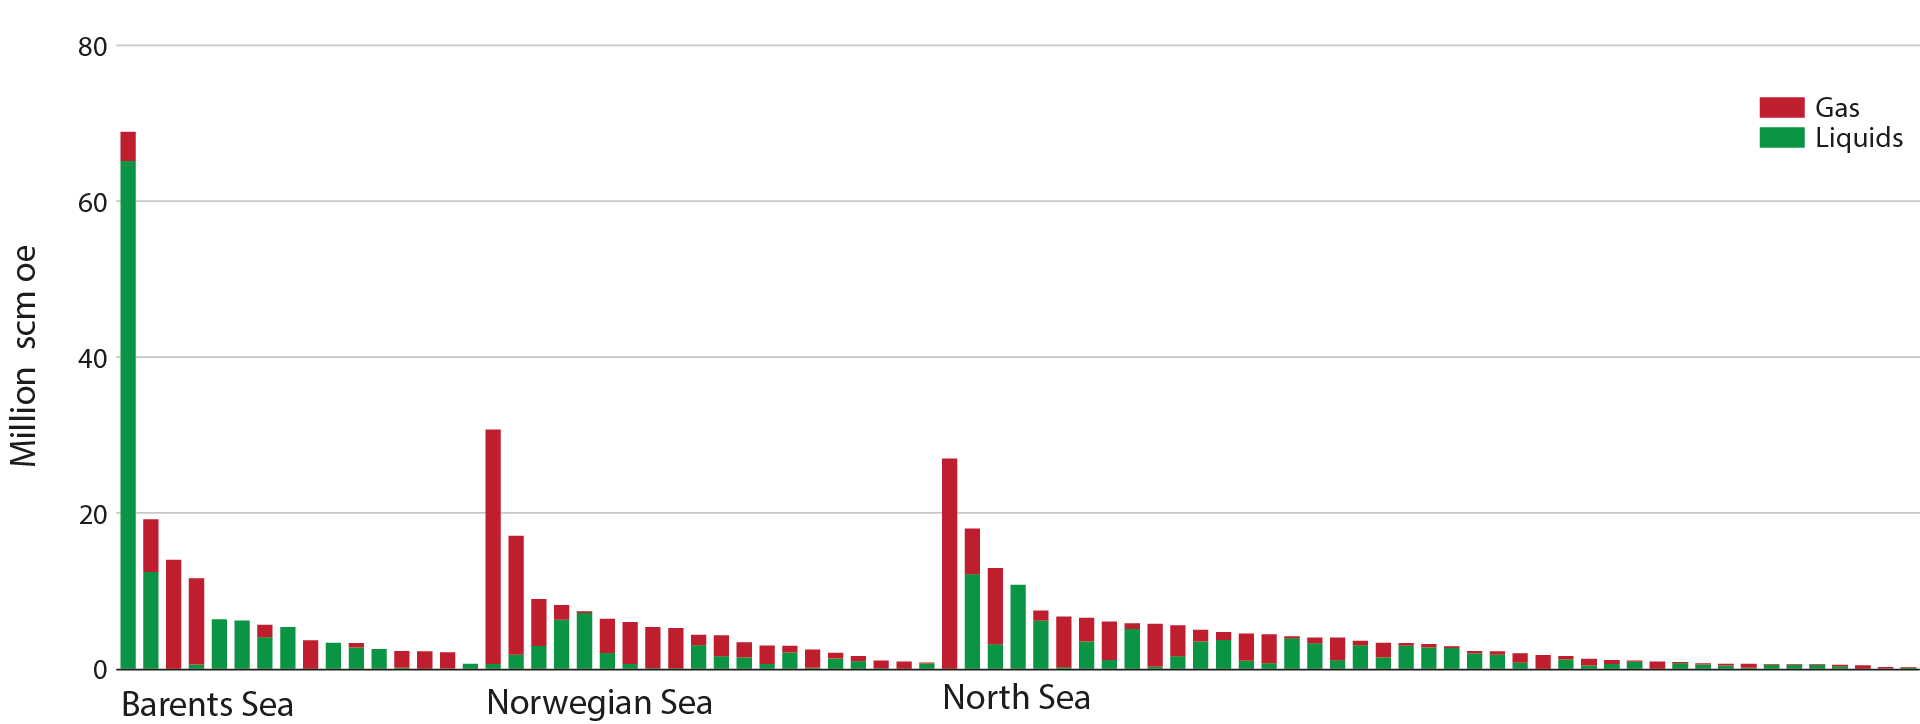
Figure 2-8 Discovery portfolio in the Resource Accounts
Both new and old facilities are important for the development of resources on the Norwegian shelf. A number of newer fields are tied into the existing infrastructure. Figure 2-9 shows that many more developments are planned to be tied into existing infrastructure. New infrastructure is important for the development of resources in the area where it is established. This will allow for phase-in of discoveries that have yet to be made, in addition to older discoveries that are not currently profitable for development.
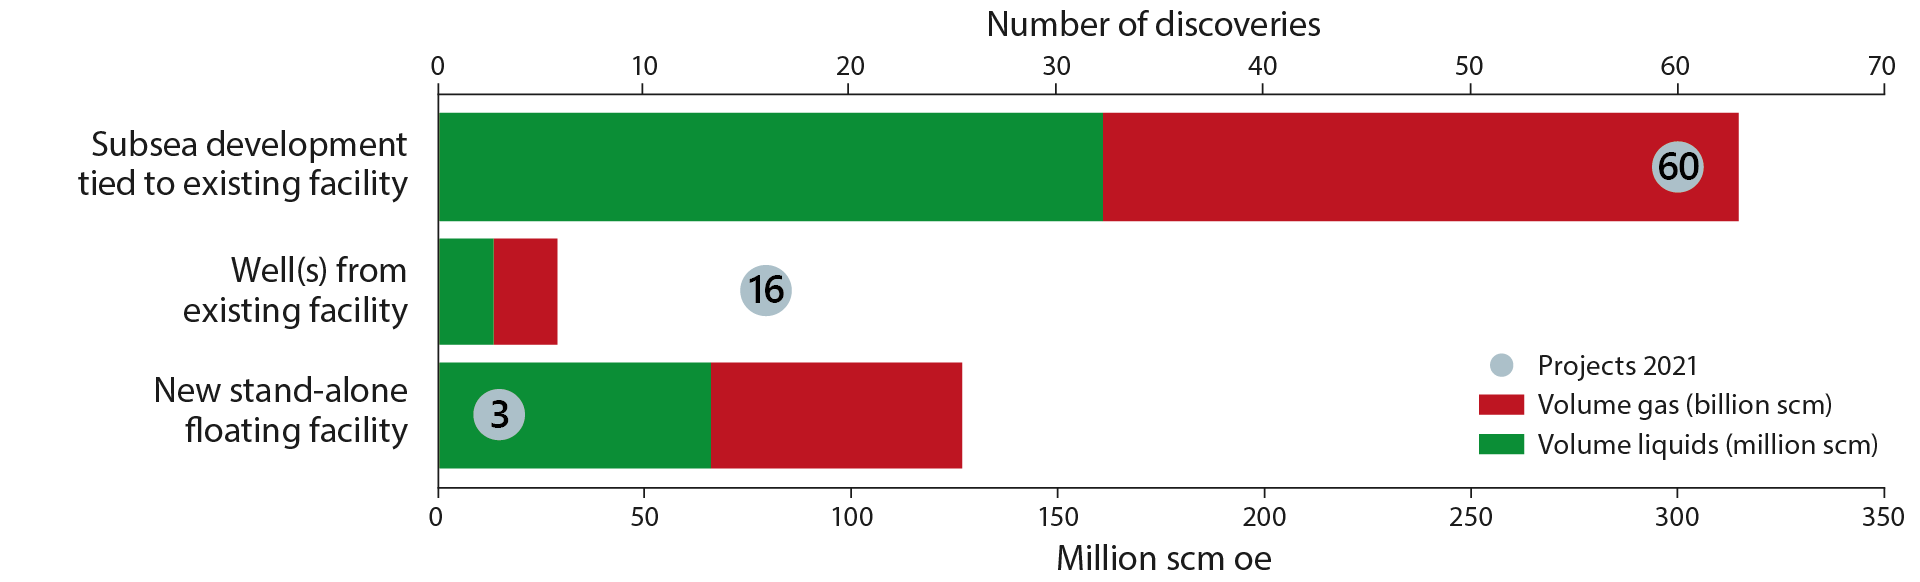
Figure 2-9 Likely development solutions for the 79 discoveries in this year's Resource Accounts, as well as overall resources per development solution
A development with tie-in to existing fields or other major development projects is planned for 76 of the 79 discoveries in the figure. Several of the current discoveries are highly likely to have joint solutions or to be incorporated into fields before a development decision is made.
The most common development solution is subsea developments. This is the most likely concept for 60 of the discoveries. Another possible solution for smaller discoveries located close enough to infrastructure is to use vacant well slots on existing fields. Such a solution has been presumed for 16 discoveries.
To invest in independent production facilities, the resource volumes must be relatively substantial, frequently as a coordinated development of several minor discoveries, or if the discovery itself is sufficiently large. Such developments are used in areas that lack access to sufficient capacity, or which are far from existing infrastructure.
2.2.3 Remaining discovered resources
Figure 2-10 shows that remaining discovered resources have been reduced by approximately 300 million Sm3 oe from 2021 to 2022. 2022 was characterised by high production, resources maturing into reserves and a reduction in contingent resources in fields and discoveries. The increase in gross reserves due to the investment decisions amounted to 262 million Sm³ oe.
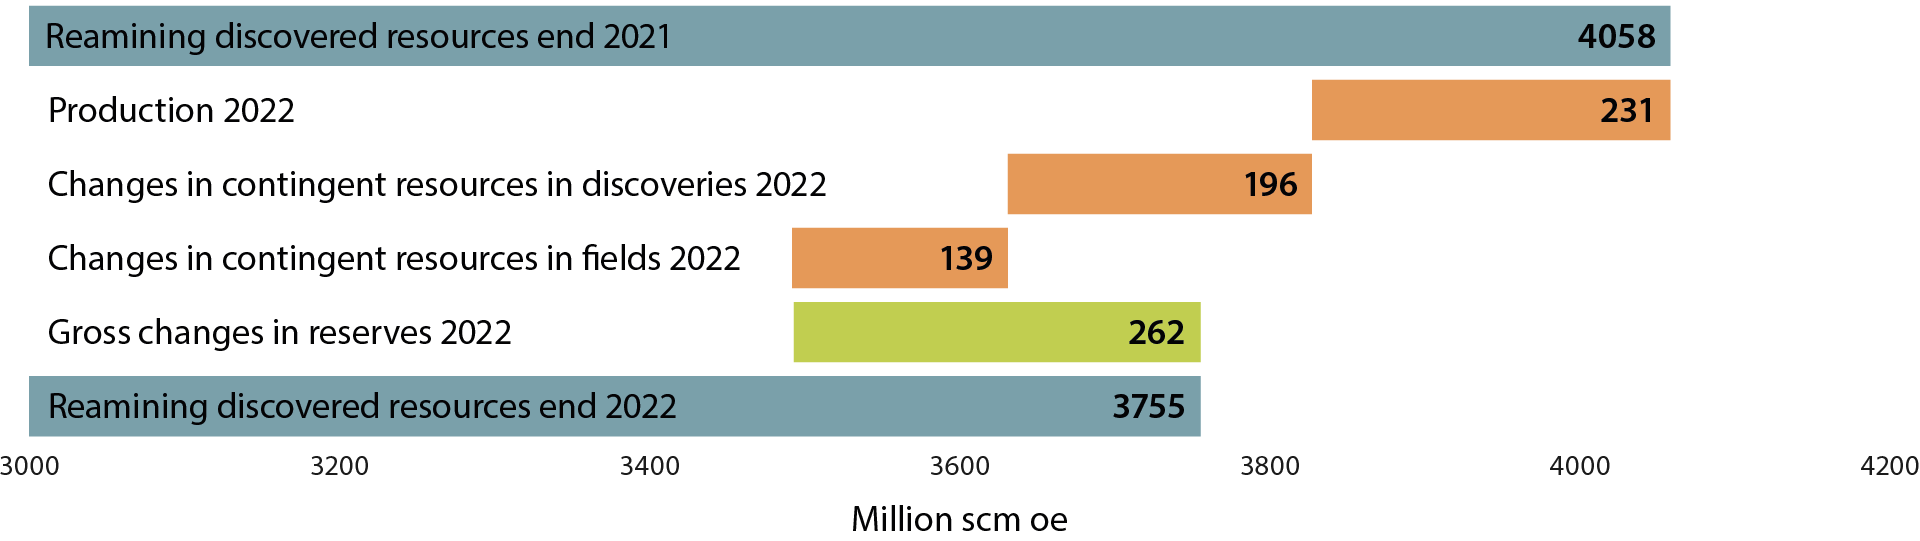
Figure 2-10 Overview of the change in discovered resources from 2021 to 2022