Fields
Reserves in fields have increased substantially in recent years. Combined with cost cuts, that has yielded high value creation. To maintain this position, the licensees must continue to mature resources to reserves and decide on measures to improve recovery.
Production rising
Eighty-five fields were in production on the NCS at 31 August 2019 – 64 in the North Sea, 19 in the Norwegian Sea and two in the Barents Sea. One new field, Aasta Hansteen, came on stream in 2018. Two more, Oda and Trestakk in the North Sea, have so far begun production in 2019. Plans call for Johan Sverdrup, Utgard and Skogul to come on stream in the autumn of 2019, with Bauge, Martin Linge, Yme, Dvalin and Ærfugl due to follow in 2020.
Forecasts up to 2023 show that production will increase from 2020. New fields coming on stream, including Johan Sverdrup, will more than offset declining oil output from fields currently in production.
The NPD has looked at the development of production for fields by size. They are divided into large (more than 50 million scm oe), medium-sized (15-50 million scm oe) and small (less that 15 million scm oe) categories on the basis of historical production and remaining reserves shown in the 2018 resource accounts.
Figure 2.2 shows that overall liquids production from the large fields declined in 2000-18. That was offset to a certain extent by production from and development of a number of medium-sized and small fields. The share of total oil production deriving from medium-sized and small fields rose from five per cent in 2000 to almost 30 per cent in 2018.
Gas production increased over the same period. This offset the decline in oil output, so that the total figure has remained at a relatively high and stable level. Fields with the highest oil output in 2018 were Troll, Ekofisk and Grane. Troll also came top for gas production, followed by Ormen Lange and Åsgard.
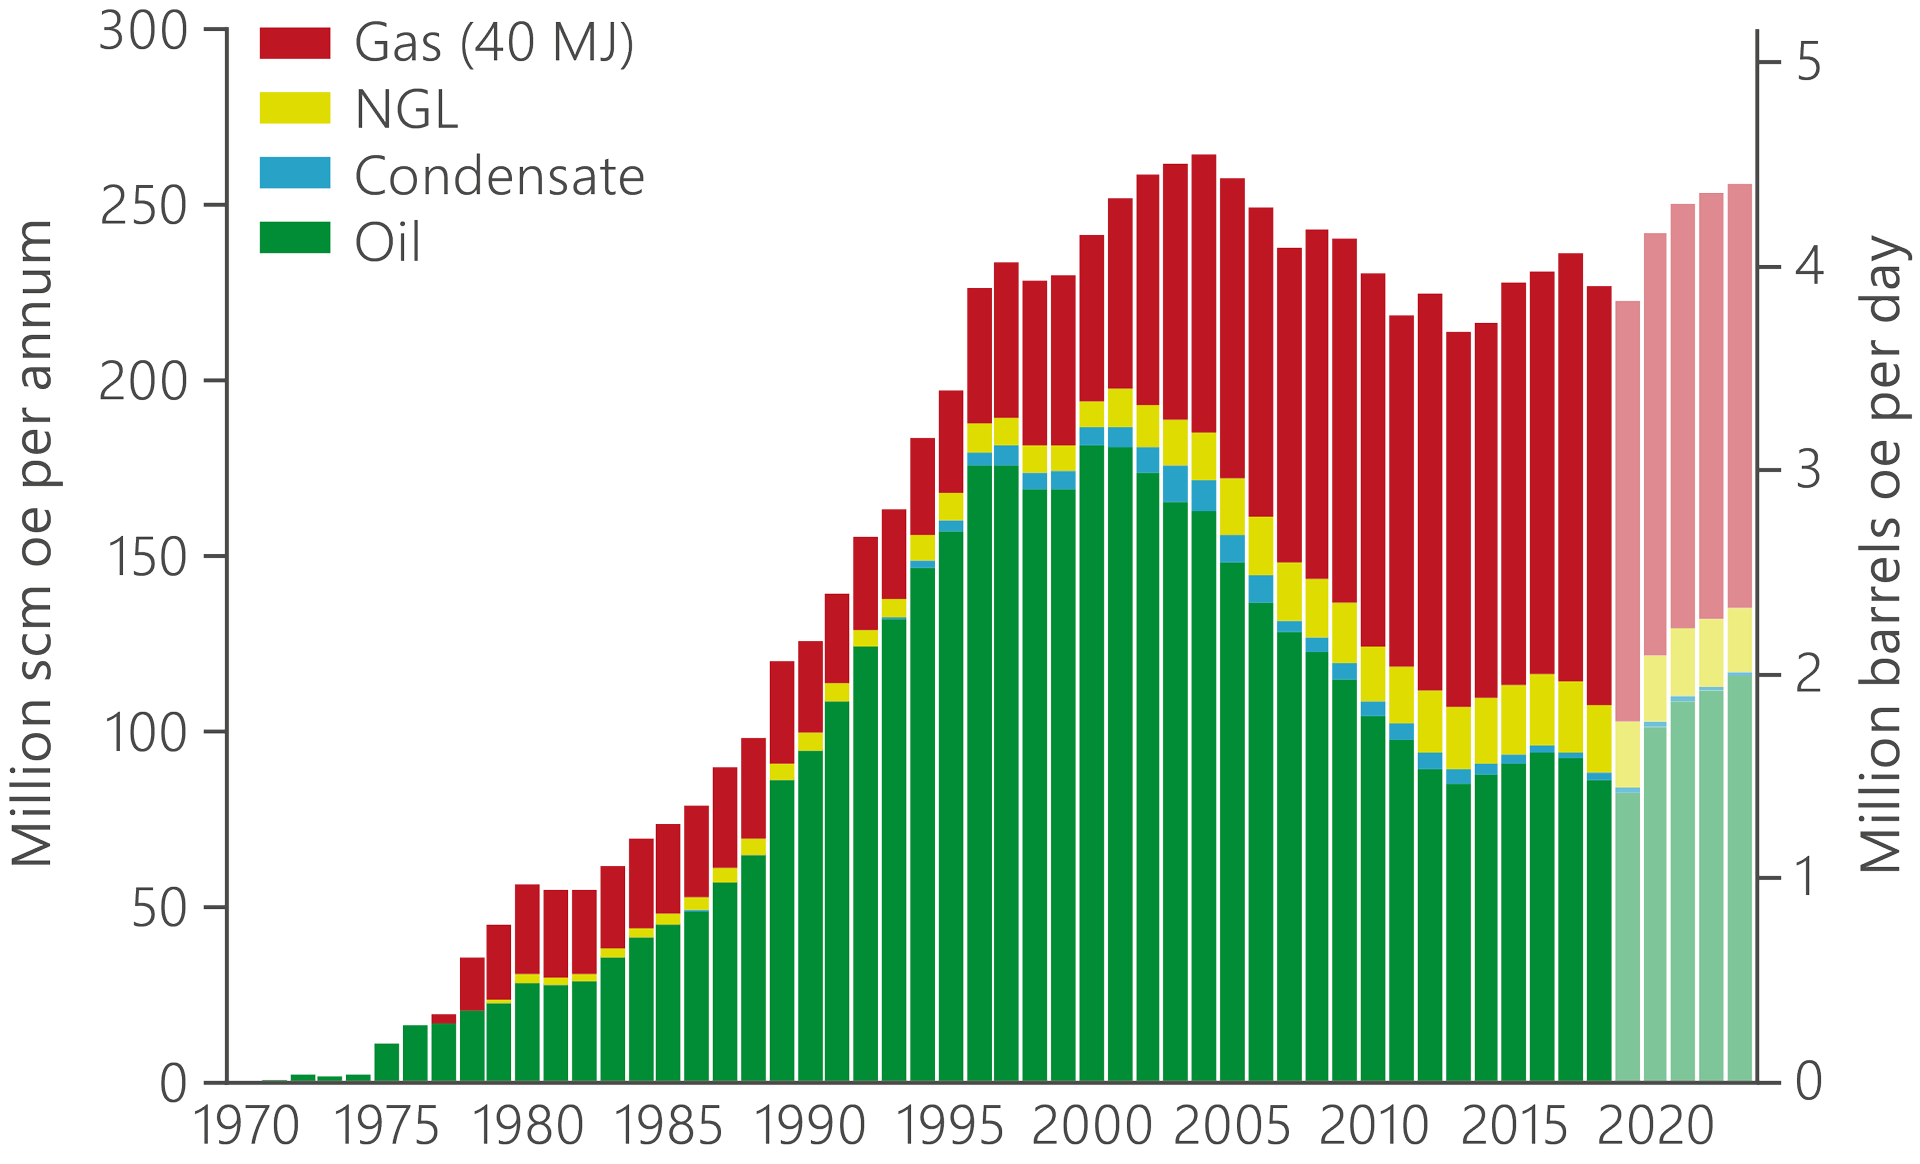
Figure 2.1 Historical development of production and forecasts up to 2023.
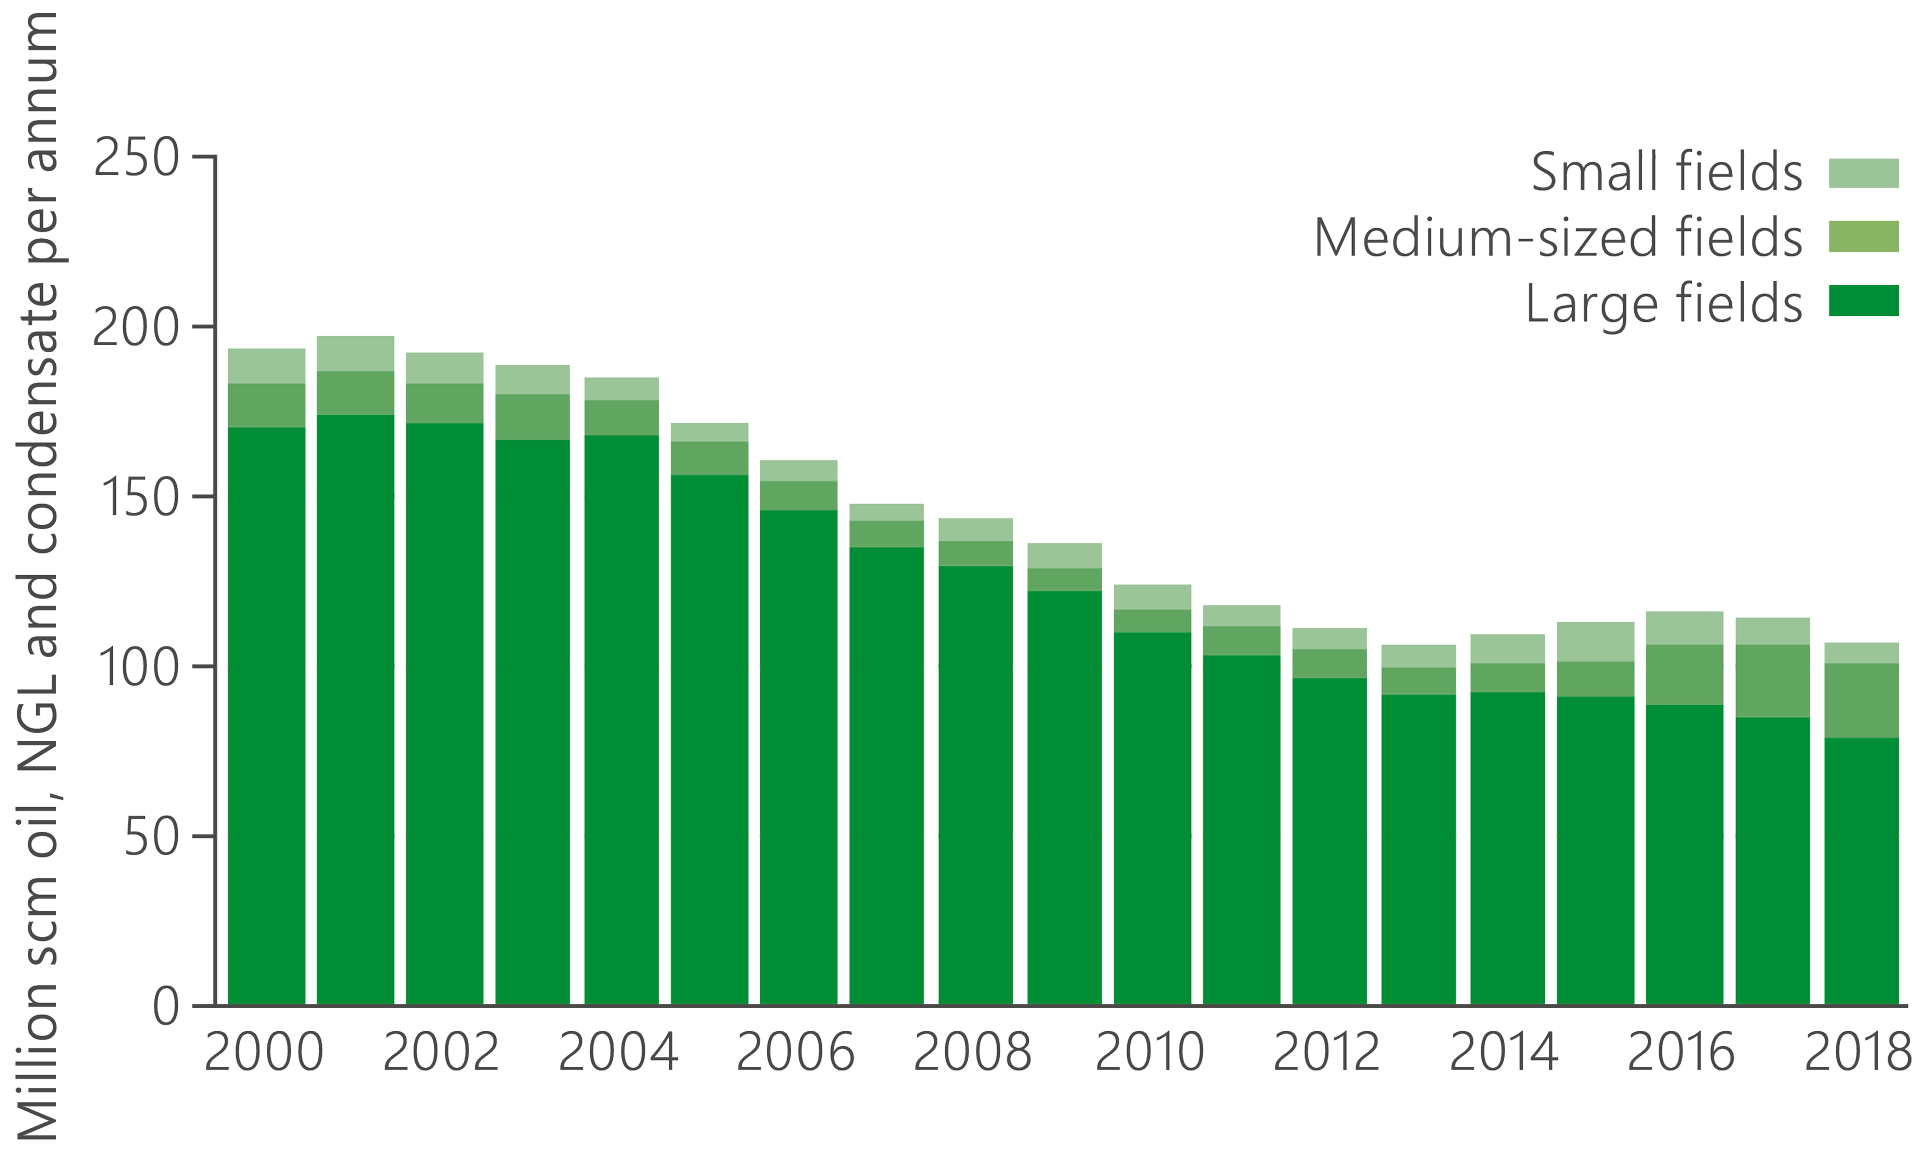
Figure 2.2 Annual liquids production since 2000 by large, medium-sized and small fields.
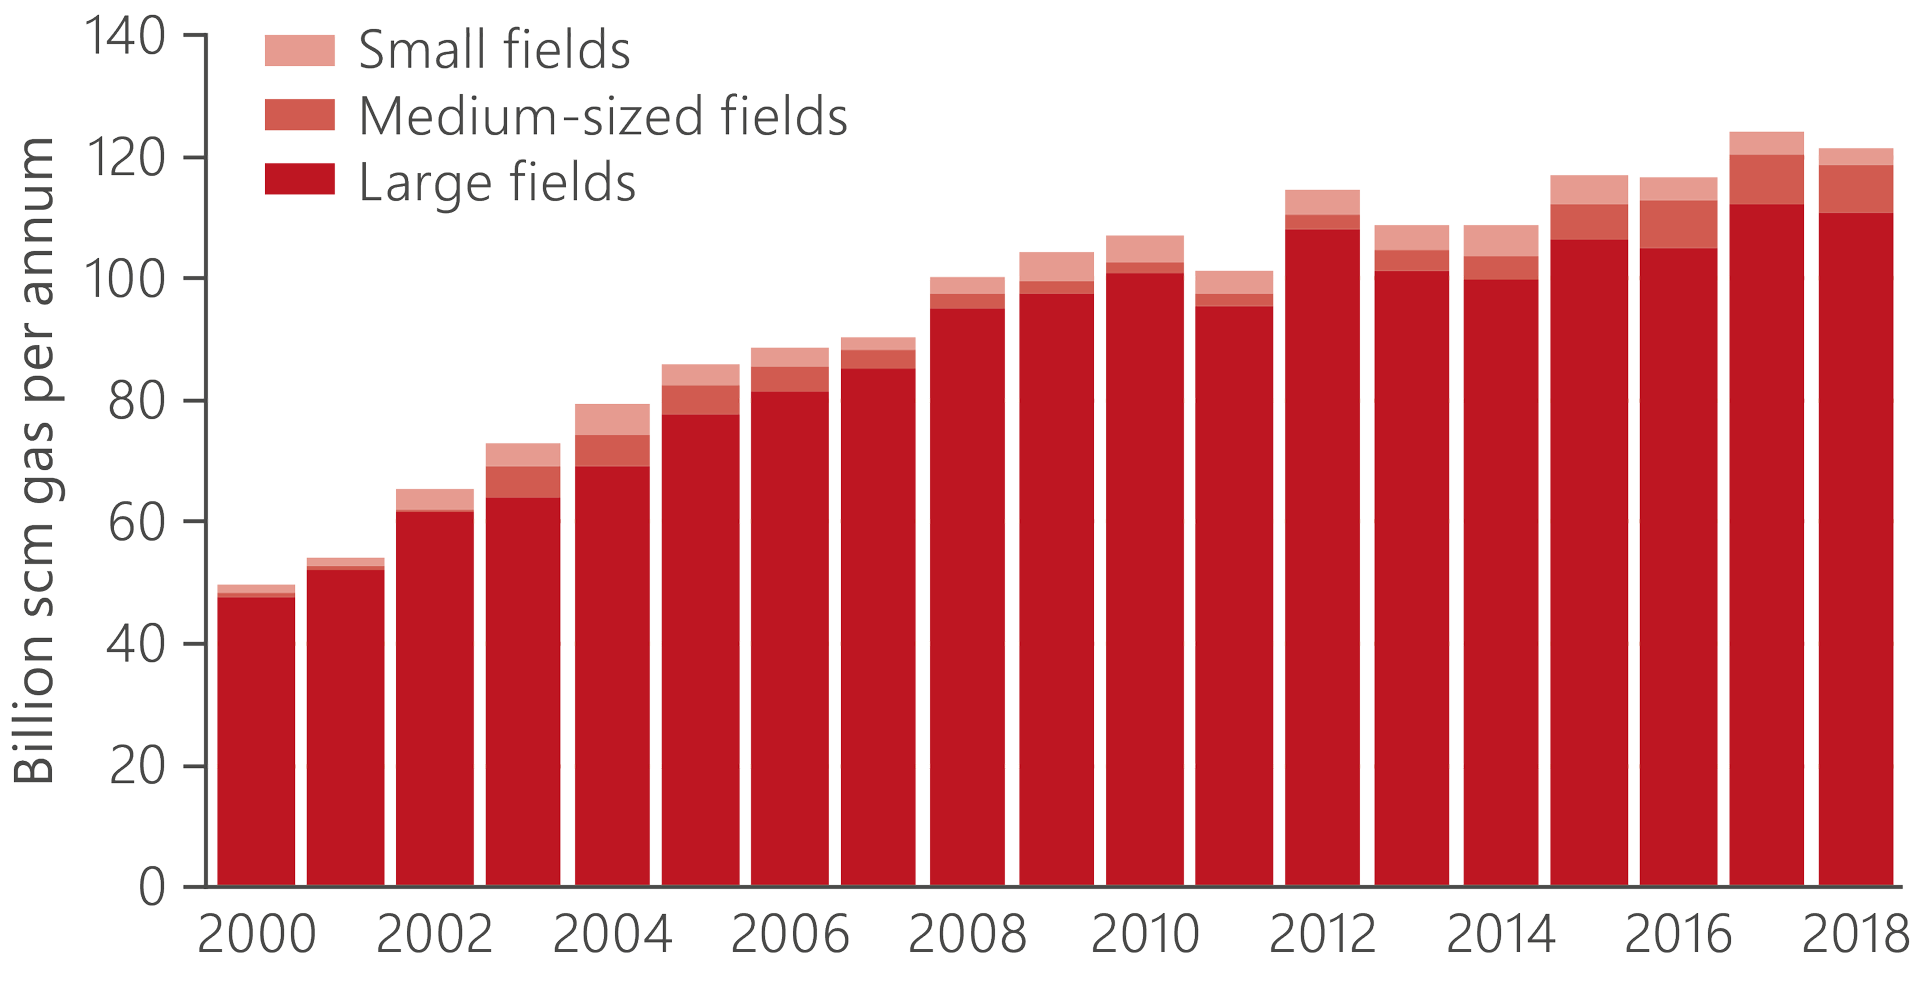
Figure 2.3 Annual gas production by large, medium-sized and small fields.
Development of oil and gas reserves and resources
Fields account for 85 per cent of remaining proven petroleum resources. Maturing resources by deciding to develop discoveries and adopting improved recovery measures on fields mean that reserves – including those already sold and delivered – are rising.
Original reserves and the quantity sold and delivered increased in 2000-18 by about 3 500 million scm oe, equivalent to more than nine Johan Sverdrup fields. Reserves increased more for oil (figure 2.4) than for gas (figure 2.5). This could partly be because less gas than oil has been proven, and because a lack of processing and transport infrastructure in areas of the NCS makes it difficult to develop small gas discoveries.
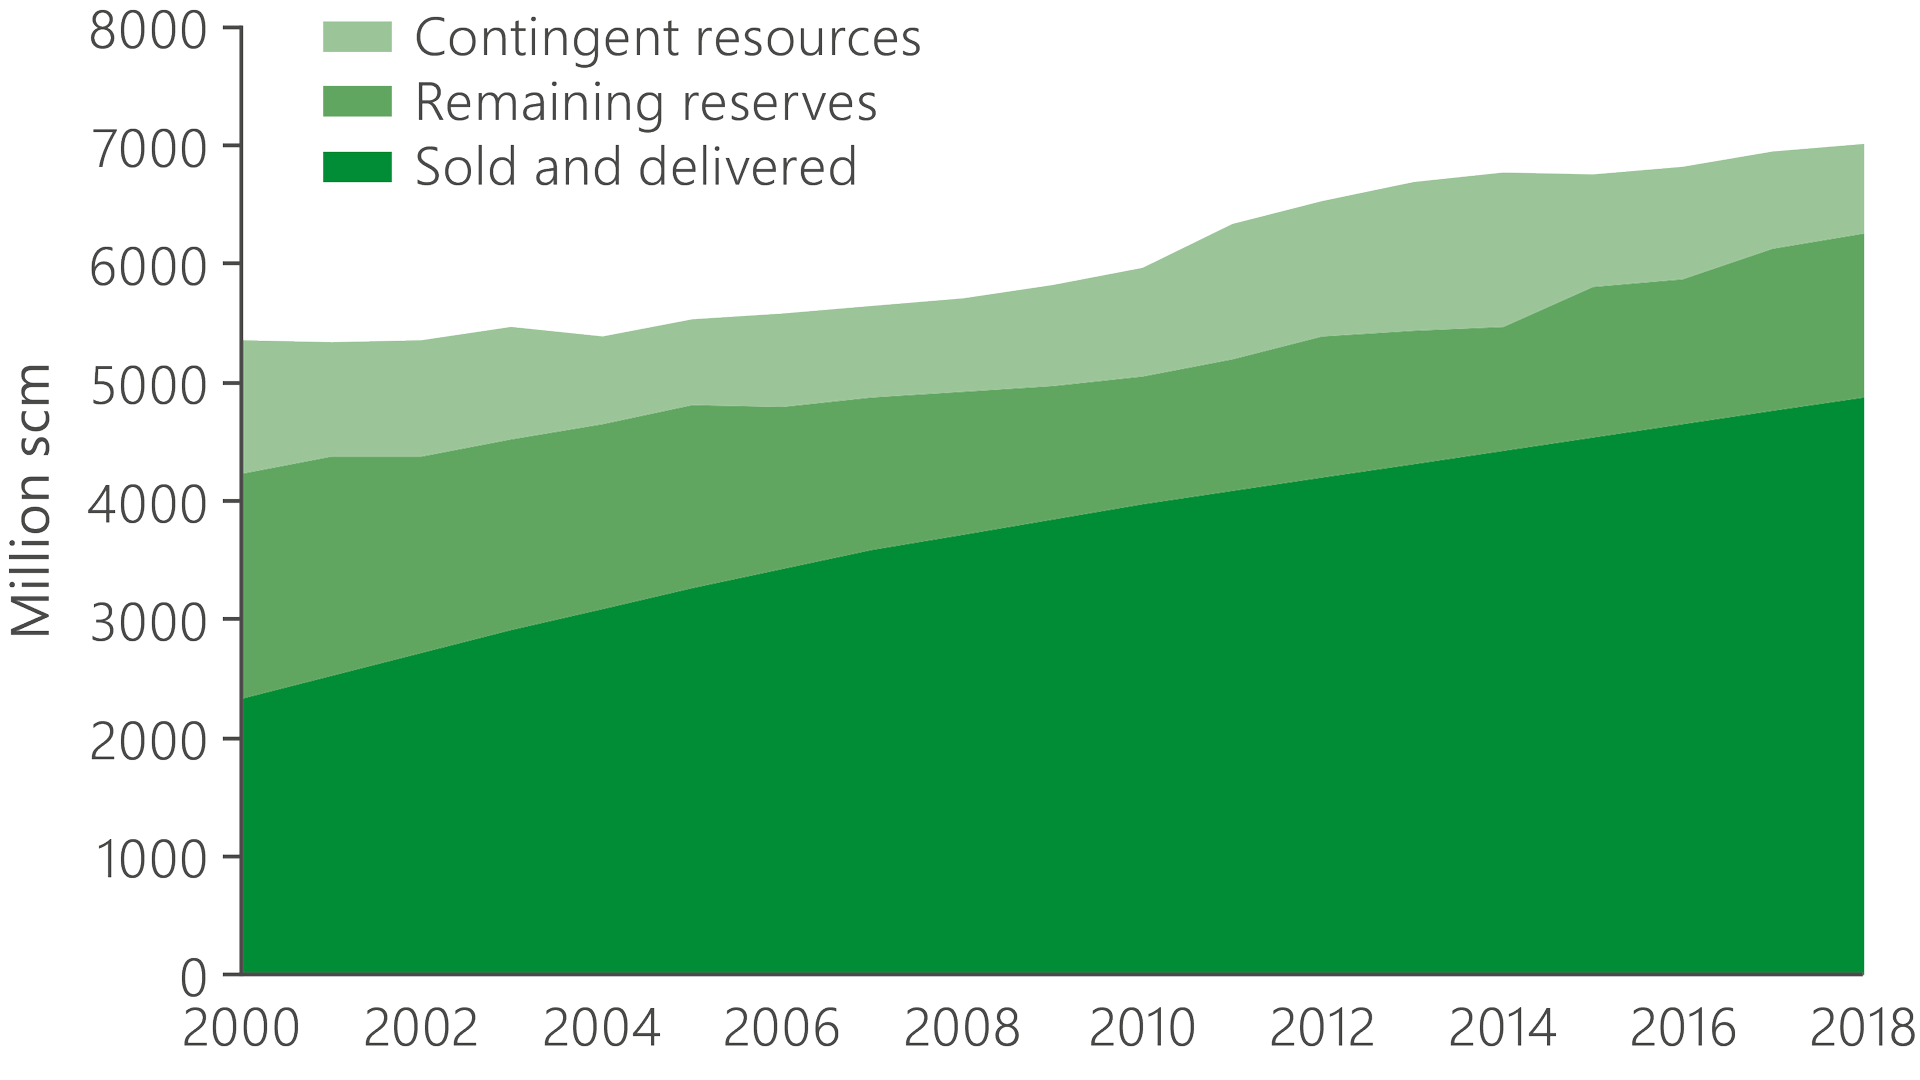
Figure 2.4 Distribution of oil sold and delivered, remaining oil reserve and contingent oil resources.
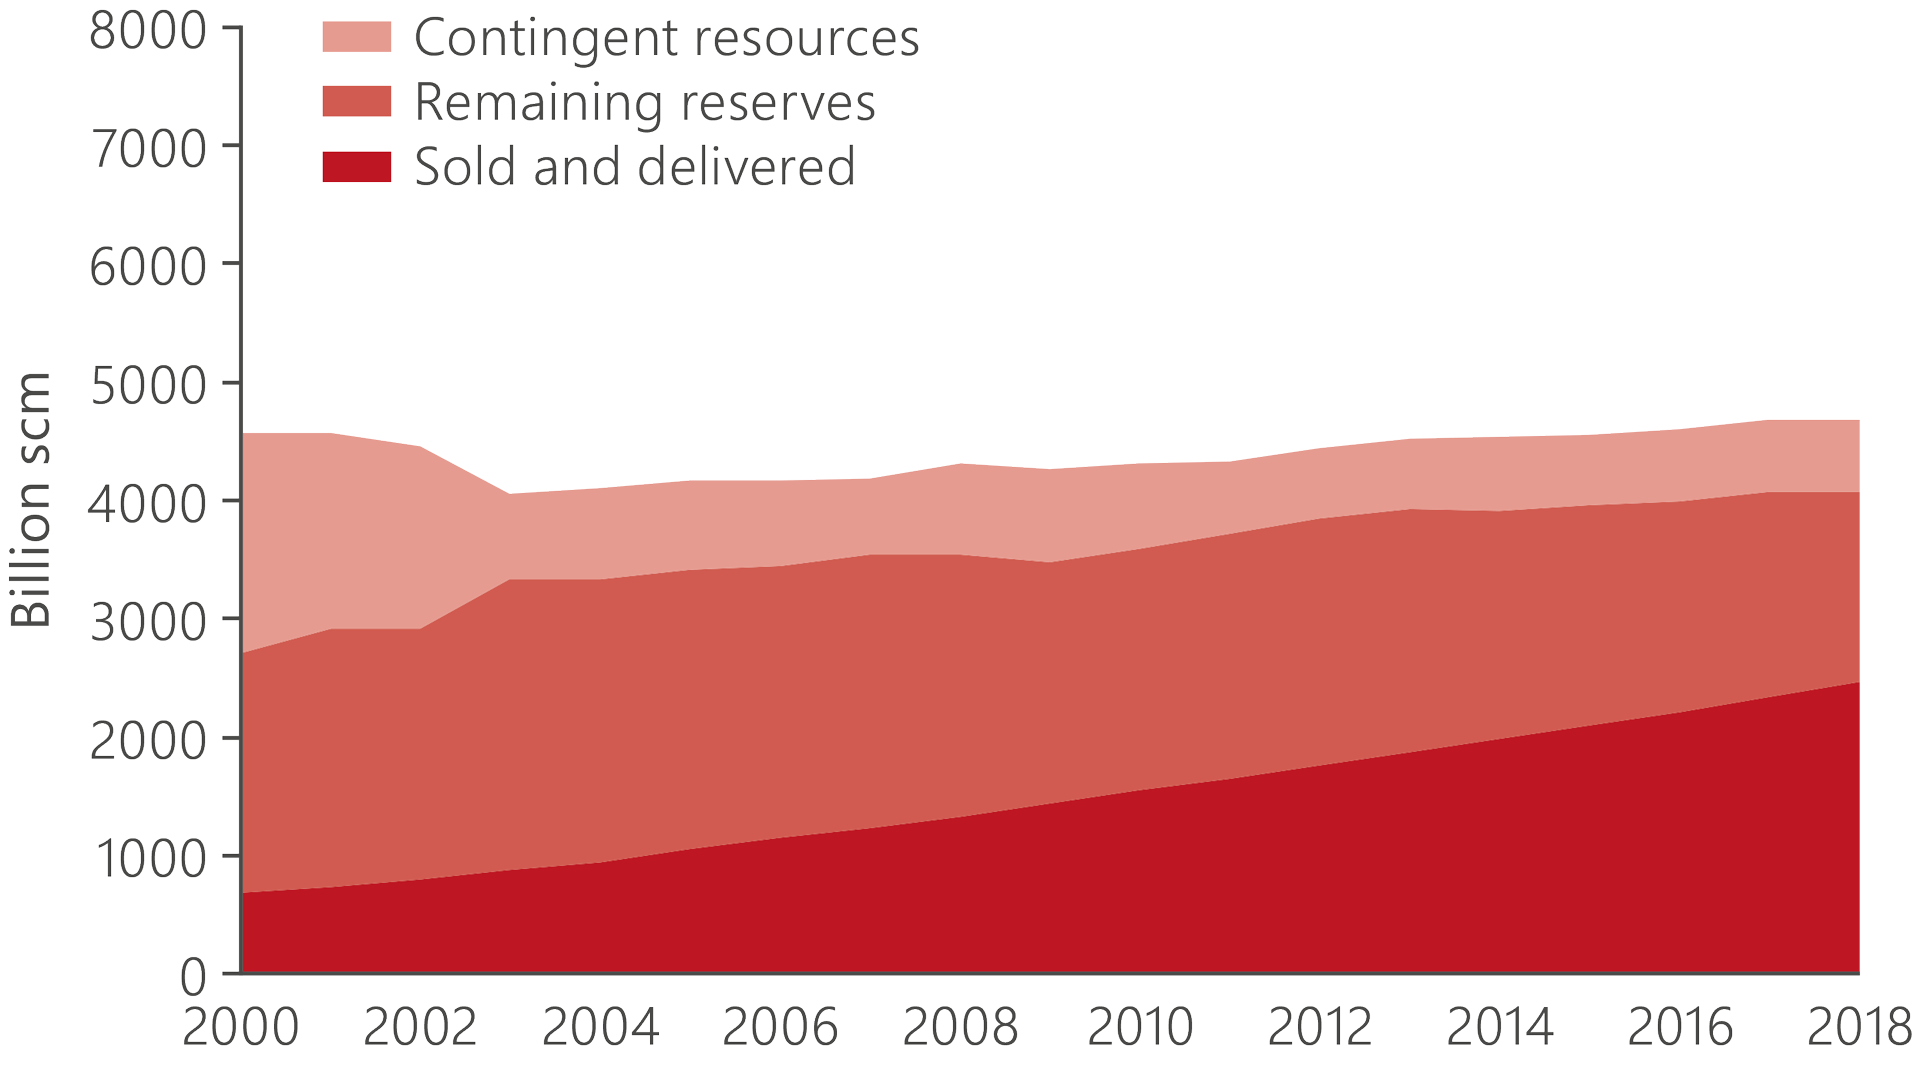
Figure 2.5 Distribution of oil sold and delivered, remaining oil reserve and contingent oil resources.
Recovery factor and reserve growth
Reserve growth for oil and gas fields
As with production, the NPD has mapped which types of fields make the biggest contribution to reserve growth. The same division into large, medium-sized and small fields is applied, with the increase in reserves measured against the figure for 2000 or in the PDO if the field has been developed since that year.
Figure 2.7 presents the results of this mapping, which includes all fields with an absolute change in reserves greater than two million scm oe.
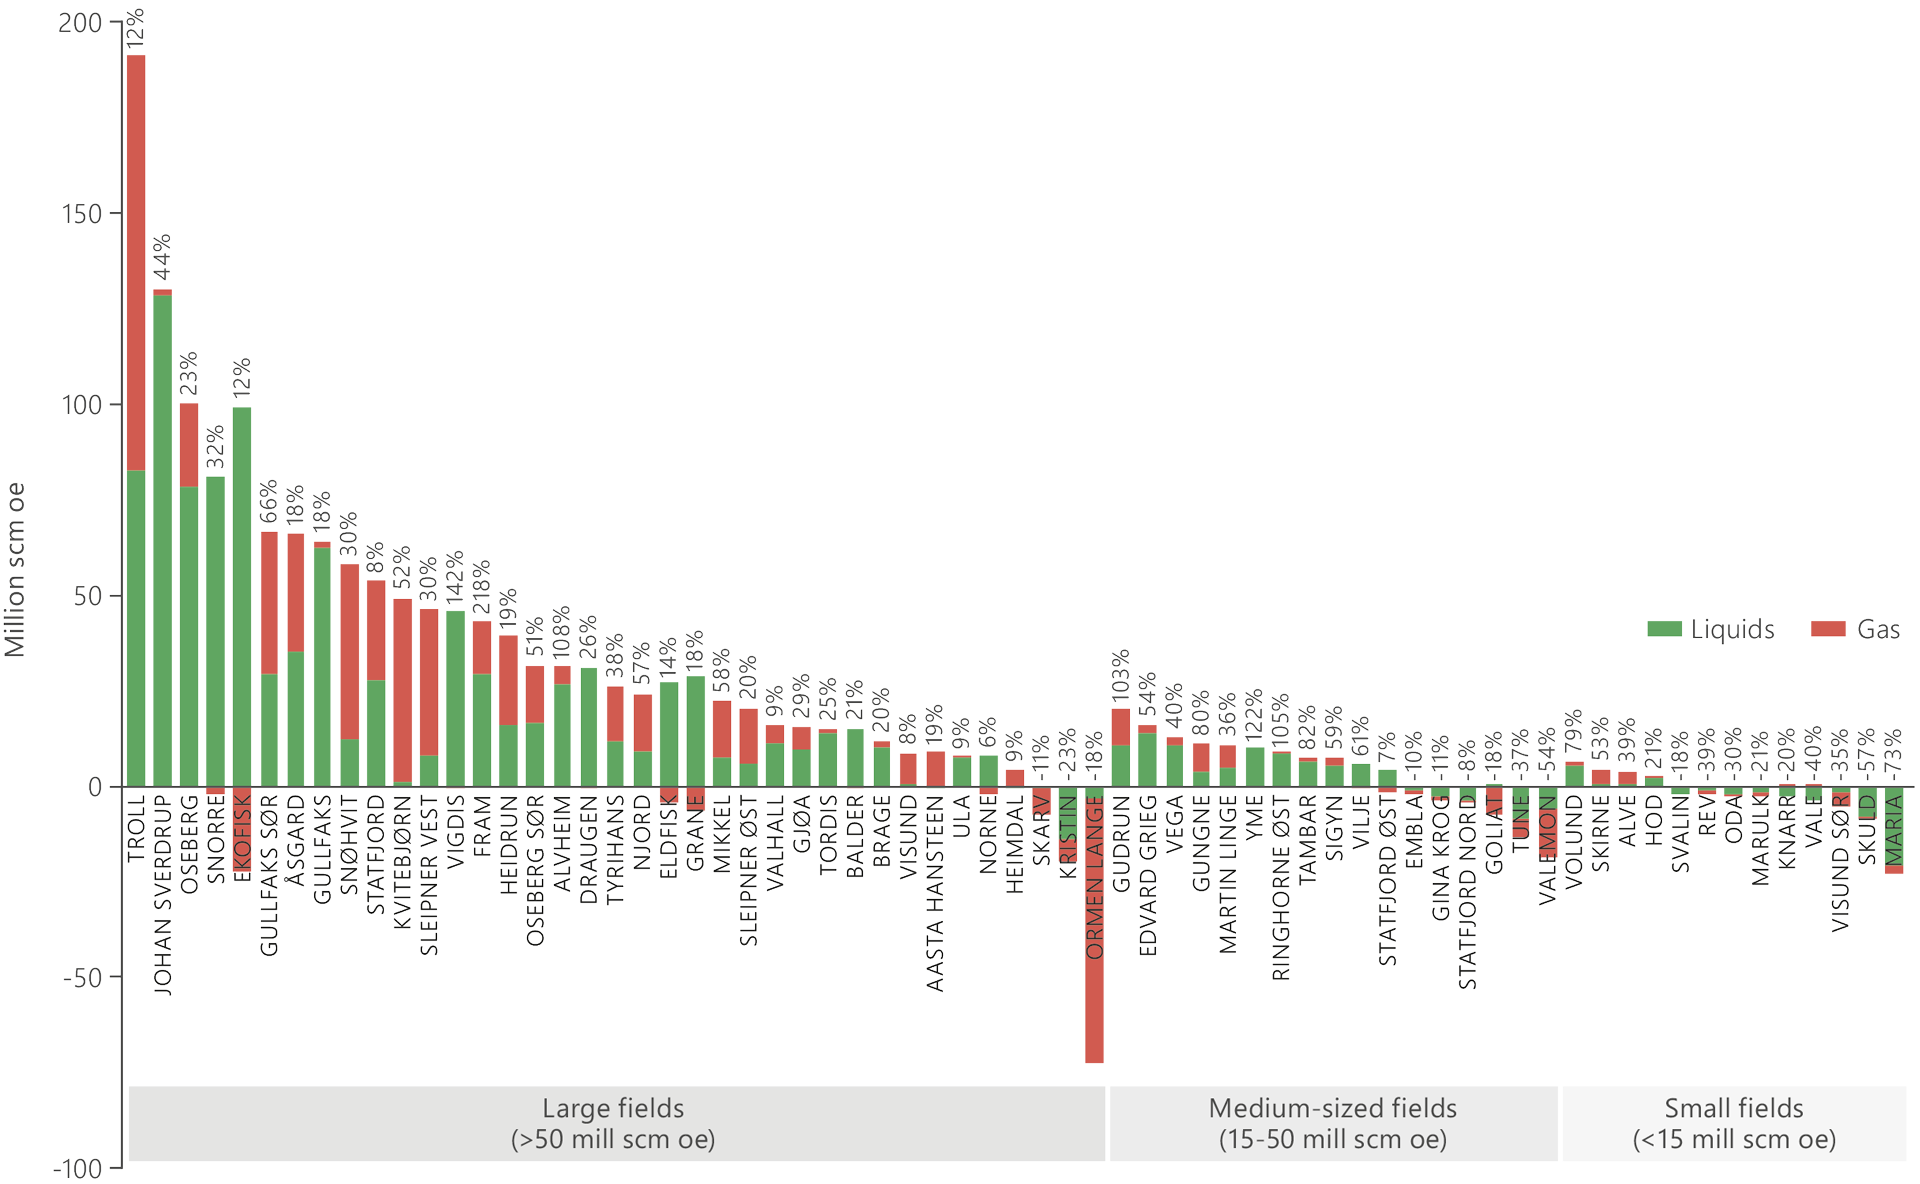
Figure 2.7 Reserve change for liquids (oil, NLG and condensate) from 2000 and 2018 for fields where reserves have changed by more than two million scm oe over the period.
Reserves in fields increased by about 1 400 million scm oe in 2000-18, divided into 1 000 million scm liquids and 400 billion scm gas. This corresponds to more than three Johan Sverdrup fields. The rise reflects decisions on improved recovery measures for large and medium-sized fields. Reserves have declined in certain fields, but the quantity involved is small compared with the overall growth.
The biggest increase in total reserves has been on Troll. Where oil is concerned, this mainly reflects new drilling and well technology which gives both more cost-effective wells and higher recovery per well. Drilling has also been pursued continuously on the field with several rigs over many years. Gas reserves have risen because the Troll Phase 3 project for increased gas offtake has been given the go-ahead. Reserves in Johan Sverdrup have grown because the decision has been taken on the second development stage.
Maria and Ormen Lange in the Norwegian Sea are examples of fields where reserves have declined. Production experience and data acquisition have shown that their reservoir properties are poorer than expected, and that the volumes present are below earlier assessments. However, new measures planned on these fields could increase reserves from the 2018 estimates.
Figure 2.8 presents the average change in oil reserves for large, medium-sized and small fields during the period. Oil reserves from large and medium-sized fields increased steadily. The changes varied for small fields and their oil reserves have declined on average.
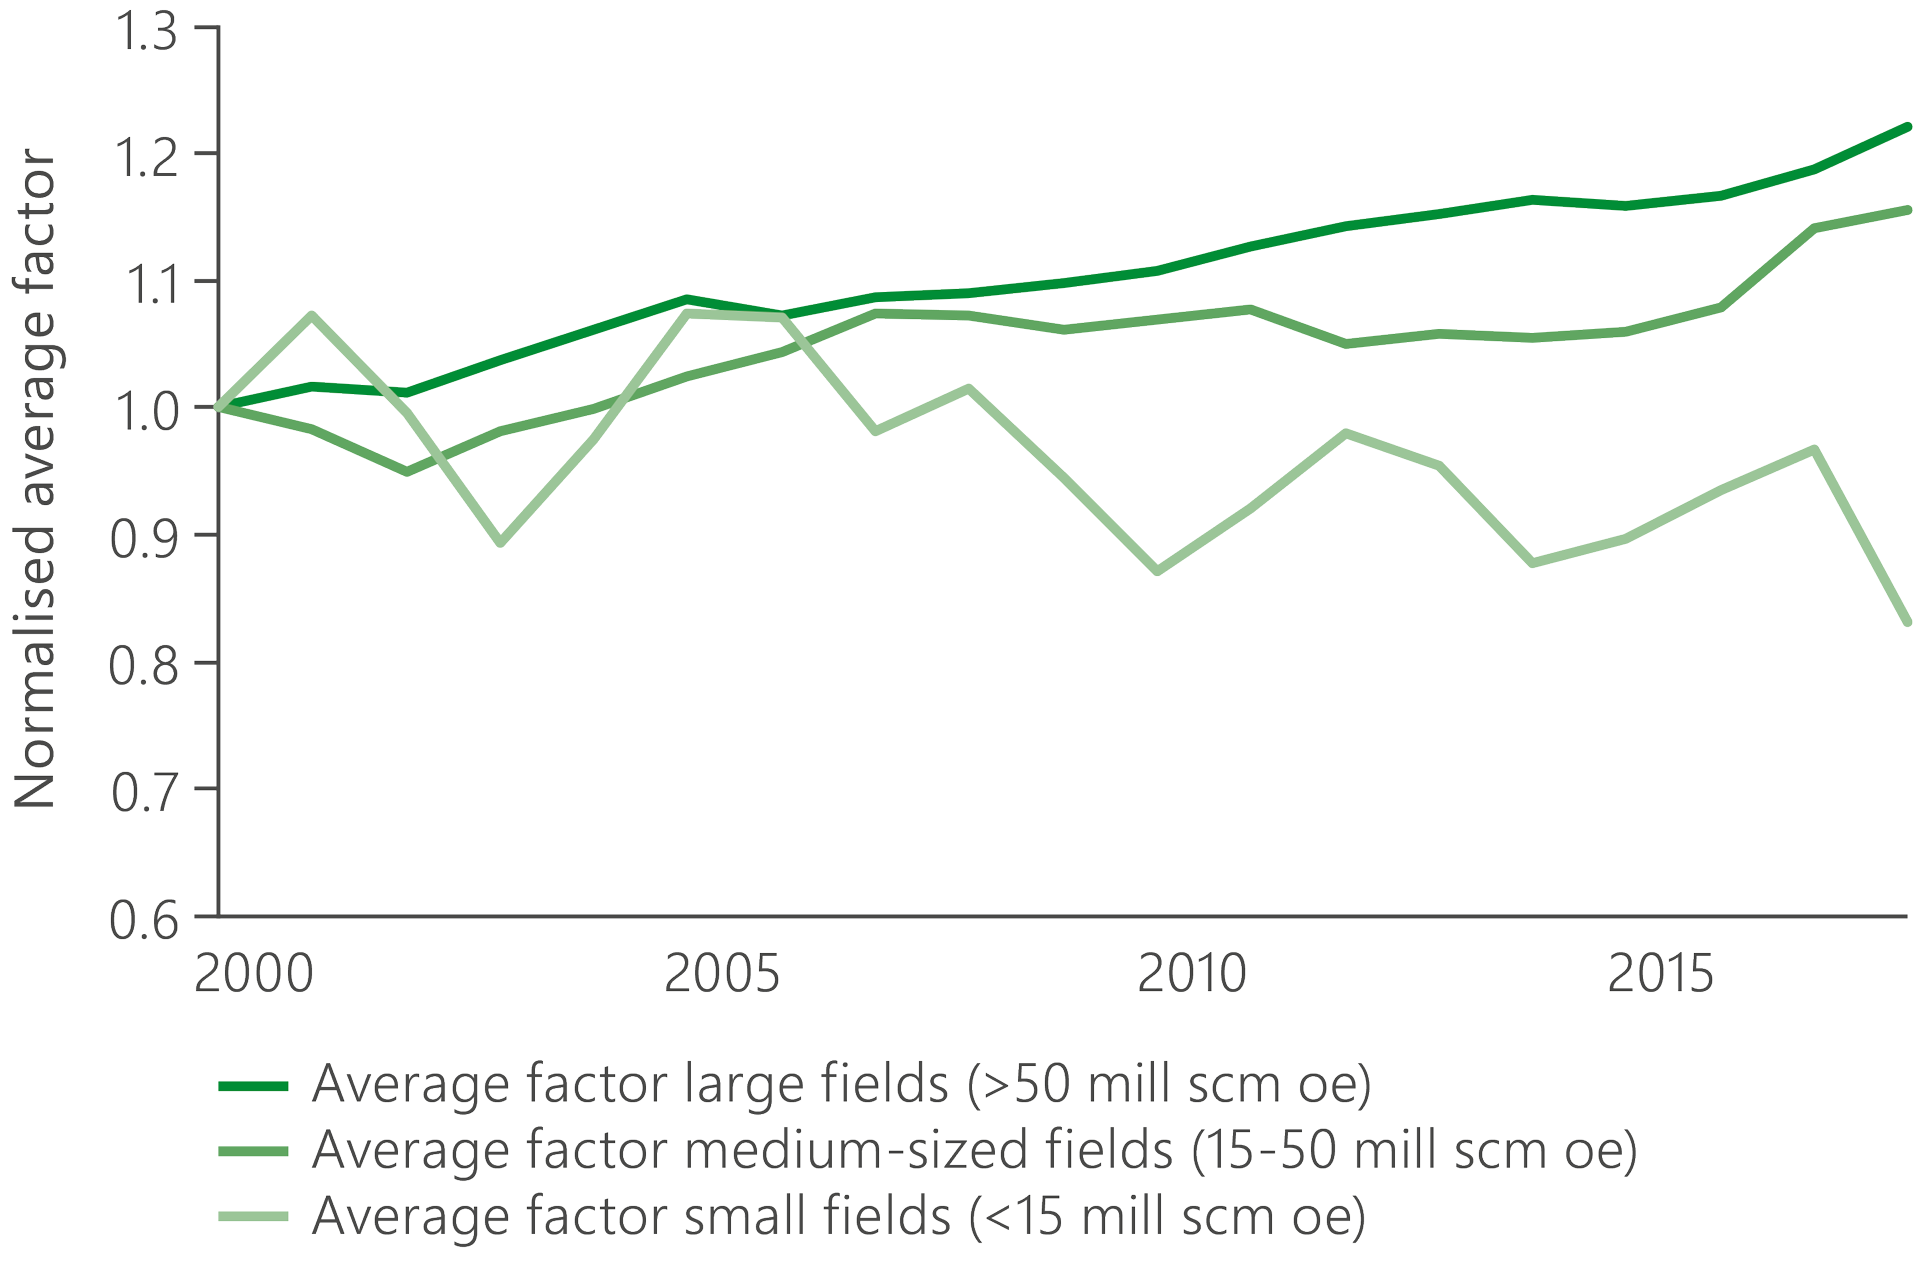
Figure 2.8 The average change in oil reserves since 2000 for large, medium-sized and small fields.
The resource estimates are uncertain, and all discoveries have resource-related upsides and downsides when developed. However, several factors could explain why reserve growth has been highest for the large fields.
Licensees in large discoveries often take a development decision on the basis of the resources required to achieve profitable production, and build in flexibility which means that additional resources can be realised over time. These provide reserve growth.
Smaller discoveries have a lower resource base. That means it is often the case that fewer appraisal wells are drilled before the PDO, so that the decision base may be relatively more uncertain. It is therefore important that companies planning to develop smaller discoveries maximise data acquisition from wells and other sources in order to reduce uncertainty.
Many fields have been developed with estimated resources below 15 million scm oe since 2000. These collectively contain some 200 million scm oe in reserves. Despite an average reserve decline, the small fields make an important contribution to total reserves. This demonstrates the importance of continuing to find good solutions in order to make small discoveries commercial, particularly because both discoveries in the portfolio and new finds are becoming smaller.
Vigdis - a subsea development with substantial reserve growth
A maturing NCS
A number of the large fields are now in a mature phase and have produced a large proportion of their original reserves. At the same time, several fields – such as Johan Sverdrup and Johan Castberg in the North and Barents Seas respectively – are under development and will contribute to a continued high level of production during the 2020s. Figures 2.10 and 2.11 present the remaining share of original oil and gas reserves for a number of fields. The size of the circles indicates remaining reserves.
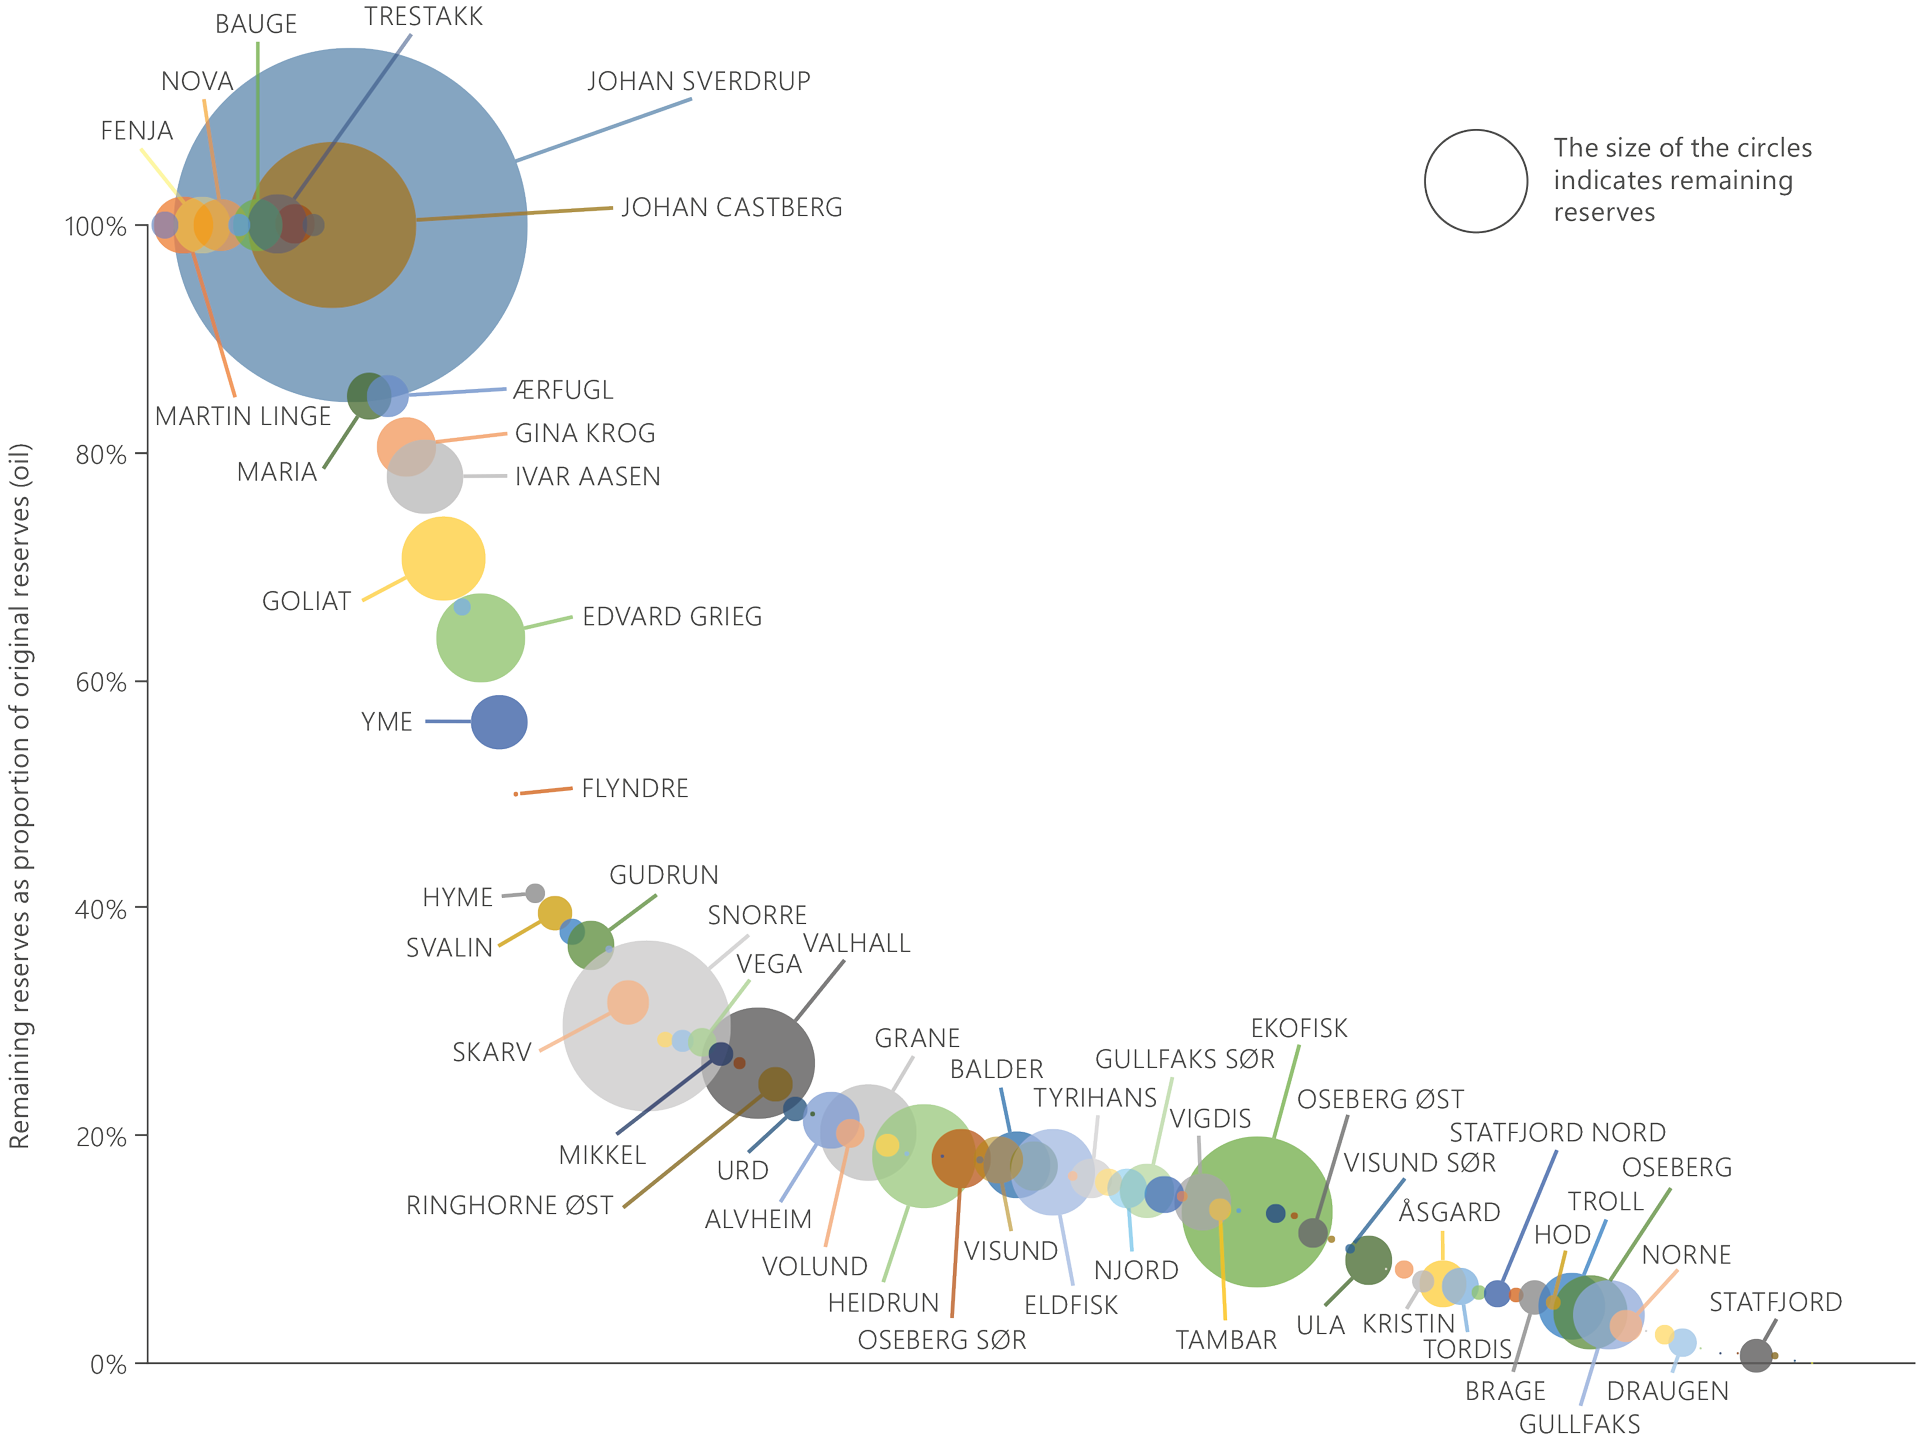 Figure 2.10 Remaining proportion of the original oil reserves and the size of remaining oil reserves.
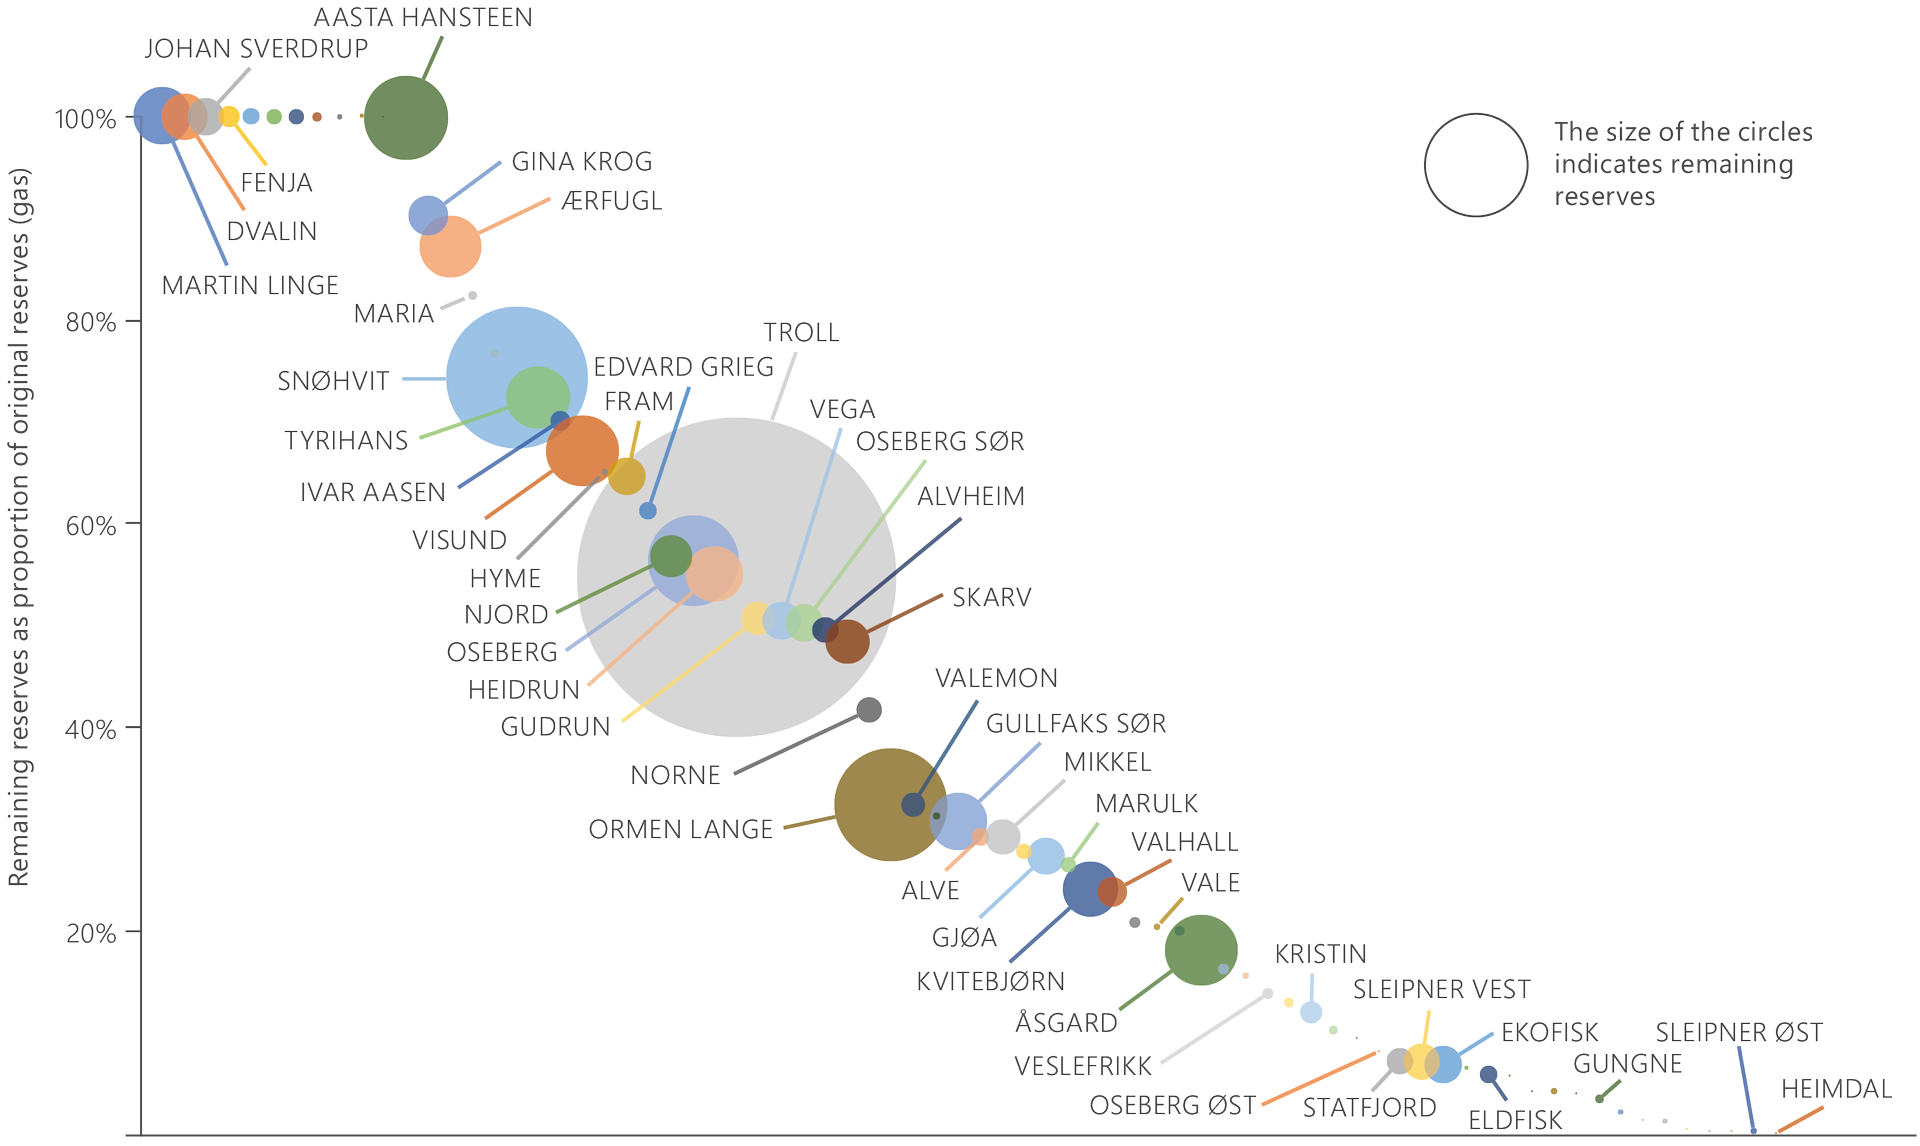
Figure 2.11 Remaining proportion of the original gas reserves and the size of remaining gas reserves.
Fields such as Snorre, Valhall, Grane, Heidrun and Ekofisk still have substantial remaining oil reserves. They nevertheless account for only 15-30 per cent of the original reserves.
Troll is very important for Norwegian gas production, and will remain so for a long time even though almost half its reserves have been produced. Large fields such as Snøhvit, Oseberg, Ormen Lange and Åsgard also have substantial remaining gas reserves. Most of the gas fields under development are medium-sized, such as Martin Linge and Dvalin.
Aasta Hansteen is a new gas field in the Norwegian Sea which came on stream in December 2018. This development has established new gas infrastructure in the northern Norwegian Sea.
Measures for improved recovery from fields
Many fields contain substantial oil volumes over and above those covered by production plans, and will be shut down with large quantities of residual oil in their reservoirs. Efforts to adopt improved recovery measures, so that all resources of commercial value to society get produced, are therefore important. Figure 2.12 presents produced oil, remaining oil reserves and residual oil after planned production cessation for the largest oil fields.
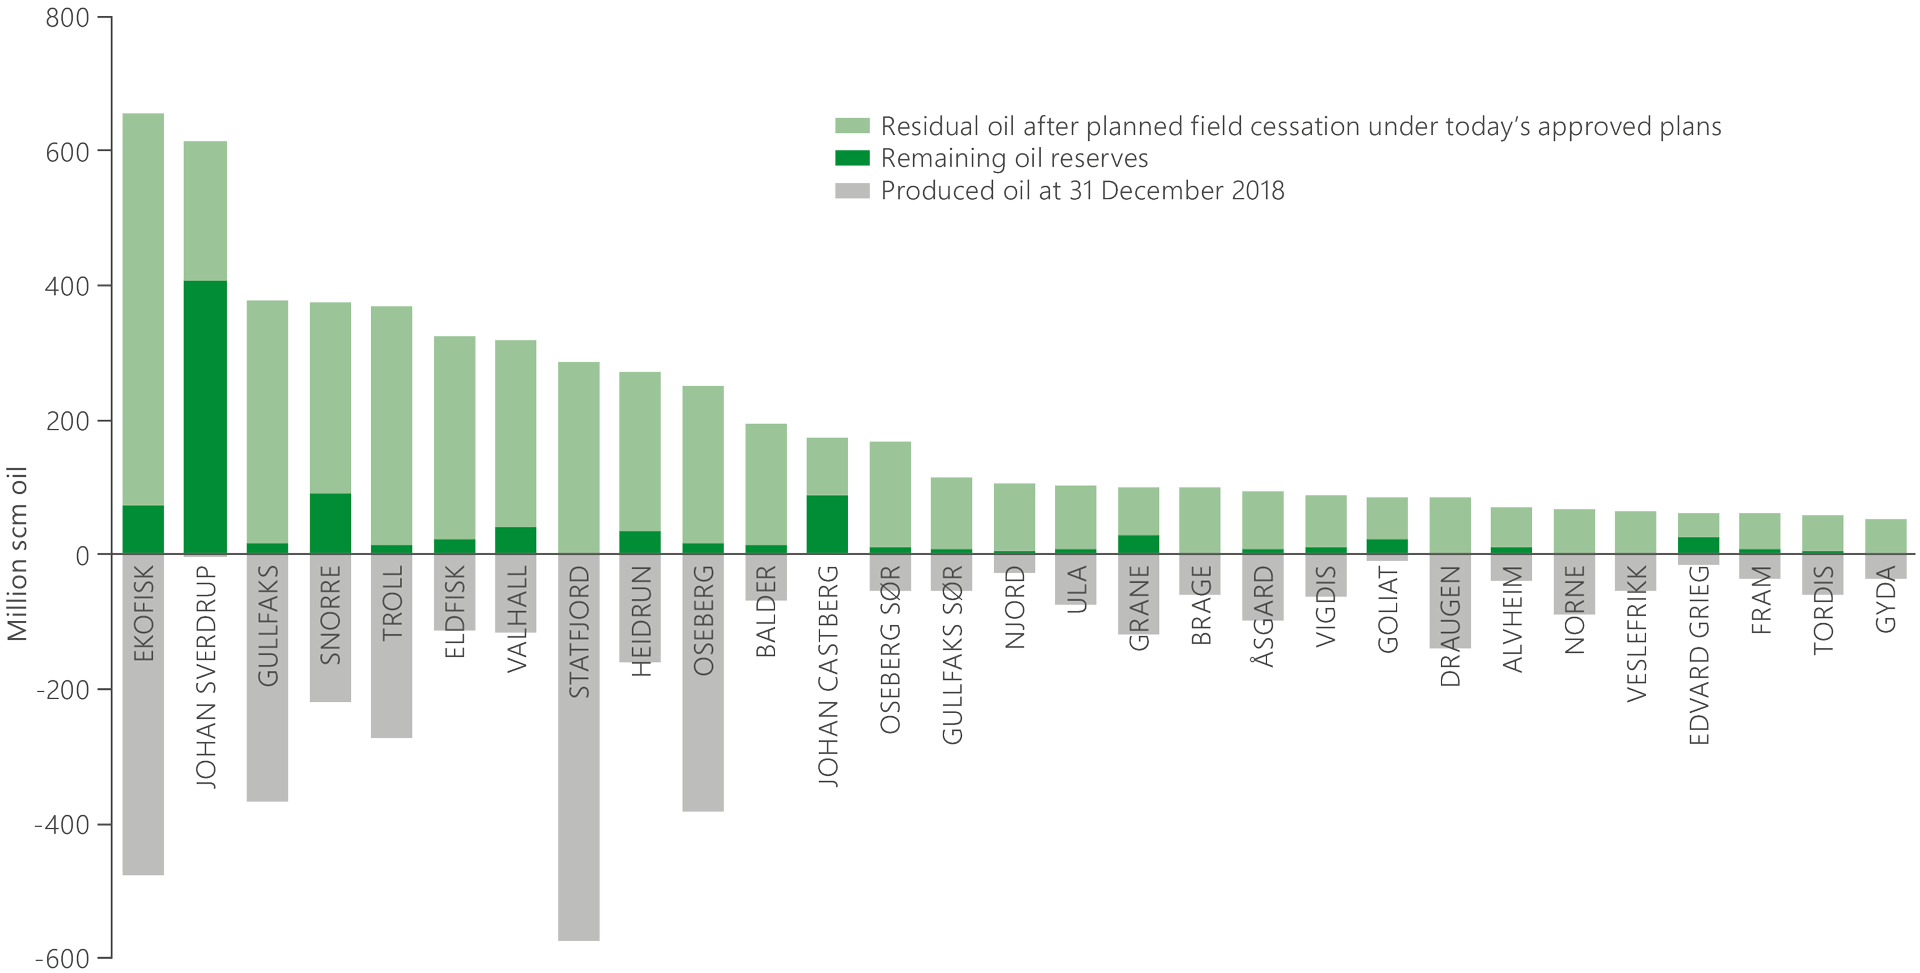
Figure 2.12 Remaining oil reserves, residual roportion of the original gas reserves and the size of remaining gas reserves.
The companies reported about 150 specific projects (RCs 4 and 5) in 2018 for increased oil and gas production, covering some 400 million scm oe. In addition to specific projects, possible but non-specific measures for improved oil recovery (RC 7) are reported. The NPD estimates that these measures could lead to the recovery of 200 million scm oe in all. A total of 600 million scm oe were thereby classified as contingent resources in fields at 31 December 2018.
An overview of various types of specific but undecided projects for improving recovery from fields is presented in figure 2.13 by type of project, with associated resources shown in oe.
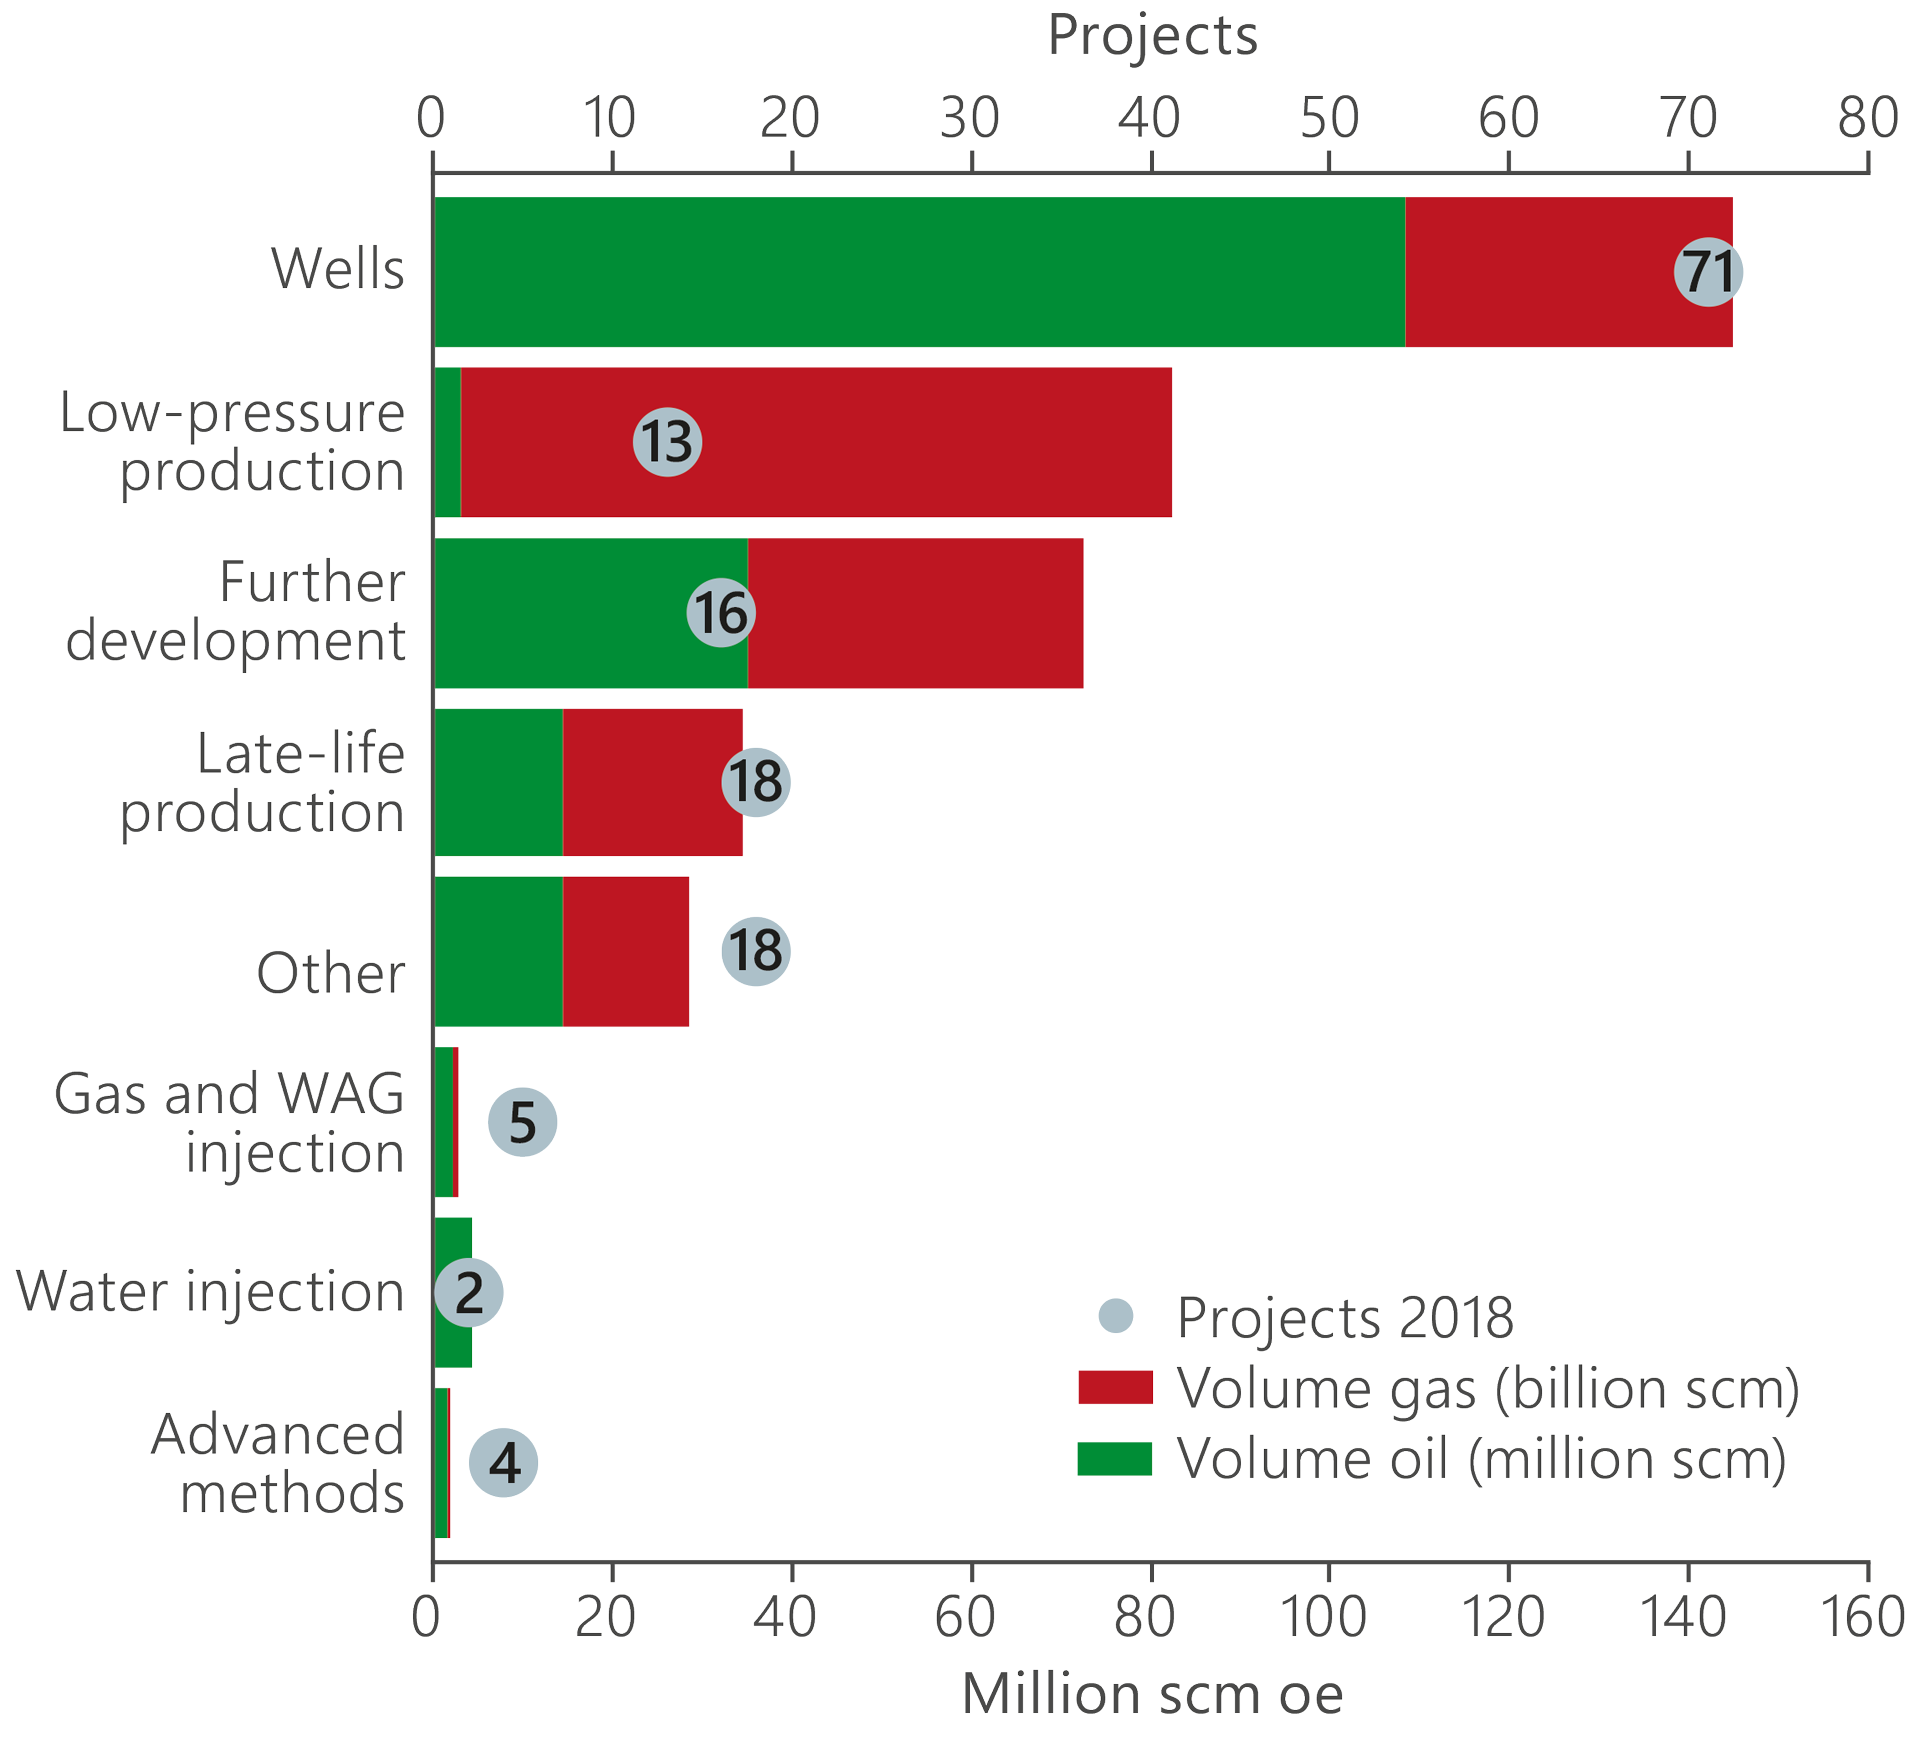
Figure 2.13 Projects and estimated recoverable volumes for oil by project category.
Reported projects for improving recovery are dominated by new wells, in terms of both number of projects (71) and volume (145 million scm oe). Others which make a big contribution are further developments, particularly subsea projects involving new templates tied back to existing facilities and totalling more than 70 million scm oe of oil, and low pressure production providing 80 million scm oe – primarily gas.
Few measures involving the adoption of advanced recovery methods have been reported, and total a modest recoverable volume of two million scm. One of these projects assumes injection of polymer/surfactant, while the others involve fracturing the reservoir to enhance well productivity.
Adopting enhanced oil recovery (EOR) methods could contribute to recovering substantial volumes if they are qualified. Proving these methods out on the fields is crucial in this respect. Chapter 3 presents the results of a study on the resource potential offered by advanced techniques on the NCS.
Low-pressure production on Ormen Lange
Gullfaks – success story in the "golden block"
Development wells
Drilling more development wells is the most important factor for improving recovery. In addition to producing oil and gas, wells are an important source of data acquisition and thereby of better reservoir understanding. Just over NOK 60 billion was invested in fields on stream in 2018. More than half of this spending related to wells. Figure 2.16 presents overall investment by various categories.
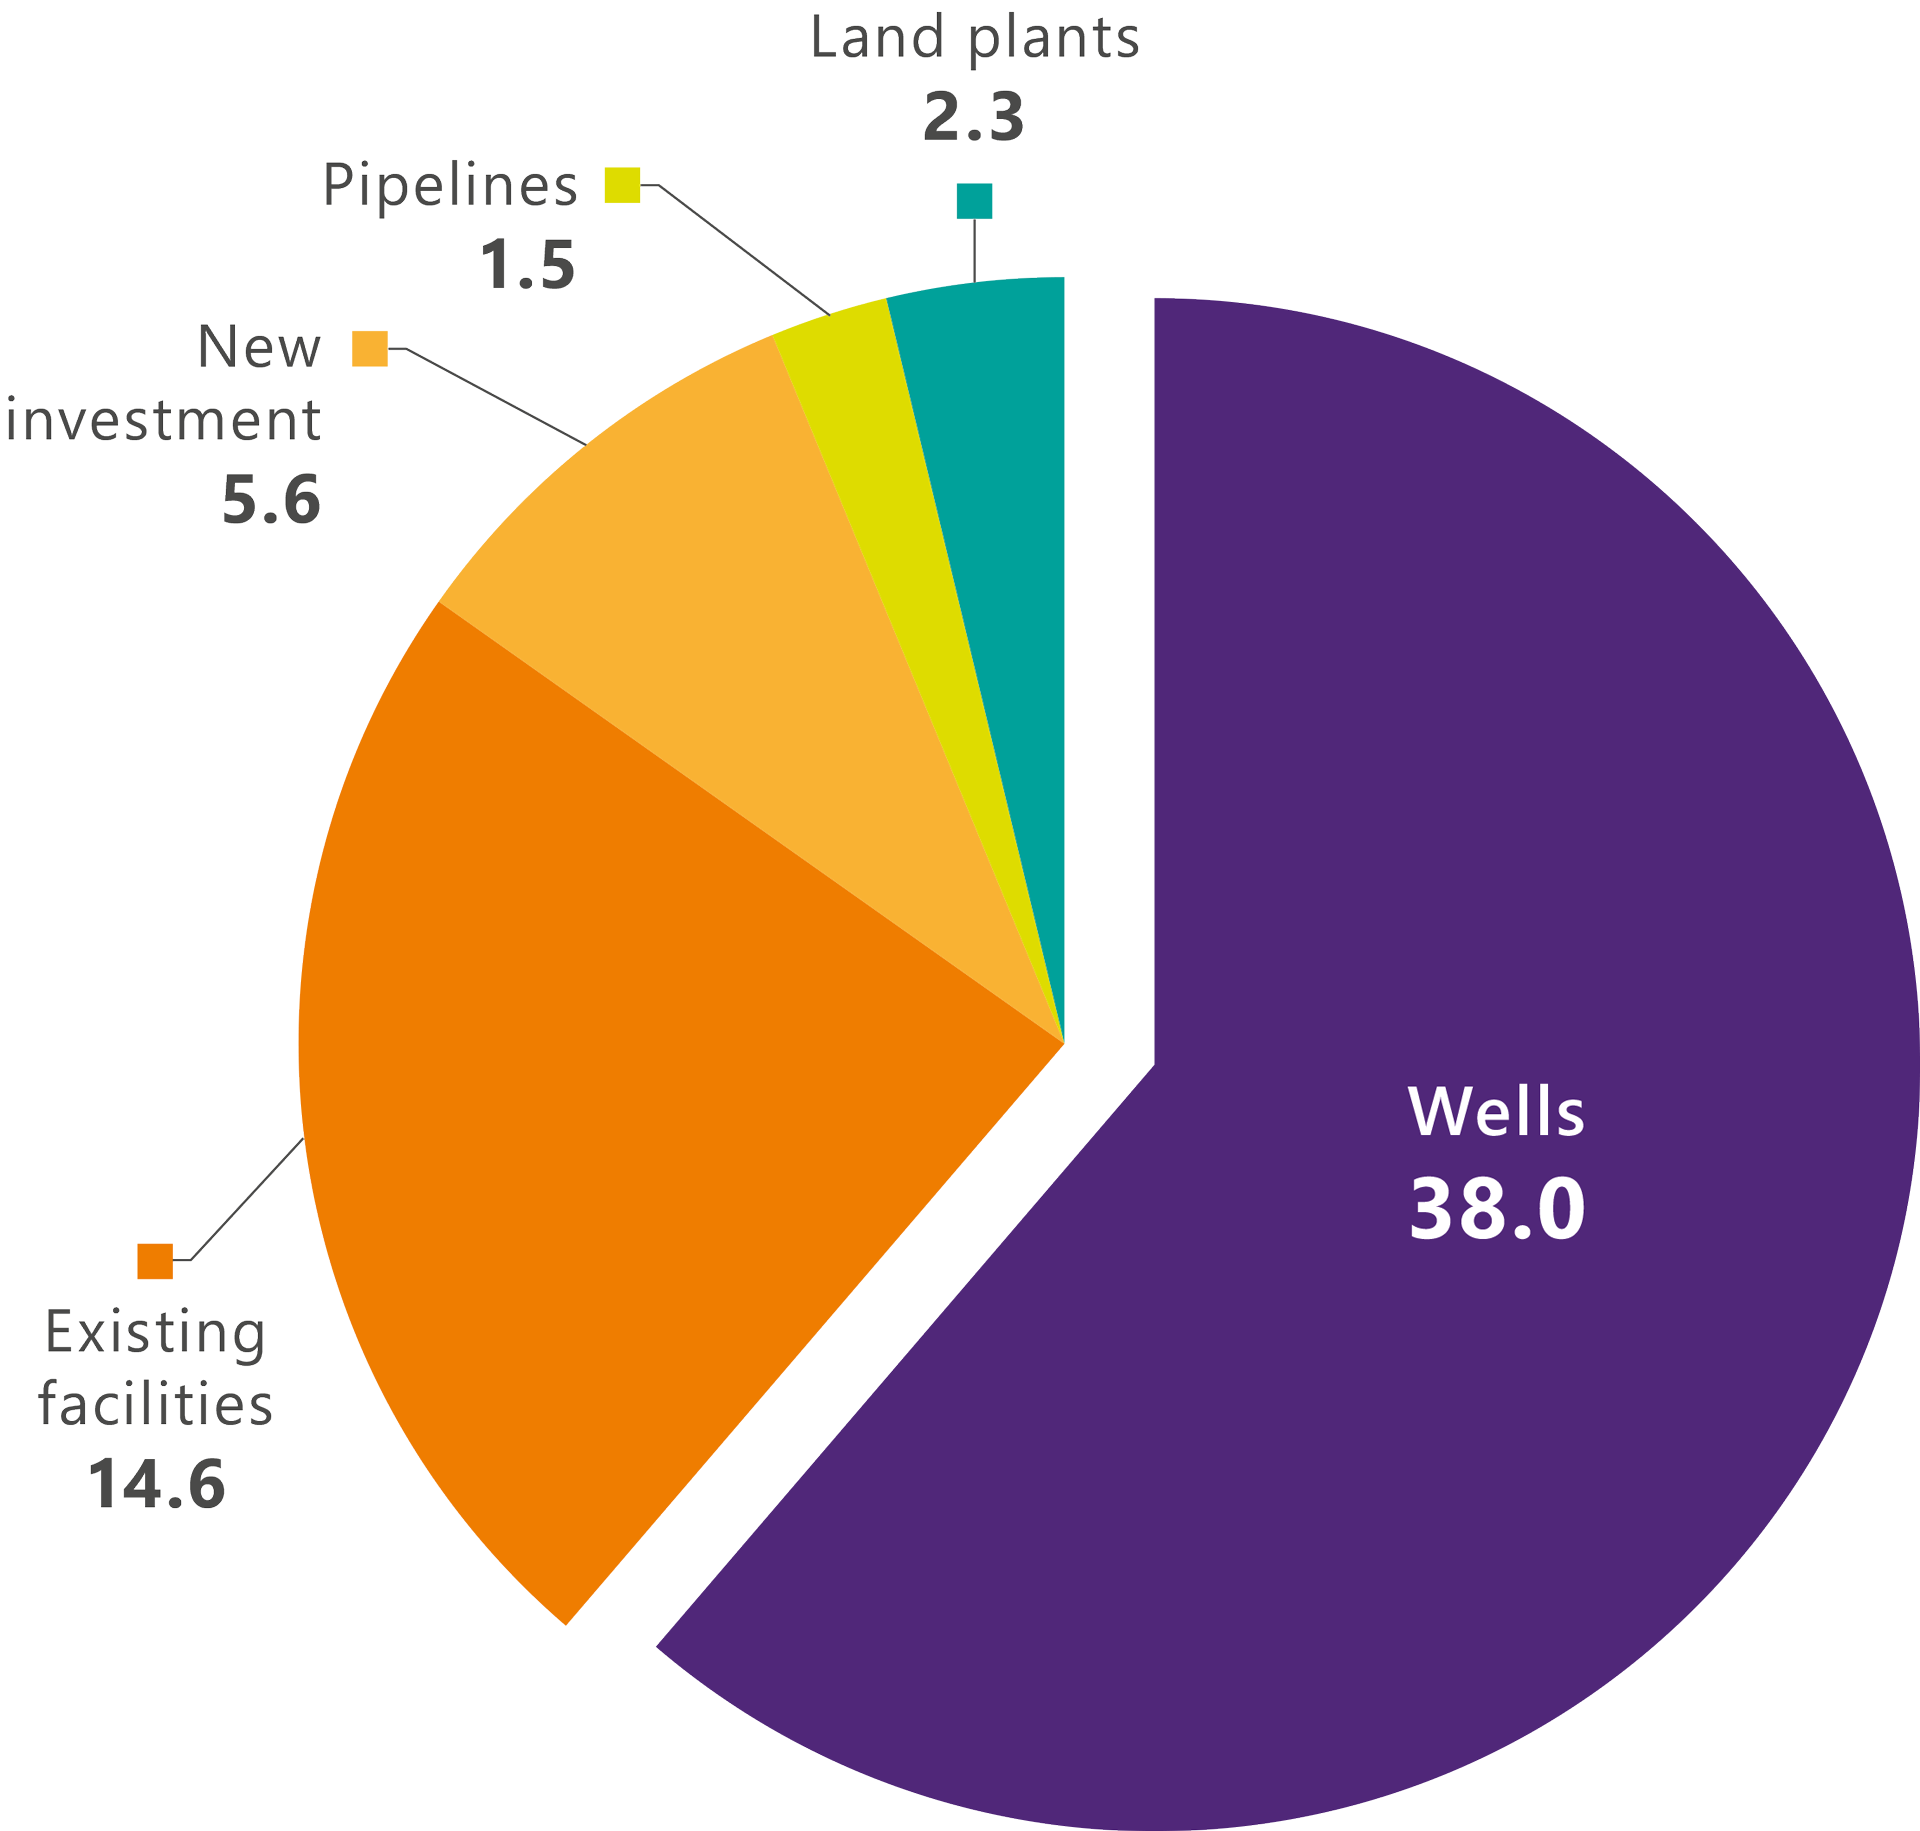
Figure 2.16 Investment in NOK billion at 2018 value for fields on stream by category.
In recent years, cost control and efficiency improvements have cut average costs per development well by more than 40 per cent. Technology advances, such as automated and more efficient drilling, could contribute to even further reductions.
Lower costs mean that more wells are drilled, and that well targets with a smaller estimated volume become profitable. Figure 2.17 presents the average cost per development well and the number of such wells since 2000. Figure 2.18 presents average well costs since 2000 by type of drilling facility.
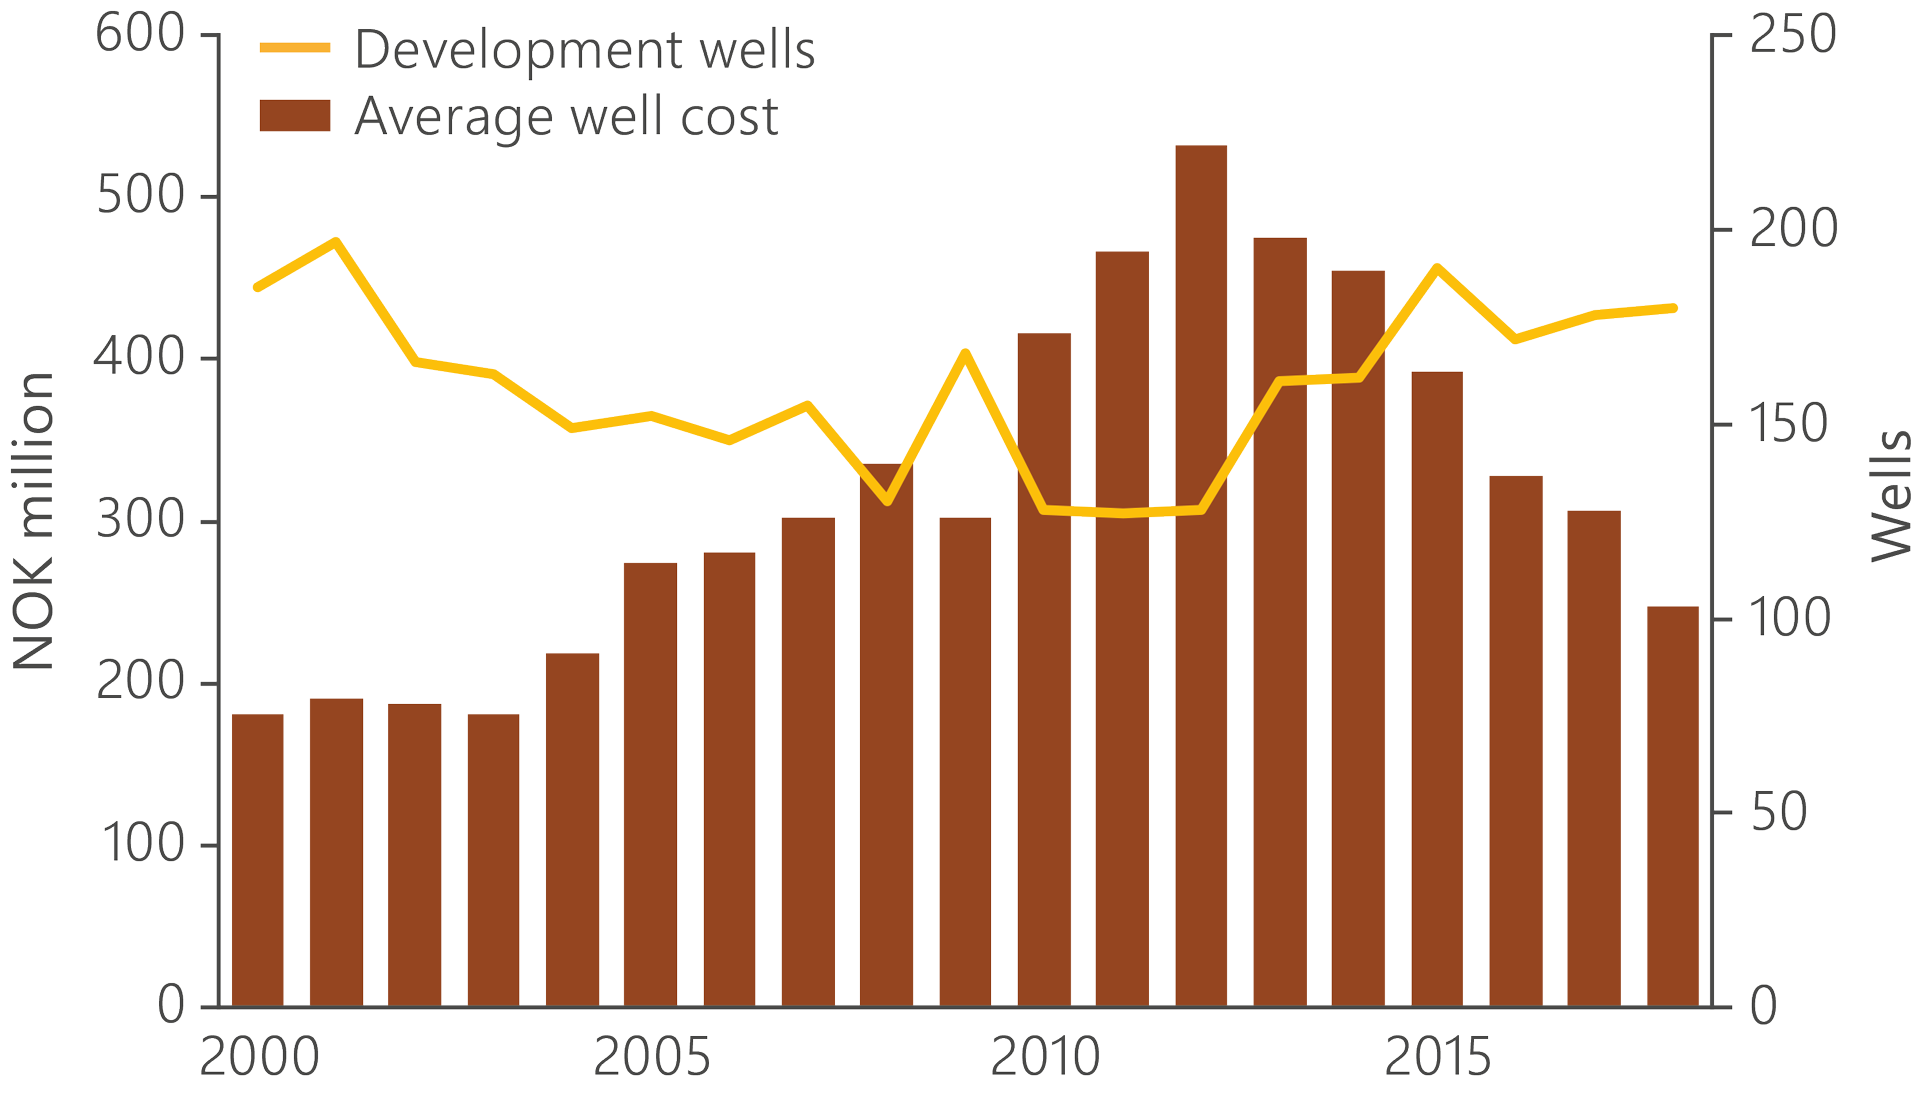
Figure 2.17 Average cost per development well and development wells per annum.
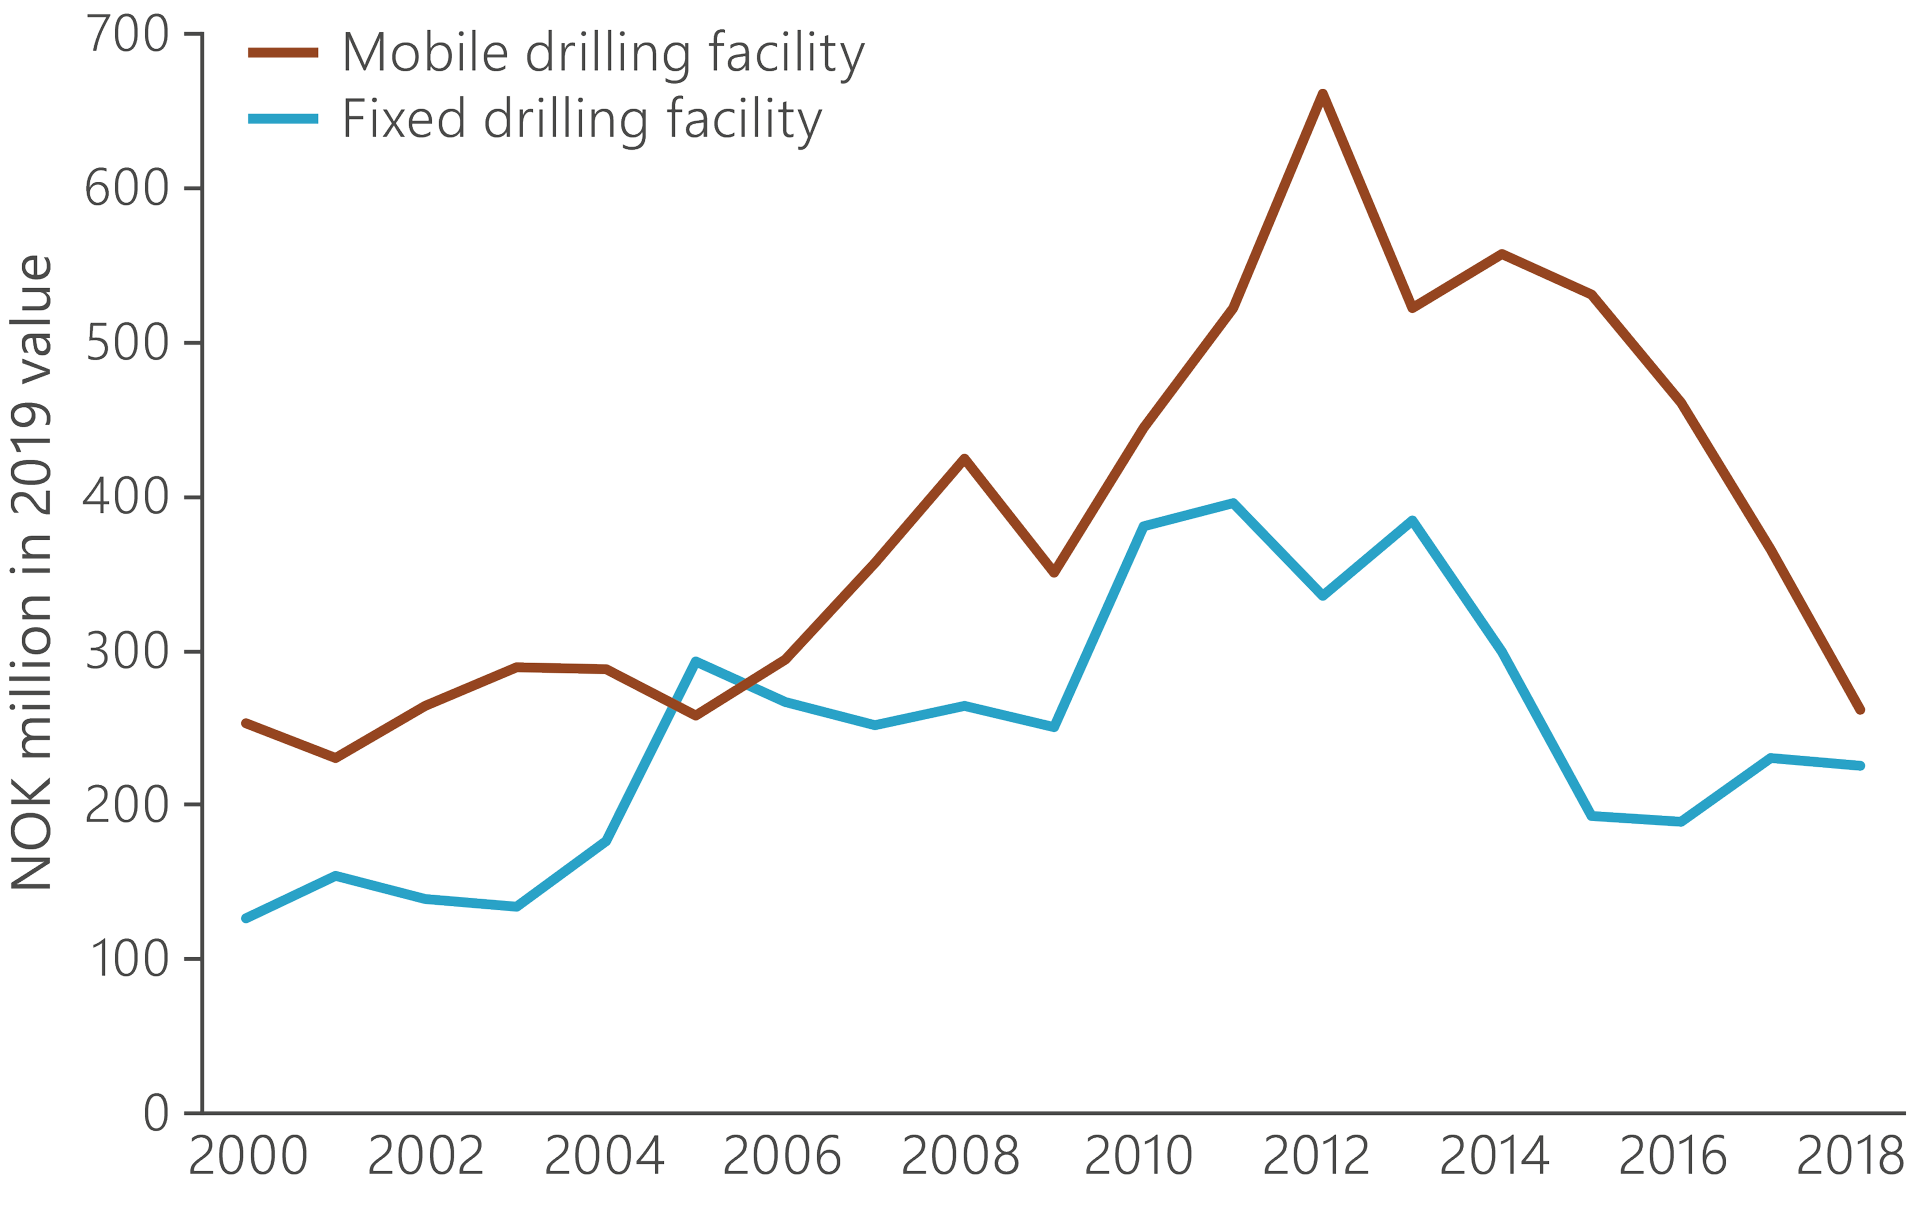
Figure 2.18 Average drilling costs for fixed and mobile facilities.
Drilling costs for mobile units have been substantially higher than on fixed facilities. That reflects a big rise in mobile rig rates before 2014 compared with prices in other supplier segments. Since 2014, rates for mobile facilities have fallen sharply. However, many long-term contracts awarded before 2014 have meant that the effect on drilling costs has only been felt gradually.
Acquiring data from subsea wells is normally more expensive than from platform ones. In recent years, the number of subsea wells drilled from mobile facilities has steadily risen. Developing and adopting solutions which allow data to be acquired more cheaply from such wells is therefore important. Examples include tracer technology and the use of fibreoptics (see the fact box on Johan Sverdrup), which can potentially replace expensive downhole interventions in securing important reservoir information.
Based on input from the IFE: Tracers in wells increase reservoir understanding
Zone control for improved recovery and lower costs
Costs down on the NCS
Extensive efforts devoted by the industry in recent years to cost control and efficiency improvements have substantially reduced the average operating cost per unit produced (unit cost) since 2013. Figure 2.21 presents the development of total operating and unit costs.
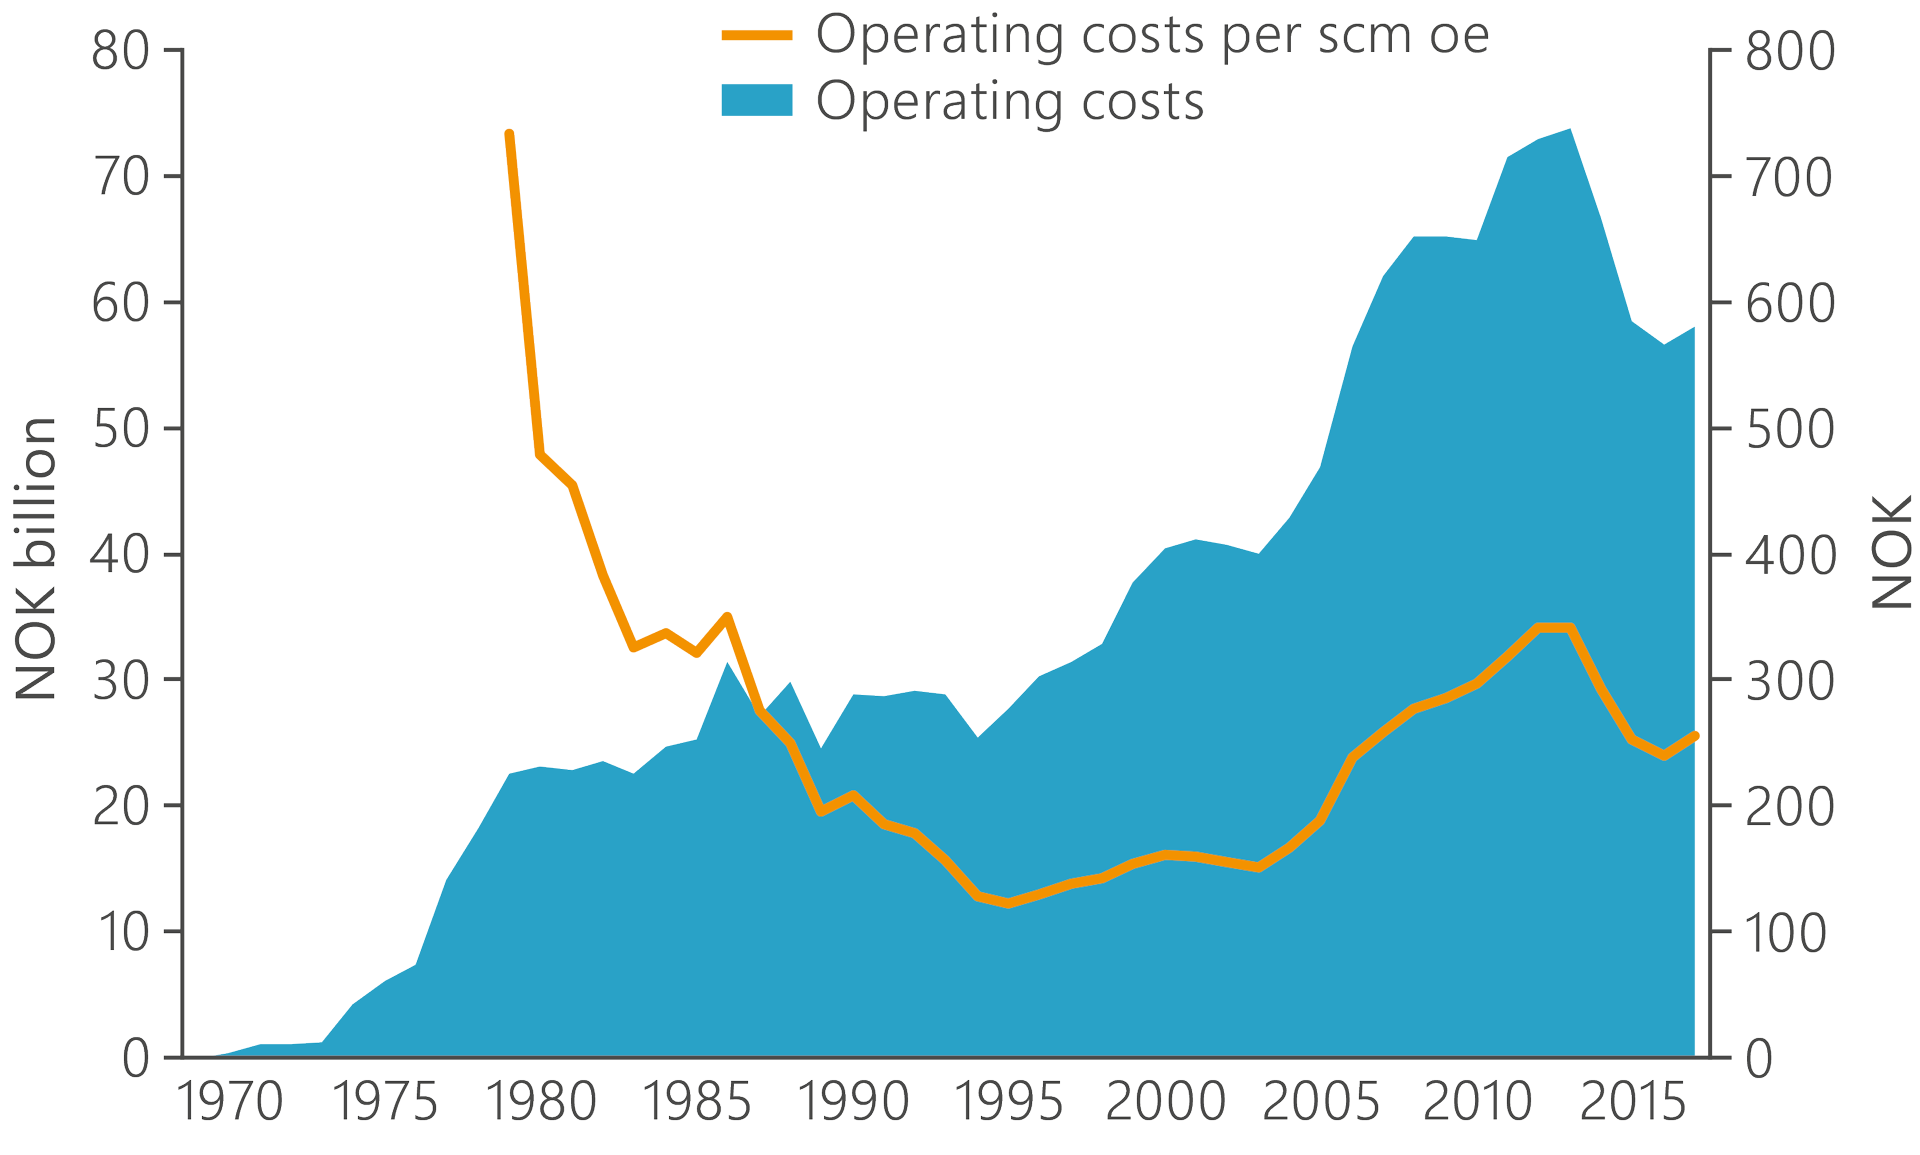
Figure 2.21 Development of operating and unit costs on the NCS from 1970 to 2018.
Viewed in isolation, reducing the latter means that oil and gas become more profitable to produce, and that more improved recovery measures become profitable and can be adopted. At the same time, the current unit cost is substantially higher than the low point reached in 1995.
This could suggest that cost growth to the end of the 2000s has still not been reversed. New solutions incorporating such aspects as automation and remote control, improved use of data and more efficient operation, can help to reduce unit cost even further.
Operating costs have been reduced on all the large fields since 2013. The few fields which have seen an increase are in all cases small. The percentage decline has been greatest on small fields. That could partly be because such fields basically have relatively low operating costs, and changes in activity therefore have a bigger impact.
Figure 2.22 presents the change in operating costs at field level from 2013 to 2017. The few fields located above the horizontal line in the figure experienced an increase during the period. However, the great majority of fields recorded a reduction averaging about 30 per cent.
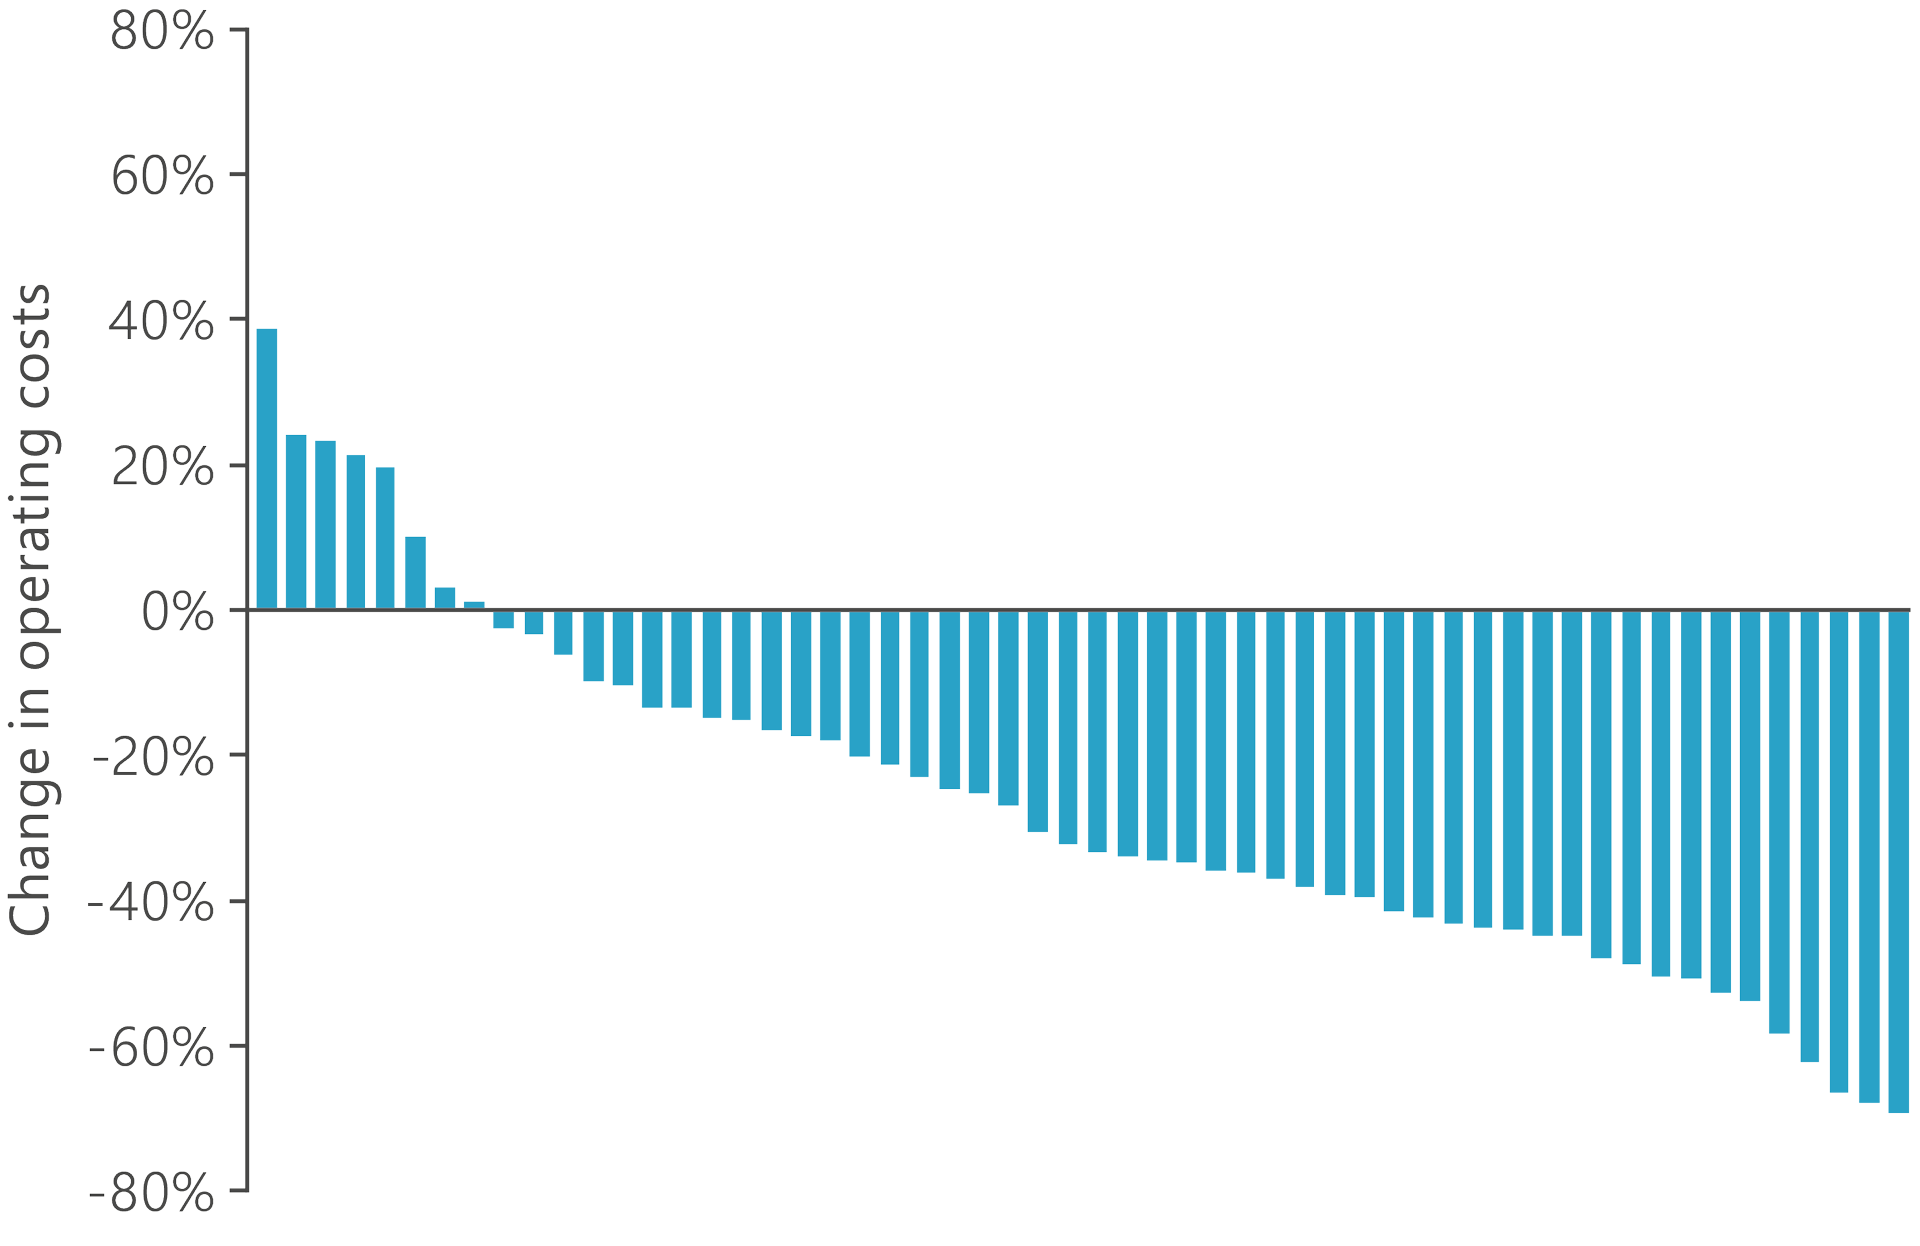
Figure 2.22 Change in operating costs for fields on stream from 2013 to 2017.
Reduced operating costs for a field are basically positive. This can improve margins, extend the field’s producing life, and contribute to higher value creation. At the same time, avoiding cost cuts with a short-term focus which are made at the expense of good resource management is important. Solutions must therefore be chosen which create the greatest possible value in a long-term perspective, and necessary maintenance has to be given priority.
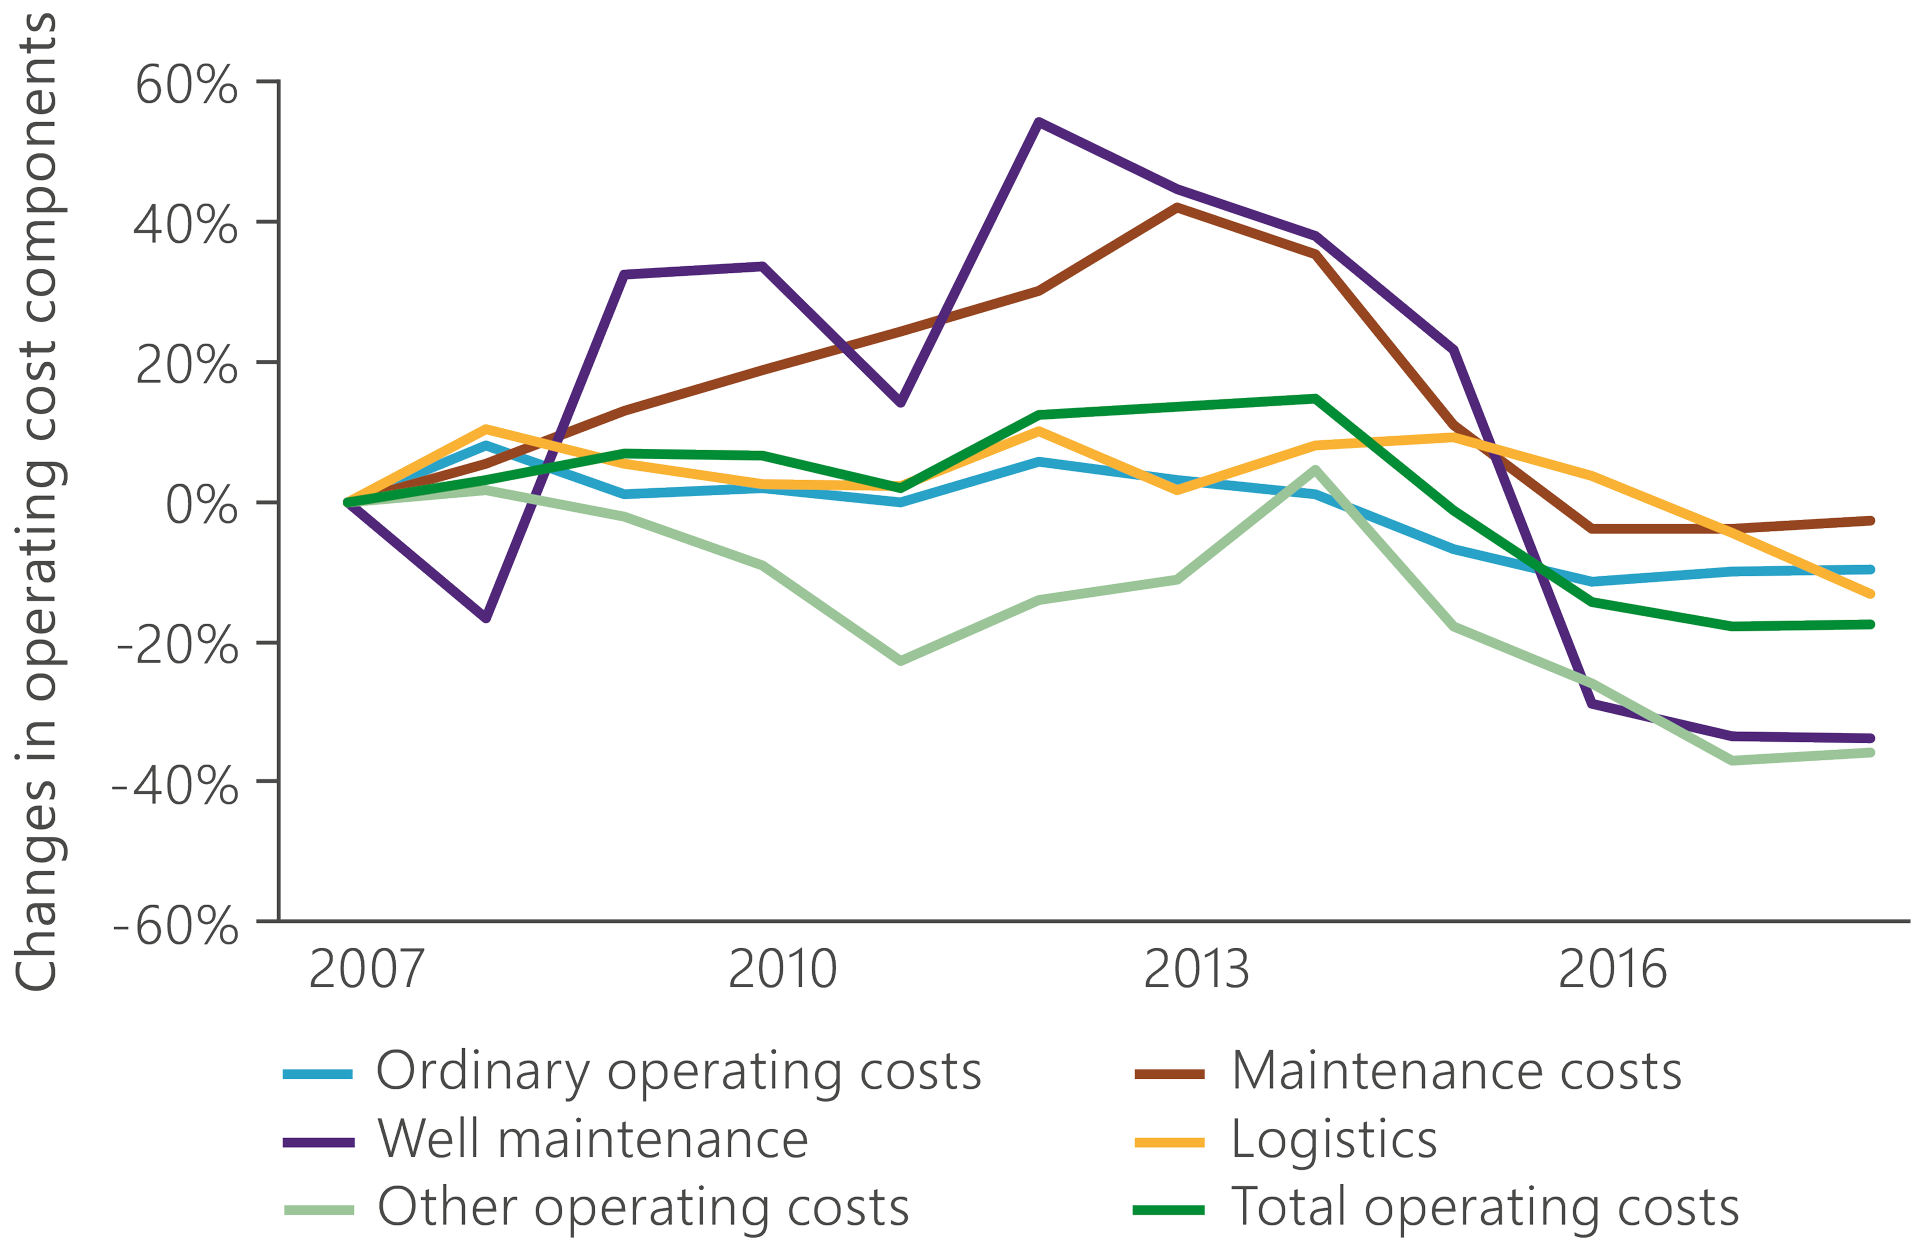
Figure 2.23 Relative development of components in overall operating costs.
Phasing in additional resources
Virtually all the fields on the NCS produce for considerably longer than envisaged in their PDO. Figure 2.24 presents extended production on a number of the fields compared with the PDO expectation. Lower costs, improved recovery measures, a larger resource base than expected and phasing in new discoveries lengthen their commercial life.
A good example is Varg, which ceased production in 2016 after extending its economic life from three to 18 years. Frøy is one of the few fields whose time on stream was shorter than expected. However, plans to reopen it are being pursued.

Figure 2.24 Commercial life for fields compared with their PDOs.
The effect of phasing in is illustrated in figure 2.25, which presents unit costs for a host field with and without a tie-in. Phasing in helps to reduce unit costs and extend producing life for the host field, and allows more of the resources to be recovered.

Figure 2.25 Effect on phasing in on operating costs per unit produced for a typical host field.
Among other factors, opportunities for phasing oil and gas into existing infrastructure are limited by capacity in the process plant on host facilities. Gas fields may also face capacity constraints in the transport systems.
As production from existing fields declines, however, spare capacity arises in several parts of the gas infrastructure. This can make searching for gas more attractive, and it is important that the industry exploits this opportunity and intensifies exploration – particularly around infrastructure already in place.
Utilising existing capacity is also important for oil fields, particularly because several of the big host producers are already in a mature phase. Exploration must be pursued around the mature fields, infrastructure owners must promote spare capacity, and the companies must collaborate to phase in additional resources. In this way, new resources can be developed and help to increase value creation.
Players
The NCS is dependent on competent players willing to invest in available opportunities. Both the willingness to invest and the ability to mature marginally profitable resources through such approaches as new cost-effective working methods are important for realising the value potential. That applies particularly when new discoveries will increasingly be developed as small subsea projects.
At 31 December 2018, 39 companies were active on the NCS. Twenty-five of these were operators, 13 of them for fields. Figure 2.27 illustrates the changes in the number of field operators and in company type since 2000. A substantial increase in operators has occurred over the past decade, and they include several medium-sized companies.
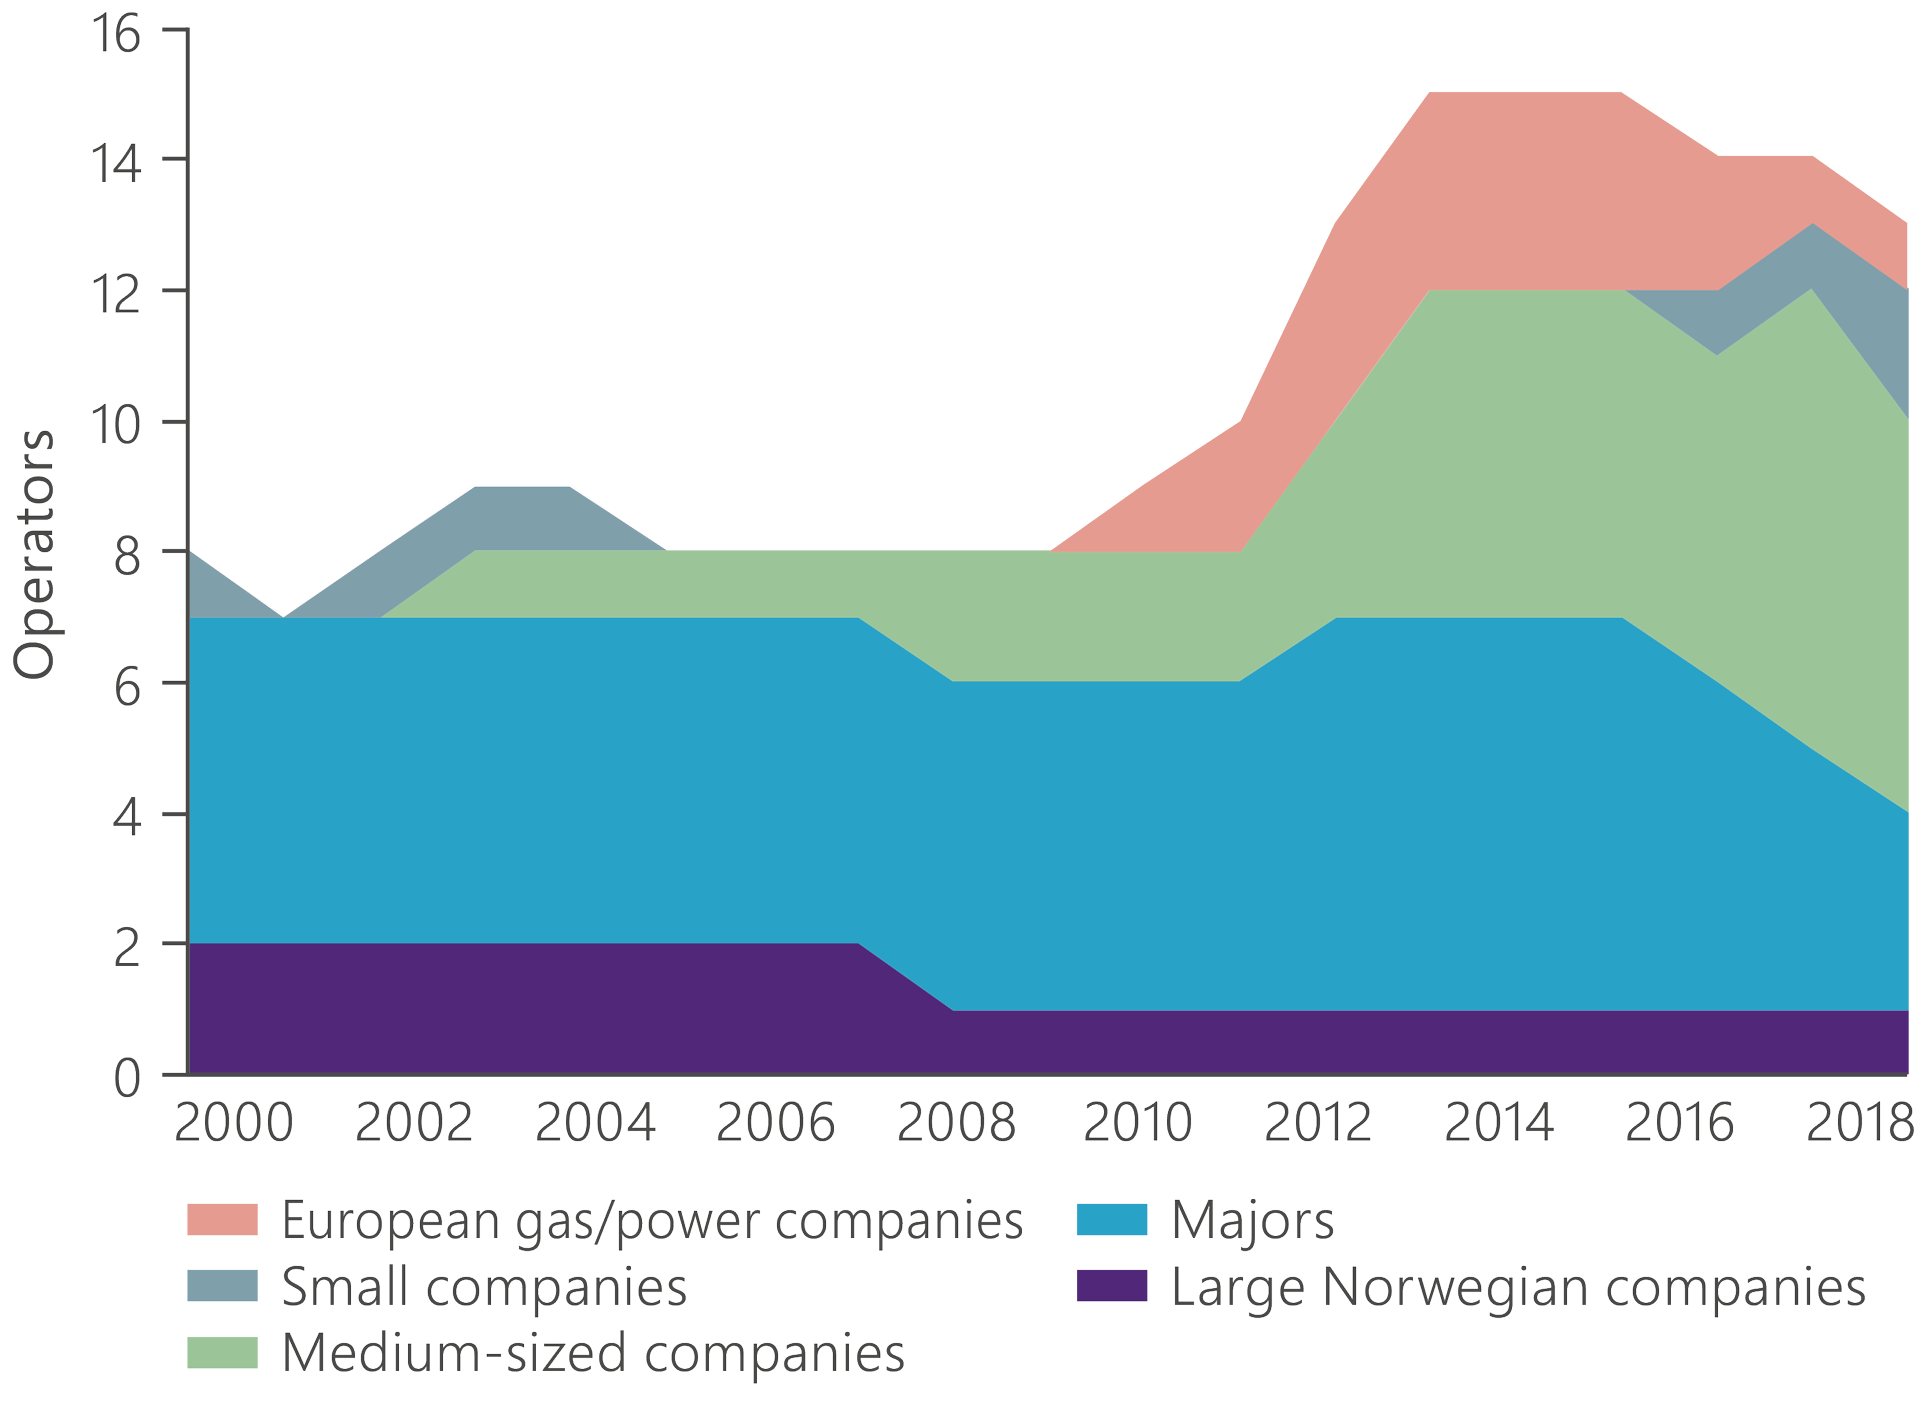
Figure 2.27 Operators for fields on stream since 2000.
Figure 2.28 presents total investment in 2000-18 by company category. Medium-sized companies have gradually accounted for a larger proportion of capital spending. The contribution from majors shows a corresponding reduction.
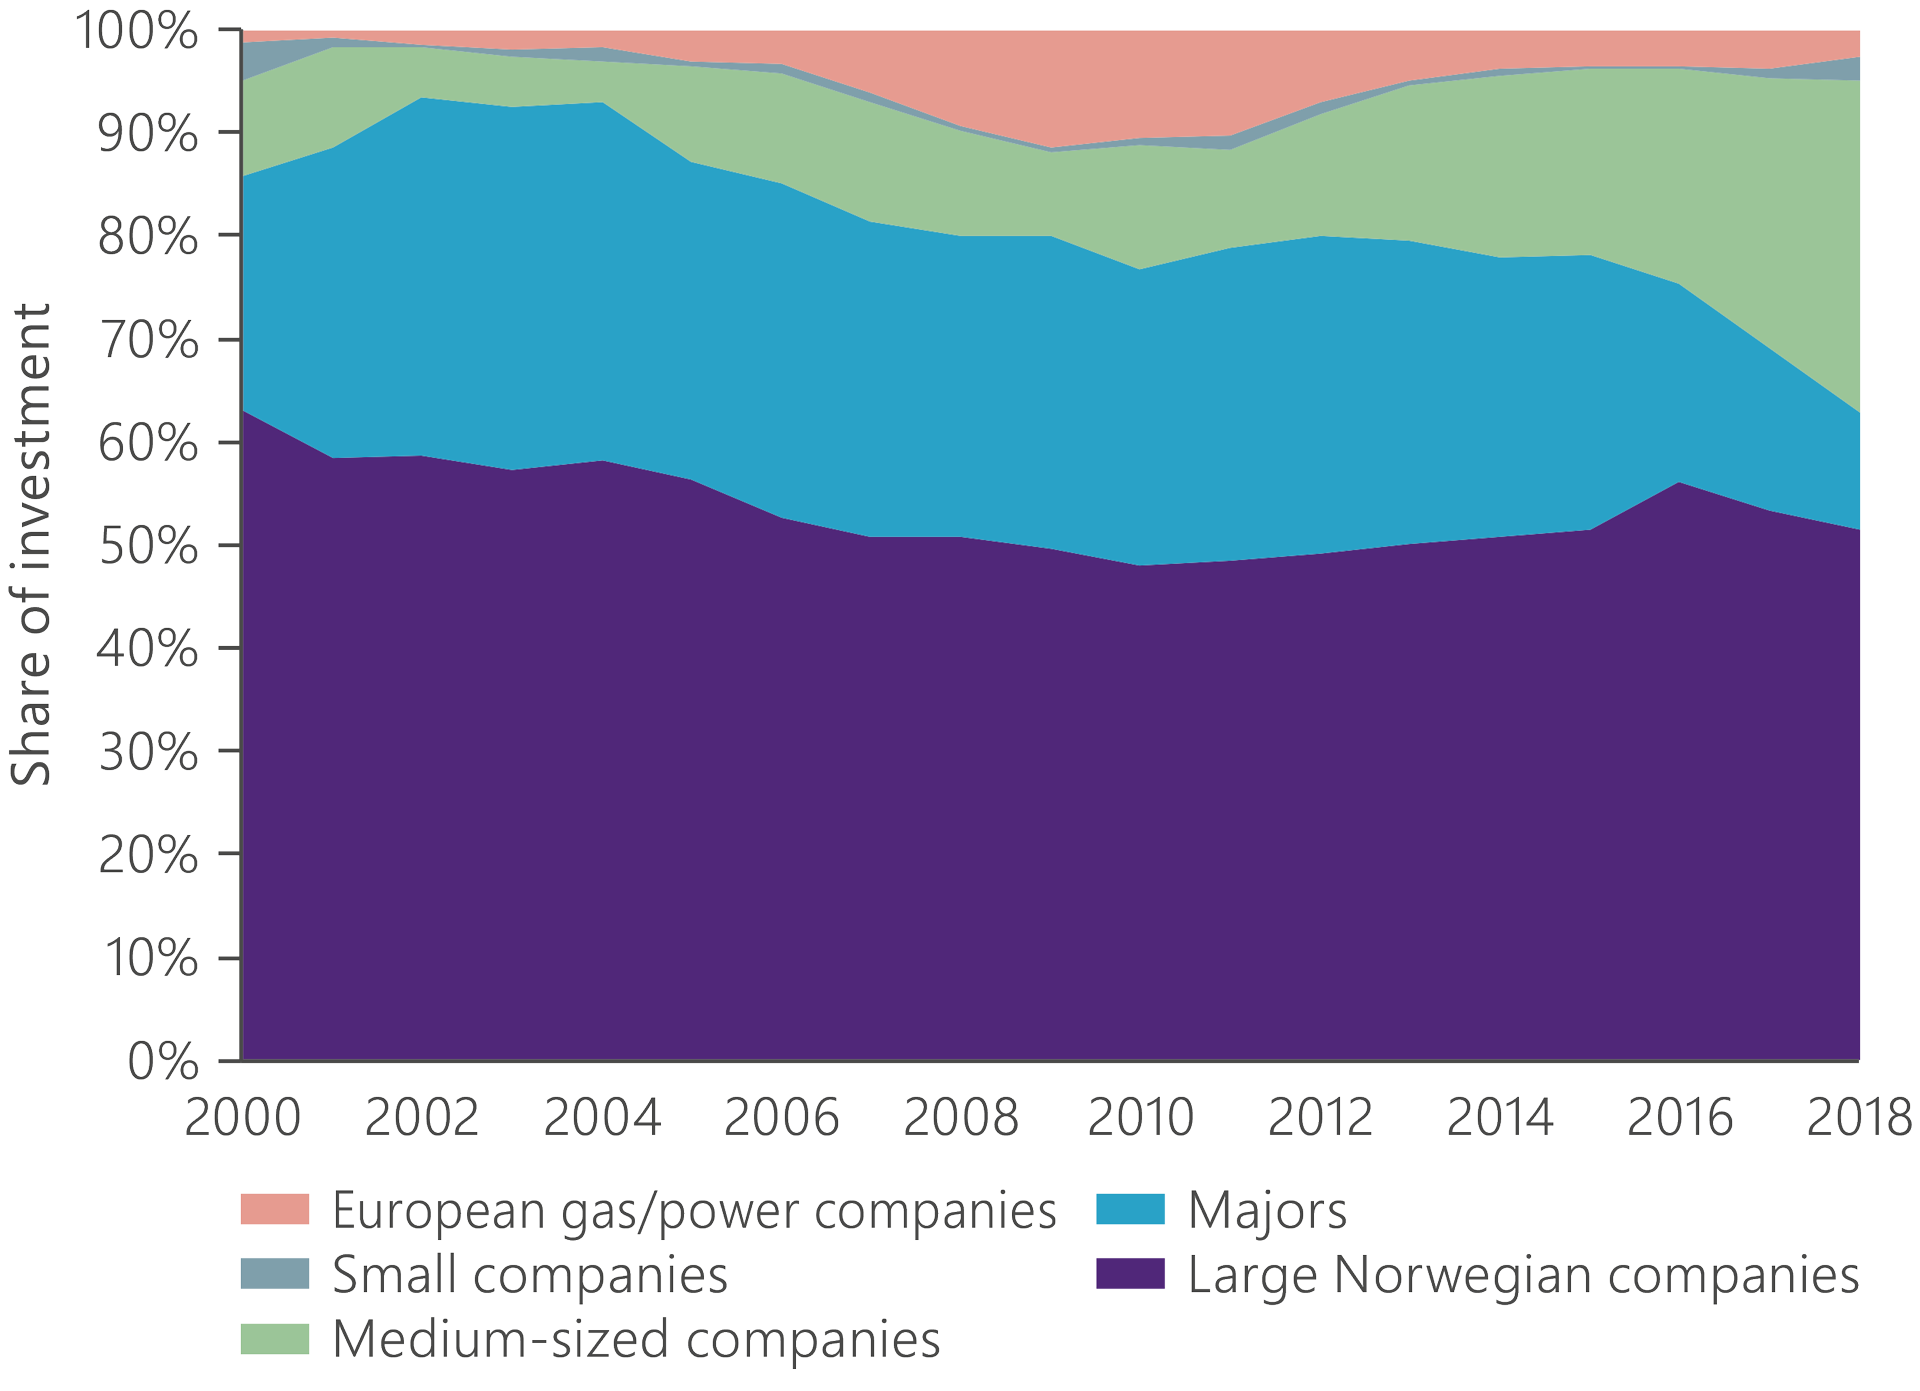
Figure 2.28 Share of investment on the NCS by company category.
The NCS often represents a larger proportion of the portfolio for medium-sized companies than it does for the majors. That could make the former more willing to invest because developments in Norway do not have to compete with a large international project portfolio.
Better use of data creates value
KonKraft10 published "Competitiveness – changing tide on the Norwegian continental shelf" in February 2018. This report was a contribution to KonKraft’s work of maintaining the competitiveness of the NCS. Increased coordination, new forms of collaboration and realising the potential offered by digital technology were general themes.
Norway is a pioneer in managing and sharing data. The government facilitates simple access to information through such means as dedicated websites – the FactPages at npd.no as well as norskpetroleum.no. In addition, the forum for reservoir characterisation and reservoir engineering (Force) provides an example of an approach to working where the main objective is to increase collaboration between government, industry and research teams. The forum works to share data and knowledge through various networks and project groups.
Diskos is another example. This national petroleum database rests on a collaboration agreement between the government and the oil companies. Non-oil companies can be associate members, and a number of universities and research institutions are also involved. Diskos is structured to receive such input as sub-surface data reported to the authorities for sharing and exchange between production licences, and to give access to all non-confidential information.
Seismic and well data are easily accessible through the service, and much of the information has been made public. The government and the oil companies are currently working on further development of Diskos with the aim of adopting new technology for data storage and utilisation.
As the NCS matures, finding oil and gas deposits becomes more challenging, discoveries are smaller, and resources are more difficult to produce. Cross-industry coordination, with sharing of information and better use of large data volumes, is thereby becoming ever more important. Advances in acquiring, transferring and storing data, and in faster and cheaper calculations, open many new opportunities. Analysing large data volumes can provide new information through innovative ways of collating material or re-evaluating it.
At the same time, coordination and collaboration can lead to new ideas, re-use and experience transfer. Another benefit could be a reduced risk of duplicating work. Collaboration and data sharing will also enhance knowledge, improve planning and lead to decisions being taken on a better basis.
Data sharing is crucial for methods which demand large volumes of information. Two examples are the use of artificial intelligence for production optimisation, and automated experience transfer to well planning in order to improve efficiency and cut costs. For such methods to be effective, access is required to large quantities of data.
Being able to handle large data volumes also makes it possible to develop better reservoir modelling tools. That enhances sub-surface understanding, and is expected to contribute to a substantial increase in value creation.
Based on input from Aker BP and Cognite: New methods for utilising data
Based on input from Equinor: More intelligent data use boost value creation on Johan Sverdrup