Fact box 3.4 Analysing dry exploration wells
Dry well analyses can help to improve company risk estimates by increasing their understanding of the failure to find hydrocarbons.
Many companies base these analyses on their own information, but most – with some exceptions – have relatively limited base data. The NPD regularly carries out such analyses utilising data reported to it by the operators for all exploration wells on the NCS.
Base data
Pursuant to section 30 of the Resource Management Regulations on final reporting of geotechnical and reservoir well data, the operators are required to report prognoses for and results of wildcats in a final report submitted no later than six months after drilling has been completed.
The NPD conducted a dry well analysis in 2017 covering wells drilled in 2007-16, with the results published in its 2018 resource report on exploration. This analysis was updated in 2019 and now also includes well results for 2016-19 in addition to the probability of success for all prospects drilled. Its results were presented at the Force conference on petroleum charge and migration in 2019 [8].
More than 300 exploration targets are included in the analysis. These break down between 165 in the North Sea, 70 in the Norwegian Sea and 80 in the Barents Sea. A far larger number of data points than in the other regions make results for the North Sea more conclusive. A single well can test the prospectivity of more than one stratigraphic level. Jurassic rocks could be the primary exploration target, for example, with Triassic sediments as a secondary one.
In its analysis, the NPD has divided the geological risk factors into three main groups – reservoir, source and trap. All must be present for a petroleum deposit to exist. Reservoir covers both presence and quality, source includes presence as well as maturation and migration, while trap embraces closure as well as top and lateral sealing (figure 3.12). The analysis defines the factor with the lowest probability as the main pre-drilling risk. In those cases where two factors both have the lowest probability, they are weighted equally in the analysis.
Results
In the North Sea, the reasons for dry exploration targets are found to be first and foremost the absence of source (47 per cent), followed by the lack of trap (29 per cent) or reservoir (24 per cent) (figure 3.13). These causes correspond partly with drilling forecasts. The results show that the proportion of dry targets which relate to source is higher than expected.
At the same time, trap is found to function more often than predicted. The large proportion of dry targets related to source is rather surprising in such a well-explored part of the NCS as the North Sea, with its world-class Kimmeridge Clay source rock. This is known on the Norwegian side as the Draupne Formation in the northern North Sea sector and the Mandal Formation in the Central Graben. Lack of migration has been cited as a possible explanation for many of the dry targets in operator reporting to the NPD.
The same trend is found in the Norwegian Sea. Source functions less often than predicted and trap more often (figure 3.14). As the figure shows, source was the main risk in 22 per cent of targets while the results indicate that source is found to fail in more than 40 per cent.
Trap is a clear pre-drilling risk in the Barents Sea (figure 3.15), and its absence is specified as the main risk for 64 per cent of targets. That is probably attributable to the uplift and erosion history of the area, which creates a high risk with regard to petroleum retention. However, post-drilling results show that the proportion of dry targets almost as frequently reflects the absence of reservoir and source.
The analyses indicate that source is underestimated as a pre-drilling risk in all three regions. Better understanding of source and migration, including in well-explored parts of the NCS, could contribute to increased exploration success.
Figure 3.12 Conditions for making a discovery
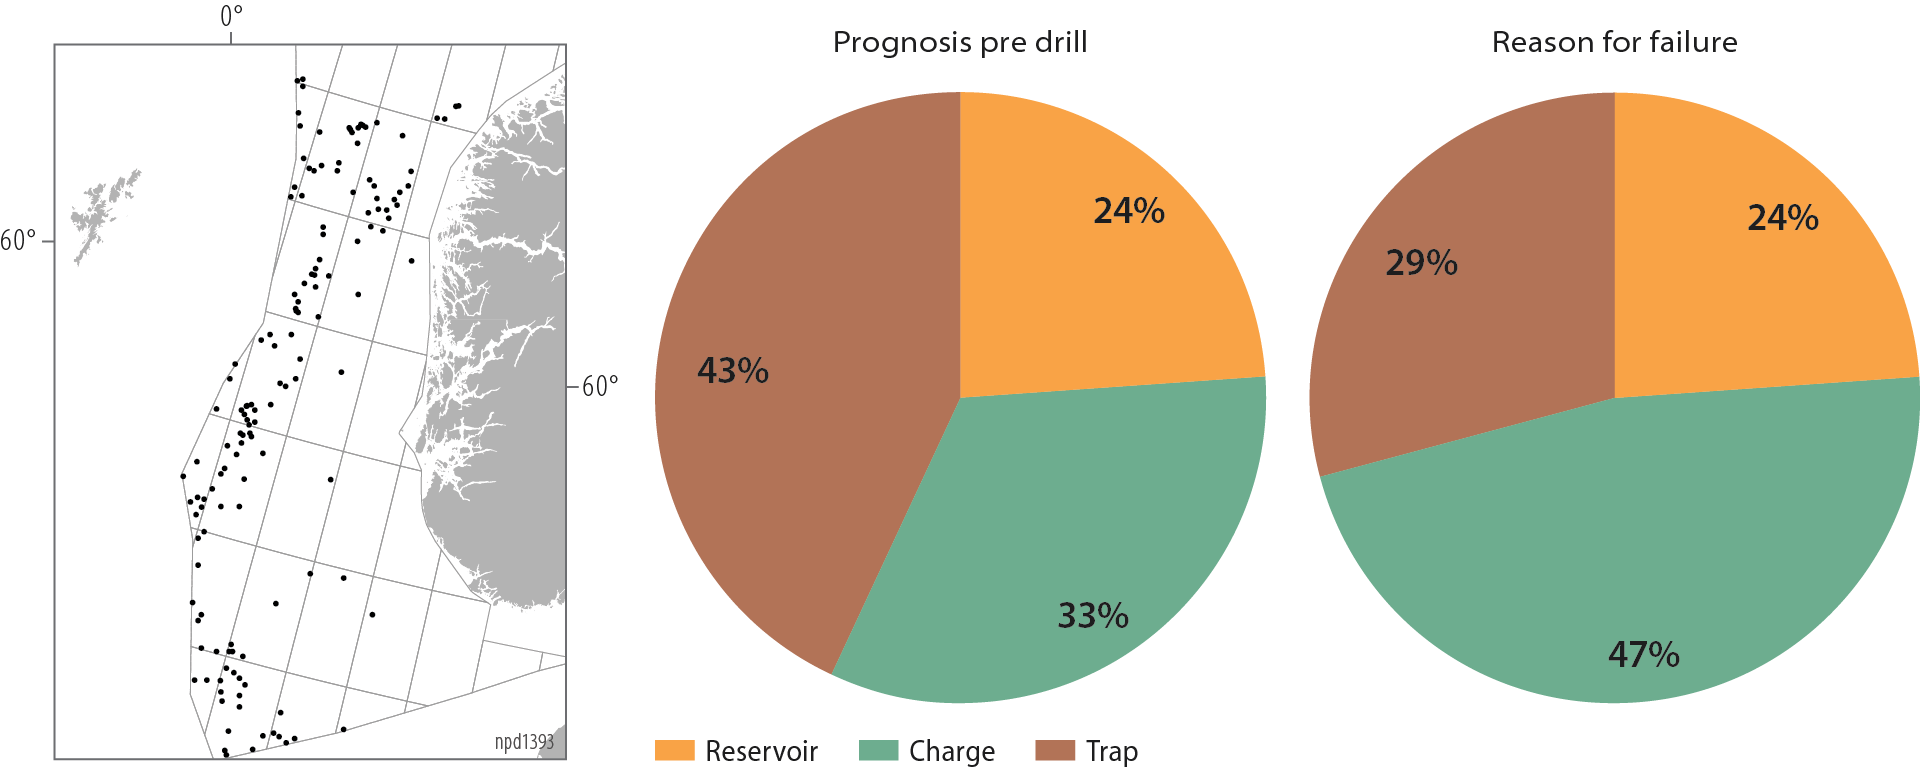
Figure 3.13 Dry exploration targets in the North Sea, 2007-19

Figure 3.14 Dry exploration targets in the Norwegian Sea, 2007-19

Figure 3.15 Dry exploration targets in the Barents Sea, 2007-19