2 – Discovered resources
Shortcut:
2.1. Fields
The Norwegian Offshore Directorate's resource classification system (PDF) defines petroleum resources as reserves once the operator has submitted a plan for development and operation (PDO) or decided to implement a measure to optimise recovery that does not require a PDO.
In 2023, the authorities approved 19 plans for development and operation (PDOs), and six PDO exemptions. This was the highest number of PDO approvals ever granted. 2023 saw the operators submit a PDO for 15/5-2 Eirin and applied for two PDO exemptions.
Discoveries are classified as fields once the authorities have approved a PDO. 92 fields were in production at year-end.
The fields that have produced the most oil and gas in 2023 are shown in the figures below:
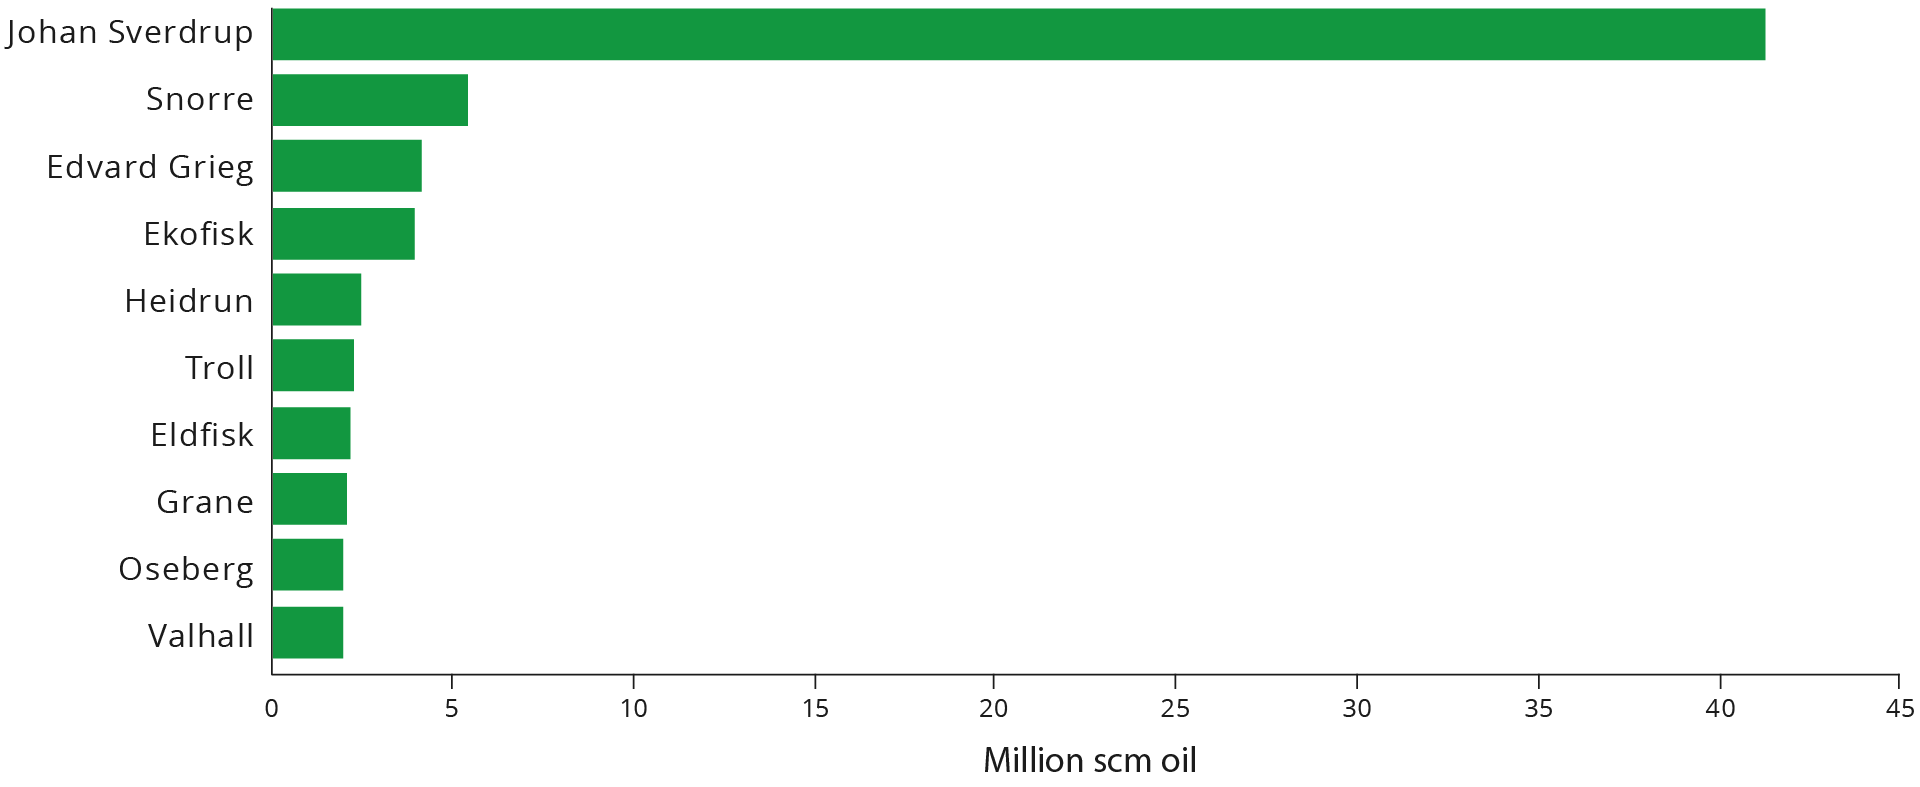
Figure 2-1 The ten largest fields in 2023 measured by oil production.
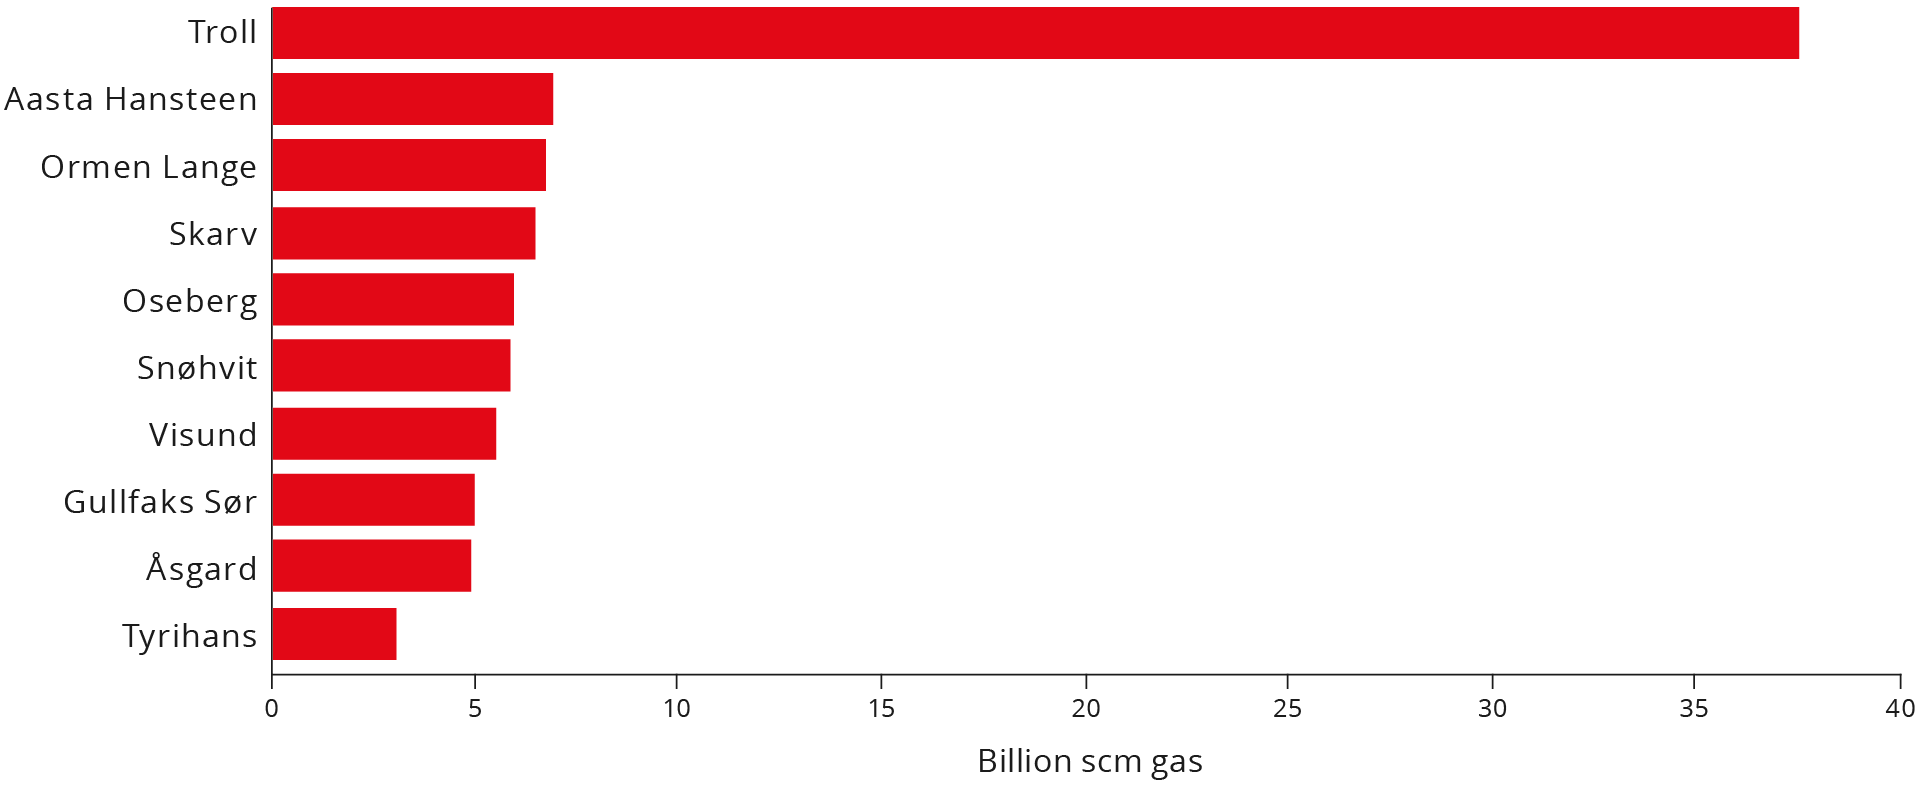
Figure 2-2 The ten largest fields in 2023 measured by gas production.
2.1.1. Reserves
As shown in Table 1.1, remaining reserves total 950 million Sm³ of oil and 1,366 billion Sm³ of gas. The increase in overall remaining reserves from 2022 is 24 million Sm3 of o.e. Estimates of reserves and historical production for each field can be found in the Resource Accounts as per 31 December 2023 (Excel)
The Troll and Johan Sverdrup fields have the largest remaining reserves on the Norwegian shelf, with 605 billion Sm3 of gas and 226 million Sm3 of oil, respectively. For information on additional fields, please see the link above.
This year's Resource Accounts reflect modest growth in gross reserves, which means reserves before deducting total production. Gross reserve growth for oil is 6 million Sm3 and 17 billion Sm³ for gas.
In 2014, the Norwegian Offshore Directorate established a goal for oil reserve growth of 1,200 million Sm³ for the 2014-2023 period. This was done in an effort to ensure necessary attention devoted to reserve growth, and to simultaneously follow up the development in a systematic manner.
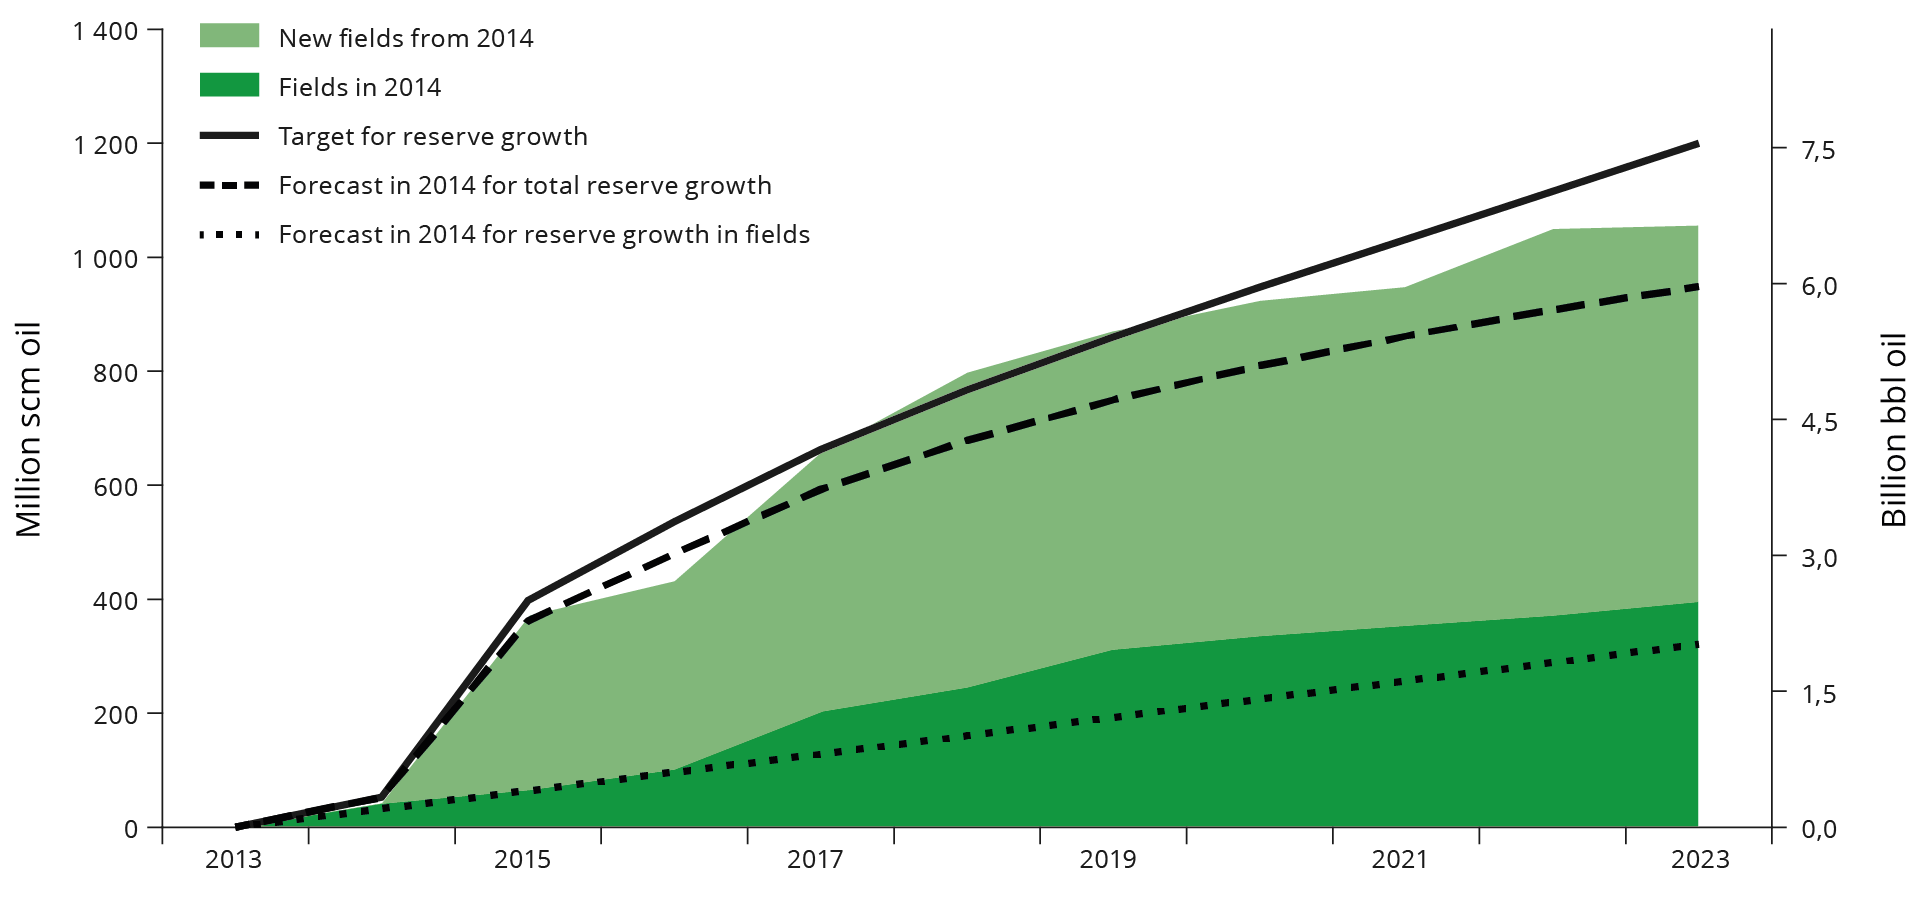
Figure 2-3 Growth in oil reserves from 2014 to 2023 compared with the Norwegian Offshore Directorate’s forecast and goal from 2014. The growth is distributed between reserves from fields and from new fields approved after 2014.
Gross reserve growth for oil in 2023 came to 6 million Sm³, which is the lowest annual reserve growth during the measurement period. Fields that were approved as fields prior to 2014 saw an overall increase in reserves, while fields approved after 2014 saw a decline. Last year's changes were mainly due to updated models based on new operational assumptions, experience and production history. A low number of PDOs and PDO exemption applications were submitted in 2023. This also explains the modest increase in reserves compared with the previous Resource Accounts.
2023 is the last year of following up the goal. Figure 2-3 shows that reserves have increased throughout the period, but that the established goal was not reached. The fields approved for development or in production on the Norwegian shelf in 2014 have seen good reserve growth, and the reserve growth surpassed the 2014 forecast for the entire period as early as in 2020.
The largest contribution to growth in oil reserves came from new field developments decided during the ten-year period, such as the PDO approval for Johan Sverdrup in early 2014. The majority of this was included in the forecast. The status at year-end shows that discoveries made before the goal was established have also yielded an increase beyond the forecast from 2014.
Overall, the reserve growth, after ten years, amounts to approx. 1,050 million Sm³. This means that current reserves are more than 100 million Sm³ higher than ten years ago since the oil production during same period was about 935 million Sm³. More detailed analysis and discussion of the reserve growth over the last ten years will be published in the Norwegian Offshore Directorate's resource report later this year.
The changes in gross reserves during the 2013-2023 period, including produced volumes, are shown in the figure below. The production is replaced by reserve growth in the years where the columns exceed production, shown with the dotted lines. The last ten-year period has seen an increase in liquids reserves, while there has been a reduction for gas; see Figure 2-4.
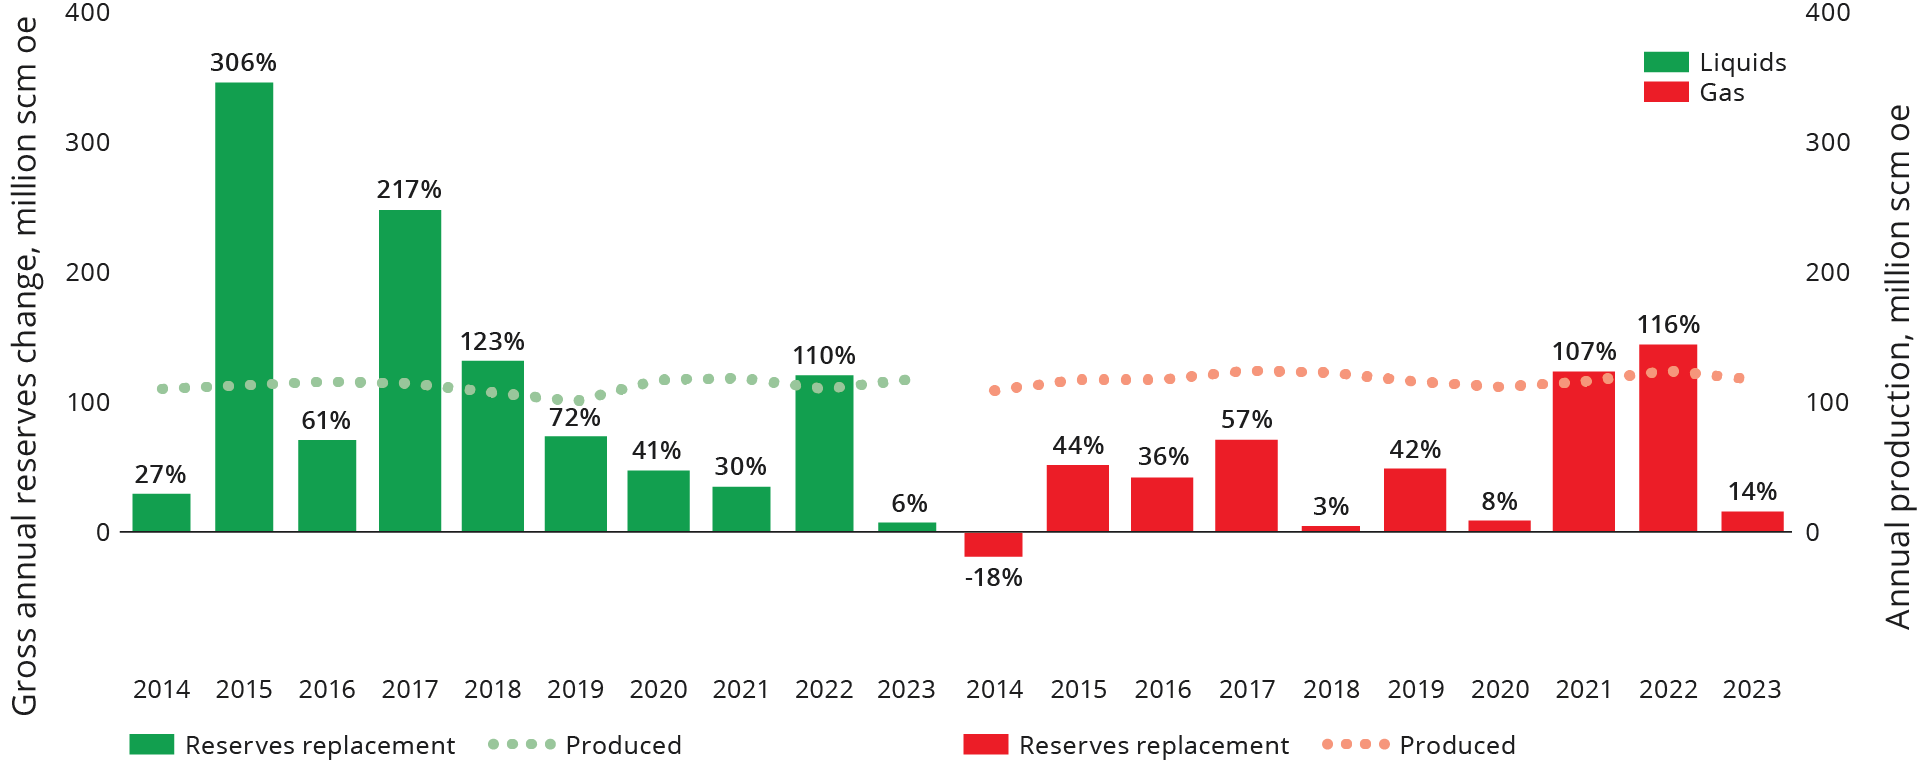
Figure 2-4 Reserve replacement and production development for liquids and gas over the last ten-year period. The percentage shows annual reserve replacement.
2023 saw a relatively low level of reserve replacement for liquids and gas; 6 and 14 per cent, respectively. Compared with 2022, which ended with more than 100 per cent reserve replacement for both liquids and gas, the primary explanation is that 21 PDOs were submitted in 2022, while only one PDO was submitted in 2023 for one discovery, 15/5-2 Eirin.
1,125 million Sm³ of liquids has been produced over the last ten years, and the Resource Accounts show that the remaining reserves are 14 million Sm³ lower than in 2013. This means that the reserve replacement for liquids has been lower than 100 per cent over the last 10 years. Six per cent of produced liquids reserves were replaced in 2023.
1,172 billion Sm³ of gas has been produced since 2013, and the Accounts show that the remaining reserves are 682 billion Sm³ lower than in 2013. This yields a reserve replacement for gas of just under 50 per cent over the last 10 years, and 14 per cent of the produced gas reserves were replaced in 2023.
2.1.2 Contingent resources in fields
The expected value for contingent (no decision to develop) liquids resources in fields is 356 million Sm³; see Table 1-1. This is an increase of 16 million Sm³ from 2022. For gas, the expectation is 291 billion Sm³, and this is an increase of 31 billion Sm³ from the previous year. The increase was caused by several future projects under consideration by the licensees.
The Resource Accounts for 2023 include 171 concrete, but not yet adopted, projects for improved petroleum production and extended lifetime. It is important to implement new technology in order to facilitate and firm up new projects for the fields.
Projects to improve recovery are dominated by new wells, both in the number of projects (75) and volume (about 120 million Sm³ of o.e.). Other projects that could provide substantial contributions are further developments, low pressure and late-phase production. Fewer measures have been identified which utilise new injection or advanced methods.
Figure 2-5 shows a summary of these projects distributed by project type with associated resources distributed between liquids and gas.
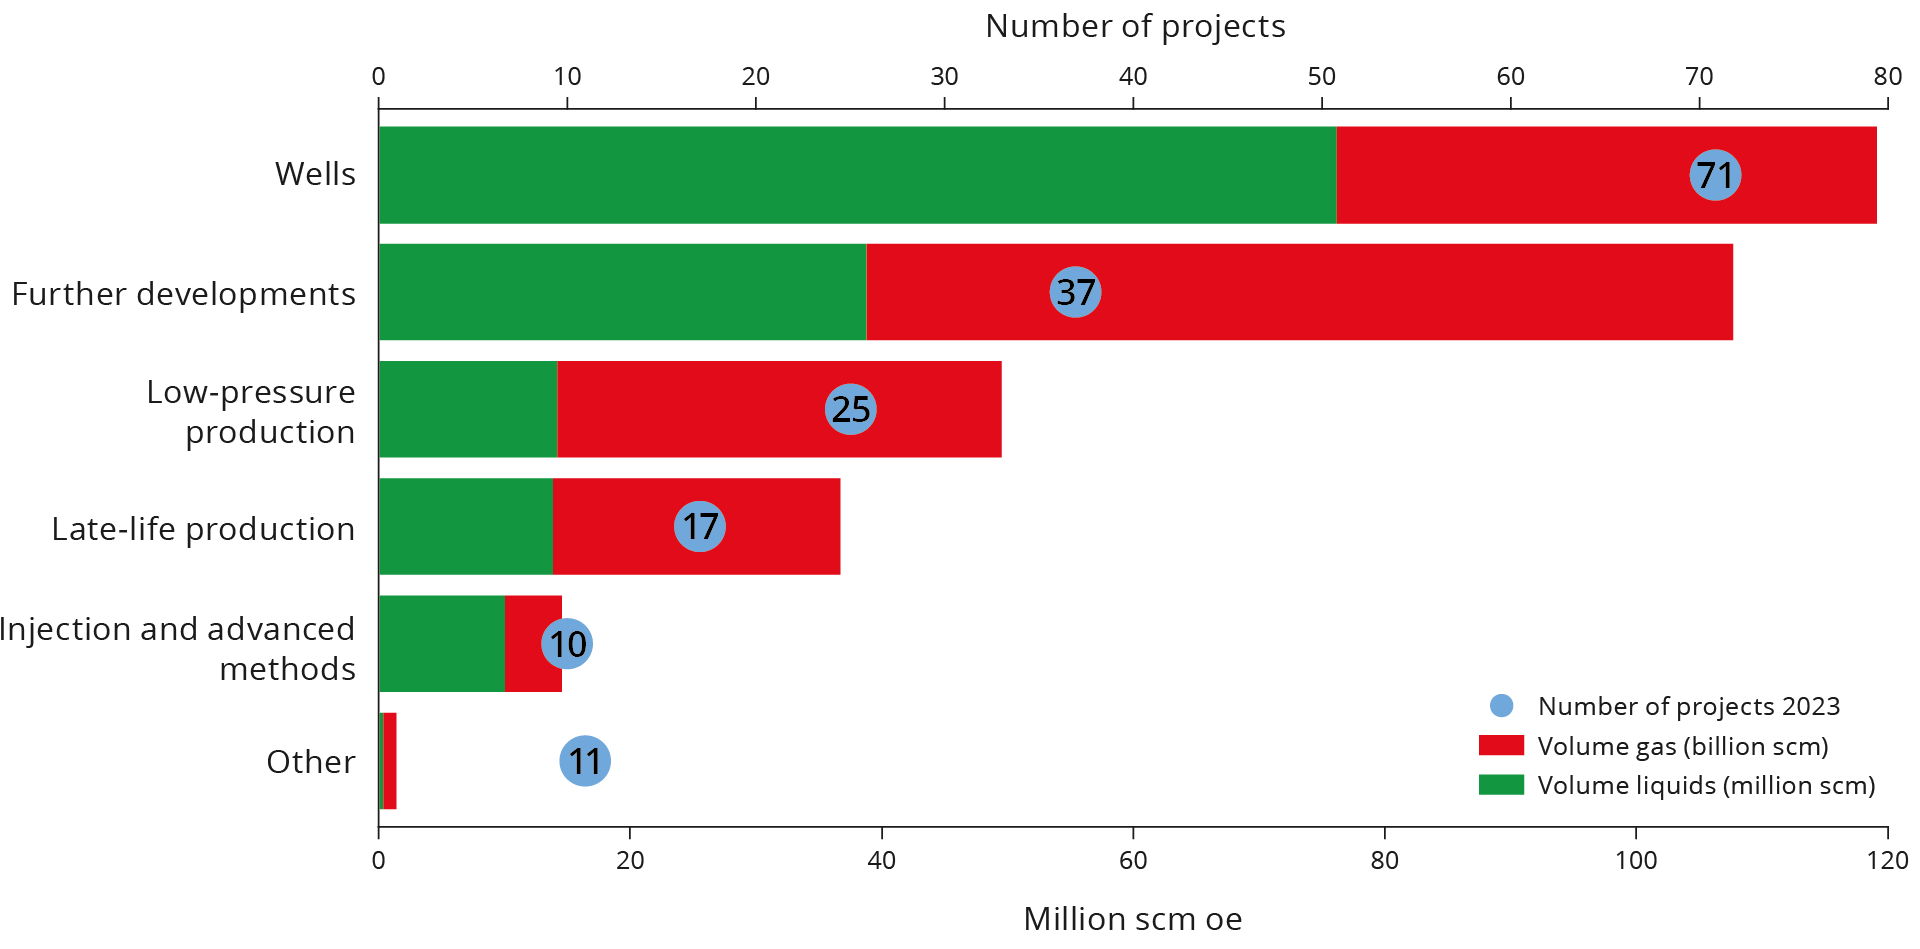
Figure 2-5 Concrete projects for improved recovery from fields; number of projects and resources.
2.2. Discoveries
2.2.1. Contingent resources in discoveries
There is a total of 261 million Sm³ of liquids and 233 billion Sm³ of gas in discoveries without development decisions; see Table 1-1. The total volume in discoveries has increased by 23 million Sm3 of o.e. compared with last year's Accounts. This increase was caused by results from exploration activity in 2023.
Fifteen discoveries were made in 2023, eight of which are included in the Resource Accounts as independent discoveries that are expected to be developed. The total resource estimate for these 8 discoveries is 48.5 million Sm3 of o.e.
Seven of the discoveries were made in the North Sea and one in the Barents Sea. Of the seven discoveries not included in the current portfolio for future developments, five are considered to be unlikely candidates for development and two are included in fields. One of these has already been approved for development.
In early 2023, the discovery portfolio consisted of 79 discoveries, and the portfolio remains at 79 discoveries at the end of 2023. Figure 2-6 shows an overview of developments in the number of discoveries in the portfolio through 2023, and Figure 2-7 shows equivalent info for the resource estimates.
A PDO has been submitted for one discovery 15/5-2 Eirin, and resources have been matured to reserves. Six discoveries have been included in fields or other discoveries as resources with possible development in 2023, while five previous discoveries have been re-assessed as unlikely candidates for development.
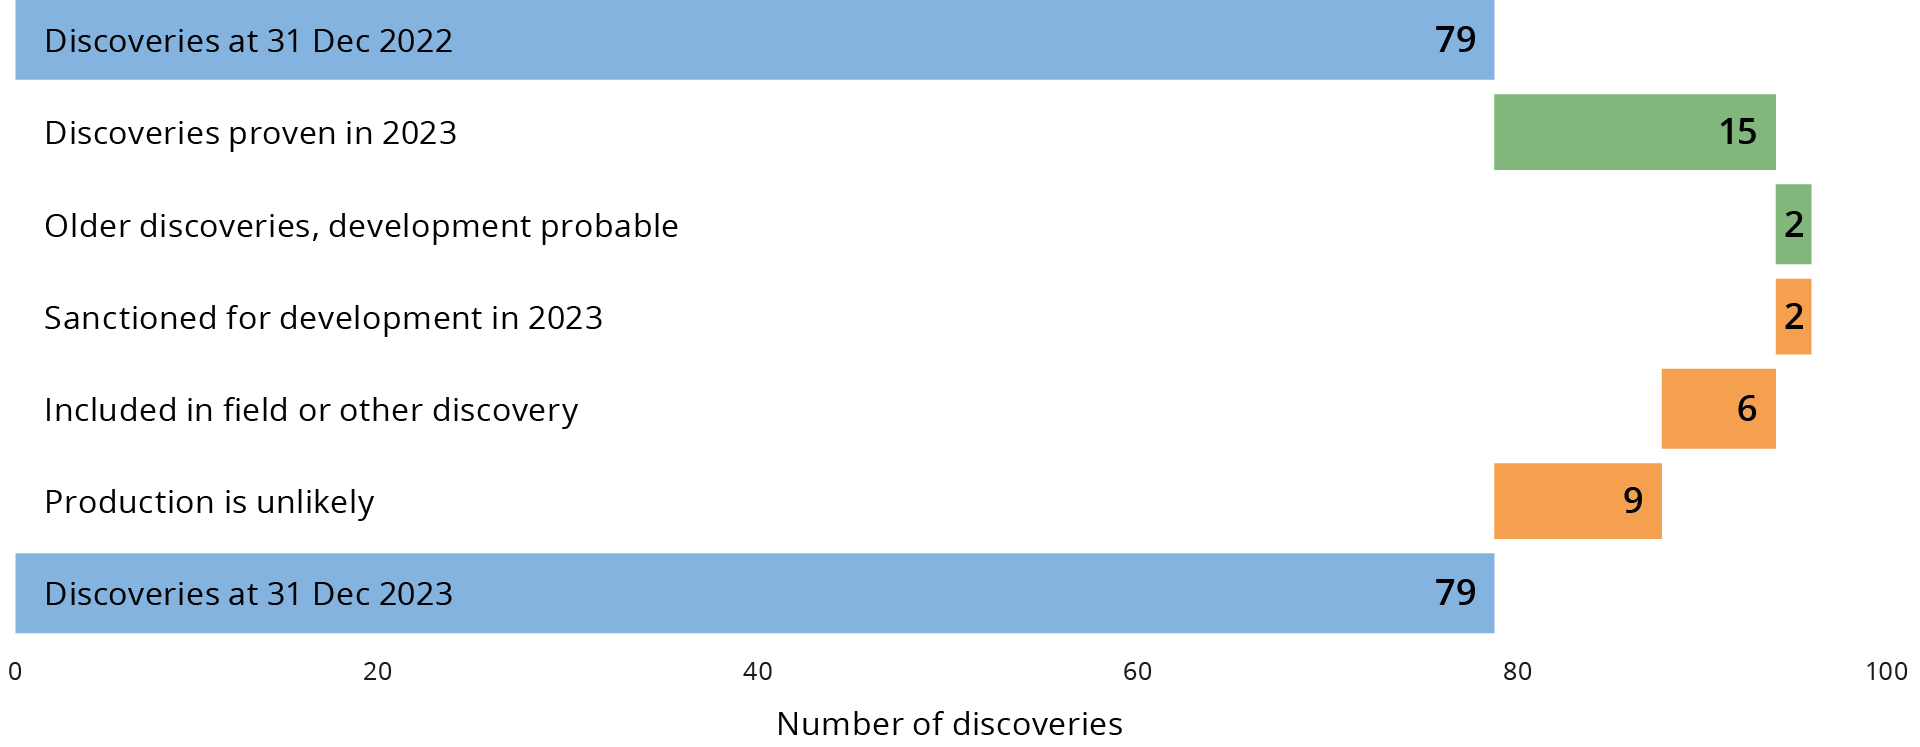
Figure 2-6 Overview of development in discovery portfolio through 2023. Categories in green show contributions to growth and categories in red show contributions to a reduction in the number of discoveries.
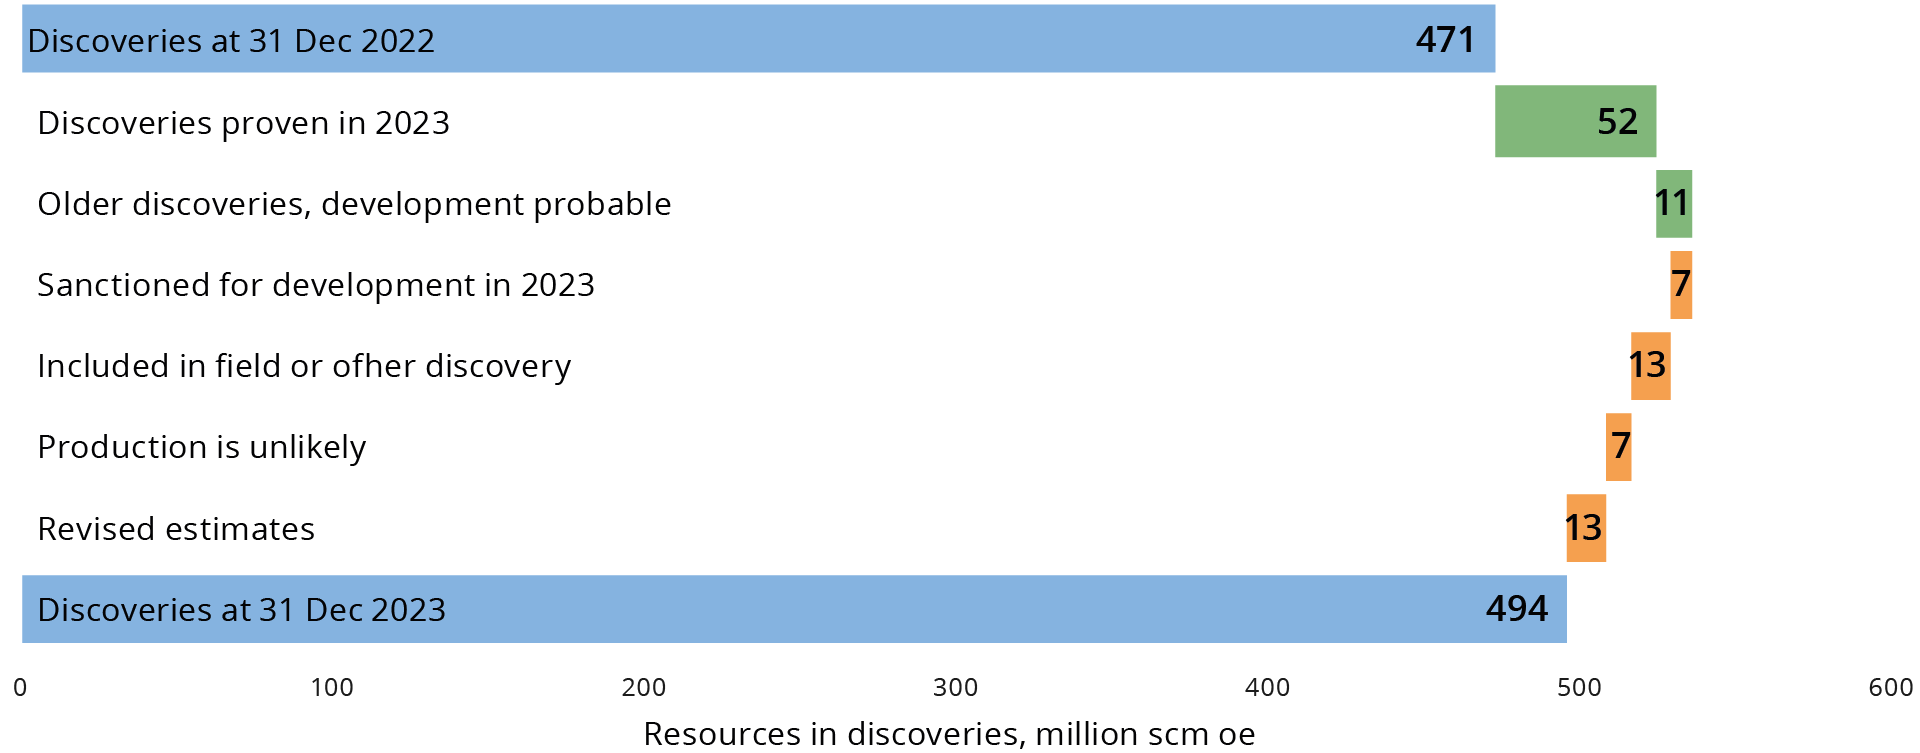
Figure 2-7 Overview of resource development in discovery portfolio through 2023. Categories in green show contribution to growth and categories in red show contributions to a reduction in resources without a development decision.
Assessments of whether discoveries will be profitable to develop will vary over time. Studies and measures could cause this status to change. In addition to changes associated with new discoveries and new categorisation, the updates also cover projections of what can be recovered from the various discoveries. Work is under way on new studies of the subsurface, changes in development solution concepts and conditions on the host installations.
2.2.2. Many small and a few larger developments
There are certain larger discoveries and several minor ones in all ocean areas on the Norwegian shelf.
The North Sea has seen the most discoveries, the largest of which is the gas discovery 35/2-1 (Peon). The largest in the Norwegian Sea is 6406/9-1 Linnorm, and 7324/8-1 (Wisting) is the largest discovery in the Barents Sea.
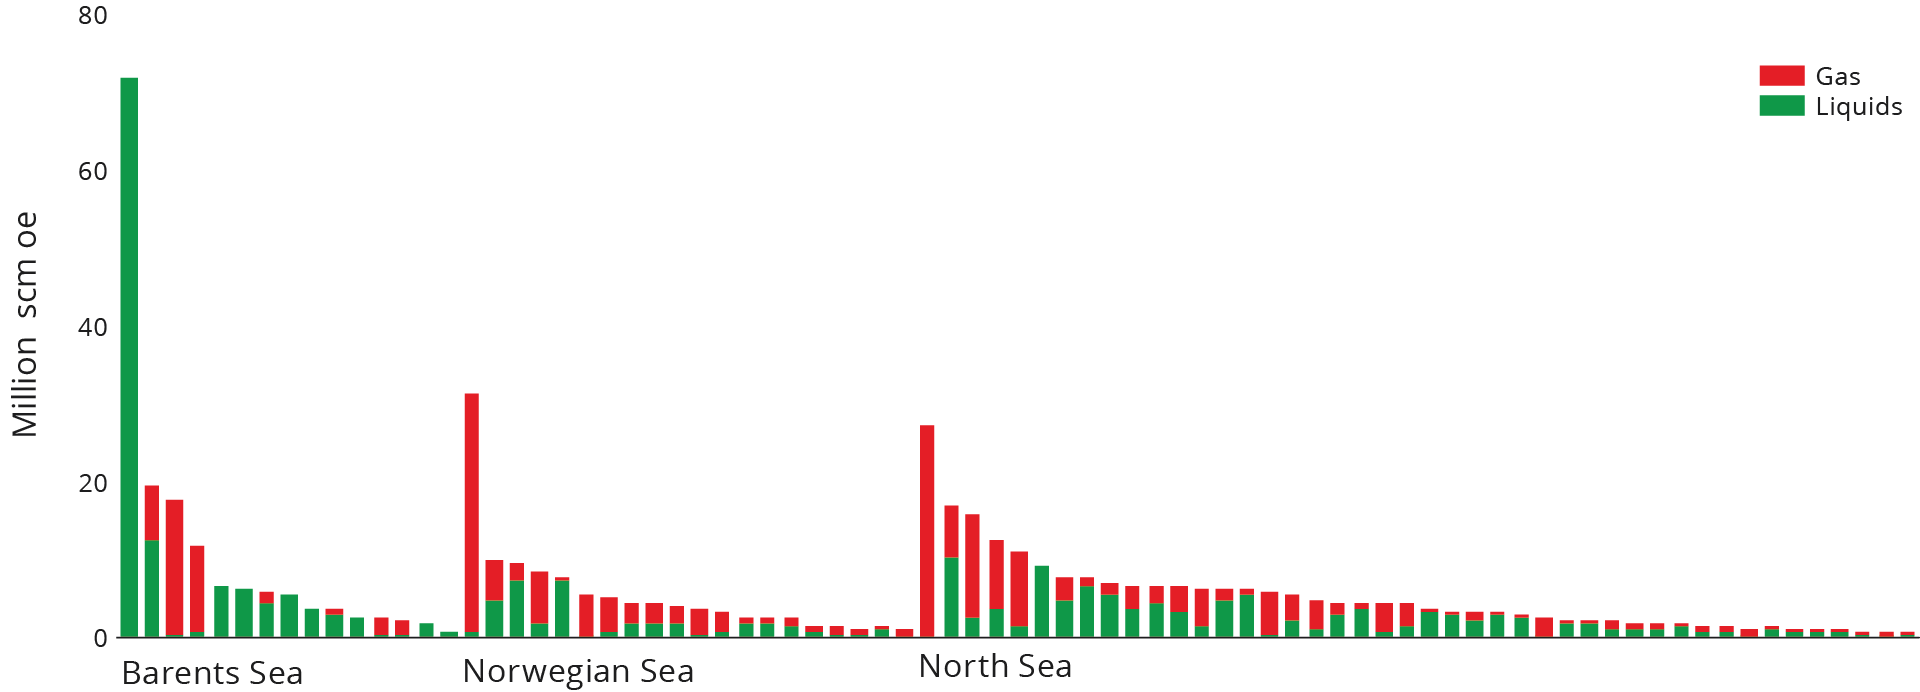
Figure 2-8 Discovery portfolio in the Resource Accounts.
Both new and old facilities are important for the further development of resources on the Norwegian shelf. A number of fields are tied into the existing infrastructure. Figure 2-9 shows that several more tie-backs/phase-ins are planned. New infrastructure is important for the development of resources in the area where it is established. This will allow for phasing in future discoveries, in addition to older discoveries that are not currently profitable for development.
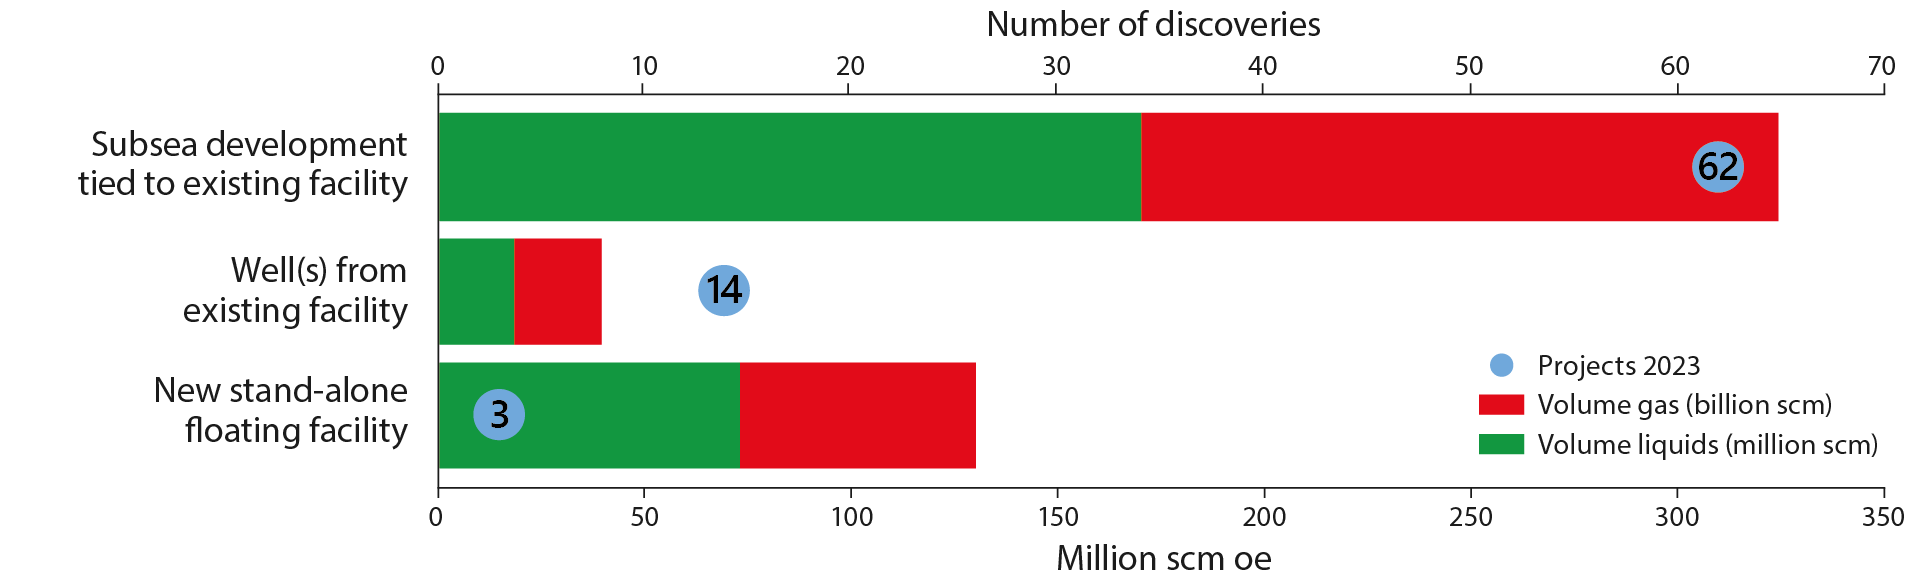
Figure 2-9 Likely development solutions for the 79 discoveries in this year's Resource Accounts, as well as overall resources per development solution.
A development with phase-in to existing fields or other major development projects is planned for 76 of the 79 discoveries in the figure. Several of the current discoveries are highly likely to have joint solutions or to be incorporated into fields before a development decision is made.
The most common development concept is subsea developments, and this is the most likely solution for 62 of the discoveries. Another possible solution for smaller discoveries close enough to infrastructure is to use vacant well slots on existing fields. Such a solution has been presumed for 14 discoveries.
In order to invest in independent production facilities, the resource volumes need to be relatively high, or the project needs to be a coordinated development of multiple small discoveries. Such developments are used in areas that lack access to sufficient capacity, or which are far from existing infrastructure.
2.2.3. Remaining discovered resources
Figure 2-10 shows how the resource categories have changed since 2022. The X axis starts at 3,000 million Sm3 of o.e. in an effort to highlight the changes. The changes in remaining discovered resources from 2022 amount to 4.9 per cent of overall remaining resources in 2023.
Remaining discovered resources have been reduced by over 150 million Sm3 of o.e. from 2022 to 2023. 2023 saw a high level of production and a weak increase in reserves and contingent resources in fields and discoveries. The increase in gross reserves amounted to 24 million Sm³ of o.e.
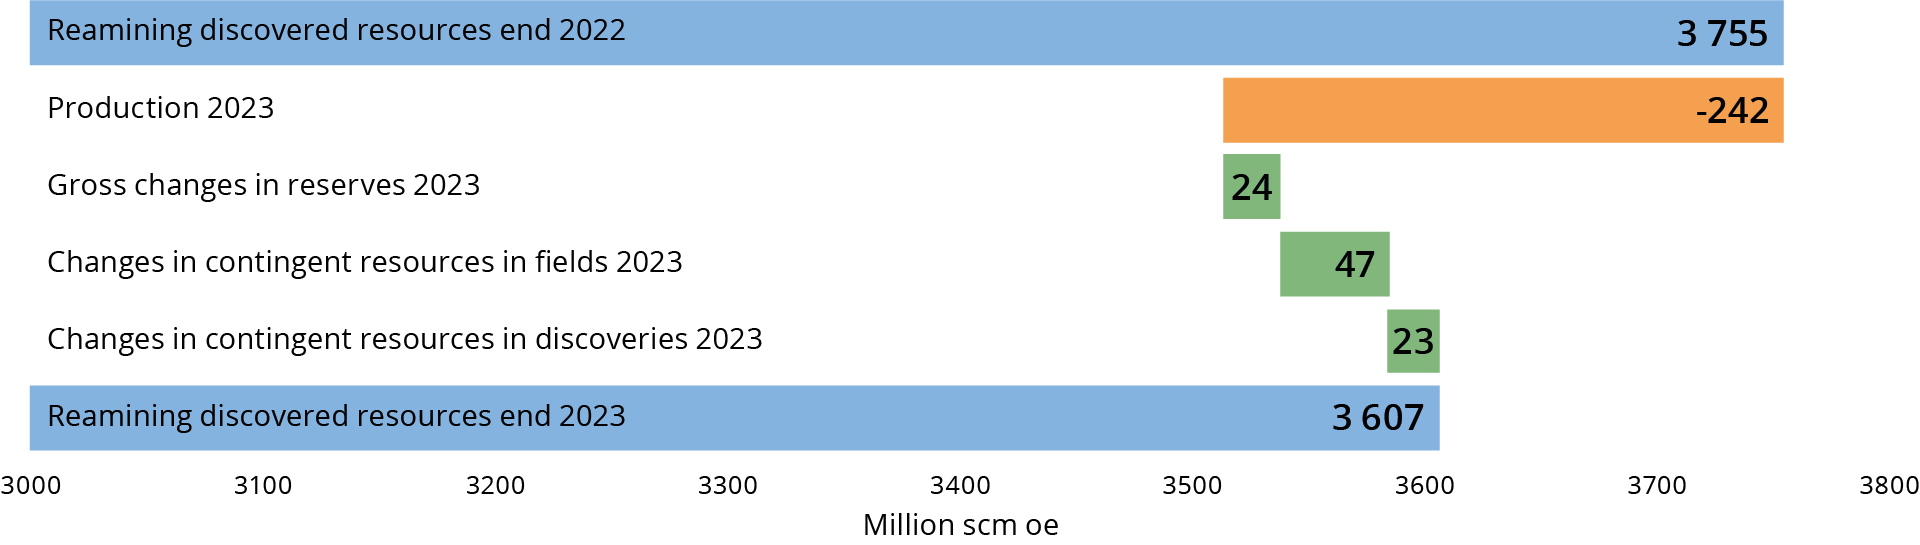
Figure 2-10 Overview of the changes in discovered resources from 2022 to 2023.