4 – Production
A total of 8,489 million Sm³ of o.e. has been sold from the Norwegian shelf. The annual sales volumes for oil and gas are shown in Figure 4-1. Measured in oil equivalent (o.e.), more gas than oil has been sold over the last ten years.).
During the 1985–2005 period, oil production was significantly higher than gas production.
At year-end, 92 fields were classified as "producing" on the Norwegian shelf.
In 2023 production started in the four following fields:
- Fenja and Bauge in the Norwegian Sea
- Tommeliten A and Breidablikk in the North Sea.
This was in addition to production starting from development projects Frosk (as part of Bøyla), Kobra East and Gekko (as part of Alvheim) and Blåbjørn (as part of Åsgard).
Five fields shut down in 2023; Flyndre and Heimdal with associated fields Atla, Skirne and Vale.
Oil production is presumed to reach a new peak of just under two million barrels per day in 2025, which is 60 per cent of the peak level from 2001.
Gas sales have been relatively high over the last ten years and are expected to remain at the same level moving forward, about 120 billion Sm3.
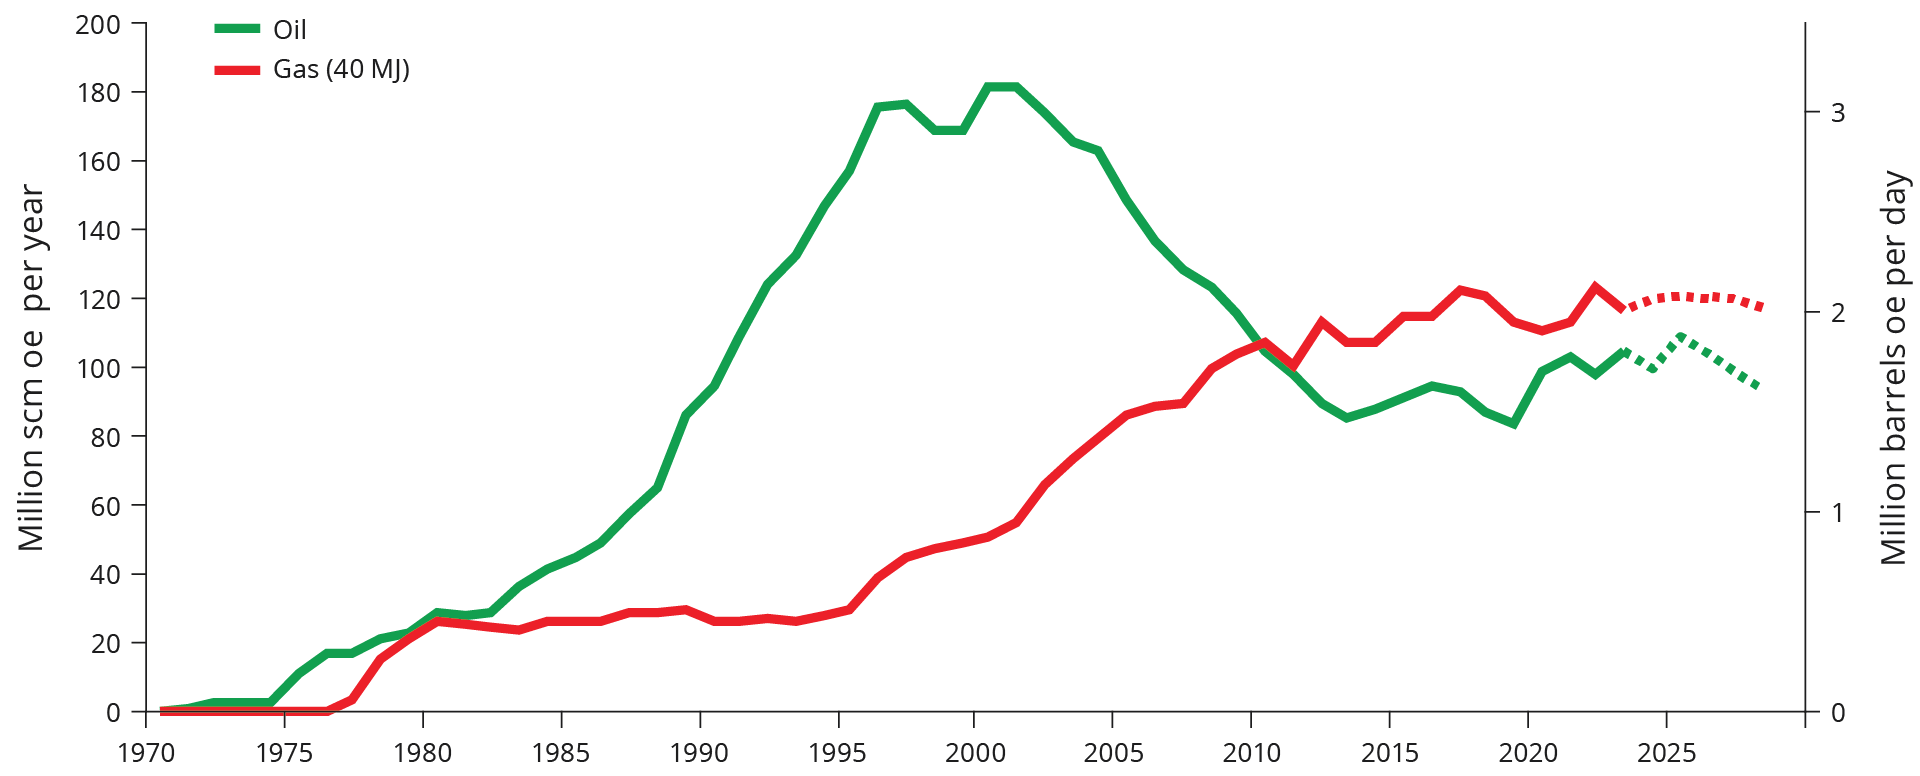
Figure 4-1 Historical sales of oil and gas with forecast (dotted lines) leading up to 2026.
Without new fields or major investments in existing fields, production from the Norwegian shelf will decline. As a result of high development activity in recent years, we expect production to increase over the short term. New fields will offset lower production from ageing fields.
The production level is uncertain over the longer term. This will depend, among other things, on which measures are implemented on the fields, which discoveries are approved for development, and when they come on stream. New discoveries, their size and how and when they are developed, will also affect the production level moving forward. Historical total production and a forecast leading up to 2033, distributed by maturity of resources, is shown in Figure 4-2.
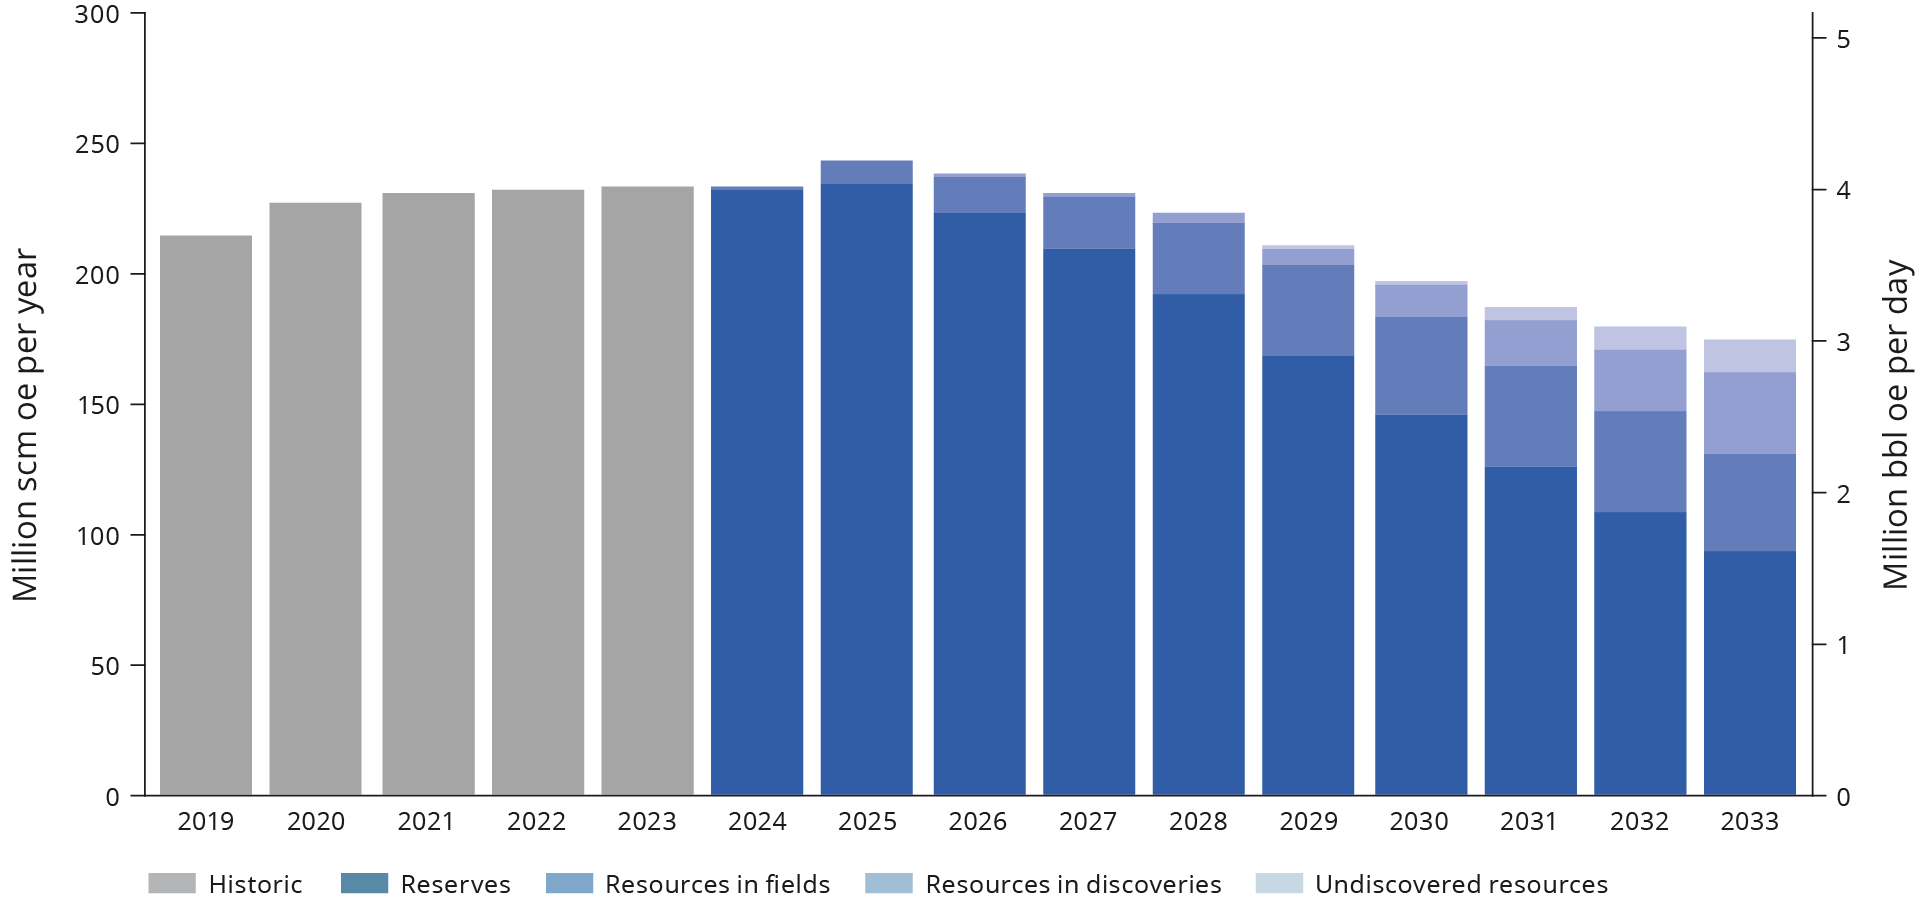
Figure 4-2 Historical total production and forecast distributed by maturity of resources.