1 – Resource Accounts for the Norwegian continental shelf 2021
Primary trends:
- Increase in proven resources.
- The proven resources have increased by 142 million standard cubic metres of oil equivalent (million scm oe) compared with last year's Accounts. 65 per cent of the increase is for gas.
- Good reserve growth, particularly for gas.
- As regards gross reserves, there was an increase of 165 million scm oe this year, compared with the Accounts for 2020. The increase in 2021 can primarily be explained with the increased submission of plans for development and operation (PDOs) and extended operating periods for several fields.
- The estimate for overall undiscovered resources is nearly unchanged.
- The NPD has increased the estimate for liquids resources in the Norwegian Sea and reduced the estimate for liquids and gas resources in the Barents Sea.
Oil and gas resources on the Norwegian continental shelf
Oil and gas resources are discovered, discoveries are developed as fields, if they are economically and technologically viable and the oil and gas is produced and sold. This results in dynamic resource accounts that change from year to year.
In the Resource Accounts as per 31 Dec. 2021 (Excel), the estimates for the overall resource volumes (including what has been sold and delivered) on the Norwegian shelf are
- 8,309 million scm oil
- 6,605 billion scm gas
- A total of 15,864 million scm oe
- This is an increase of 97 million scm oecompared with 2020
The total estimates for oil, liquids (oil, condensate and NGL), gas and overall petroleum products are shown in Table 1‑1 along with changes from the Resource Accounts in 2020. The proven resources have increased by 142 million standard cubic metres of oil equivalent (million scm oe) compared with last year's Accounts. 65 per cent of the increase is for gas.
The volumes are listed in oil equivalent (1,000 scm gas = 1 scm oe)
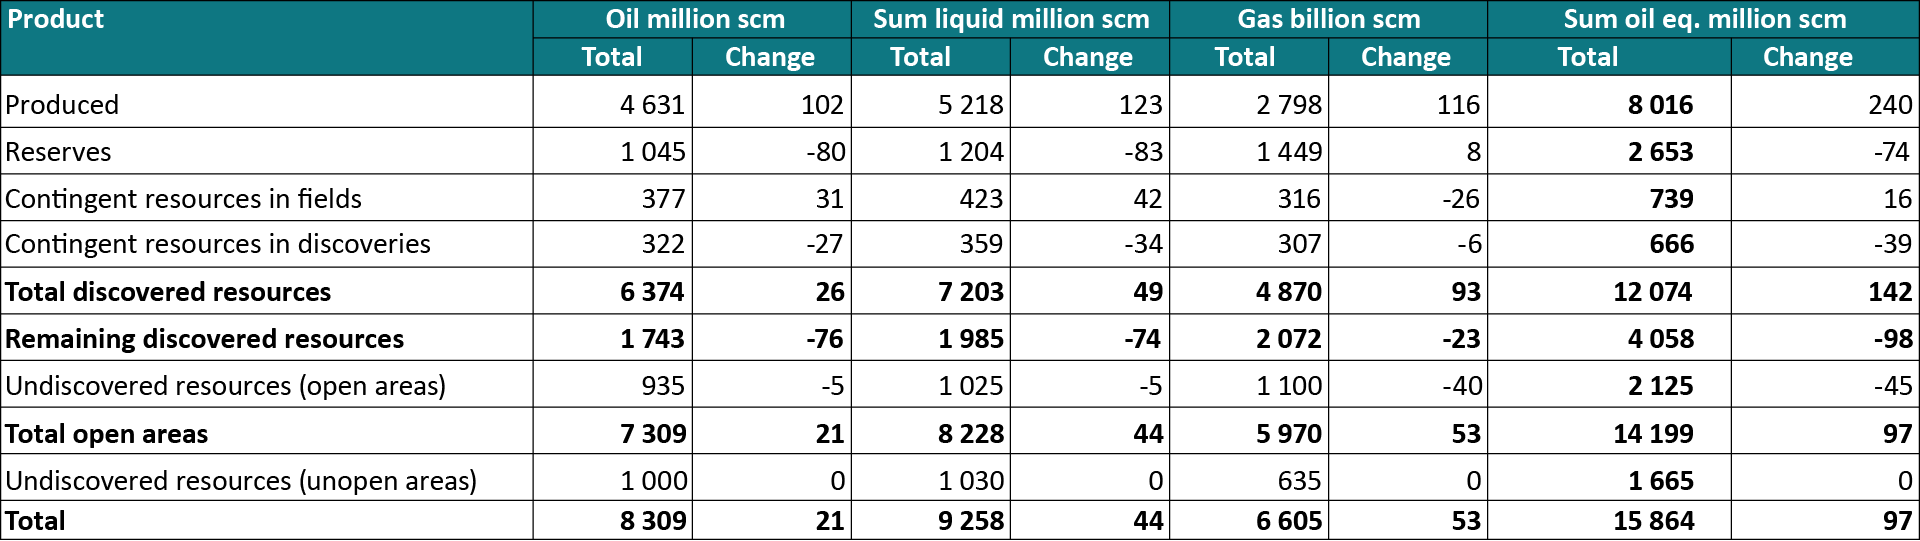
Table 1‑1 Expected values for petroleum resources as per 31 December 2021 with changes from 2020. (Liquids are oil, condensate and NGL)
In this table, the petroleum resources are split into resource categories, reserves, contingent resources and undiscovered resources; this is described in the appendix
The Norwegian Petroleum Directorate estimates undiscovered resources both in areas that are open for petroleum activities, as well as in areas that have not been opened. These estimates contain the volumes of petroleum that we estimate could be extracted from deposits that have yet to be proven through drilling.
The distribution of the remaining resource volumes into resource categories along with the volume sold and delivered as per 31 Dec. 2021 is shown in Figure 1-1. The middle of the columns shows the expected recoverable petroleum. Uncertainty in the overall estimates is illustrated with a low estimate on the left and a high estimate on the right in each column. The pie chart on the right shows that 50 per cent of the expected recoverable resources on the shelf have been produced, and that 24 per cent of the overall resources have yet to be discovered.
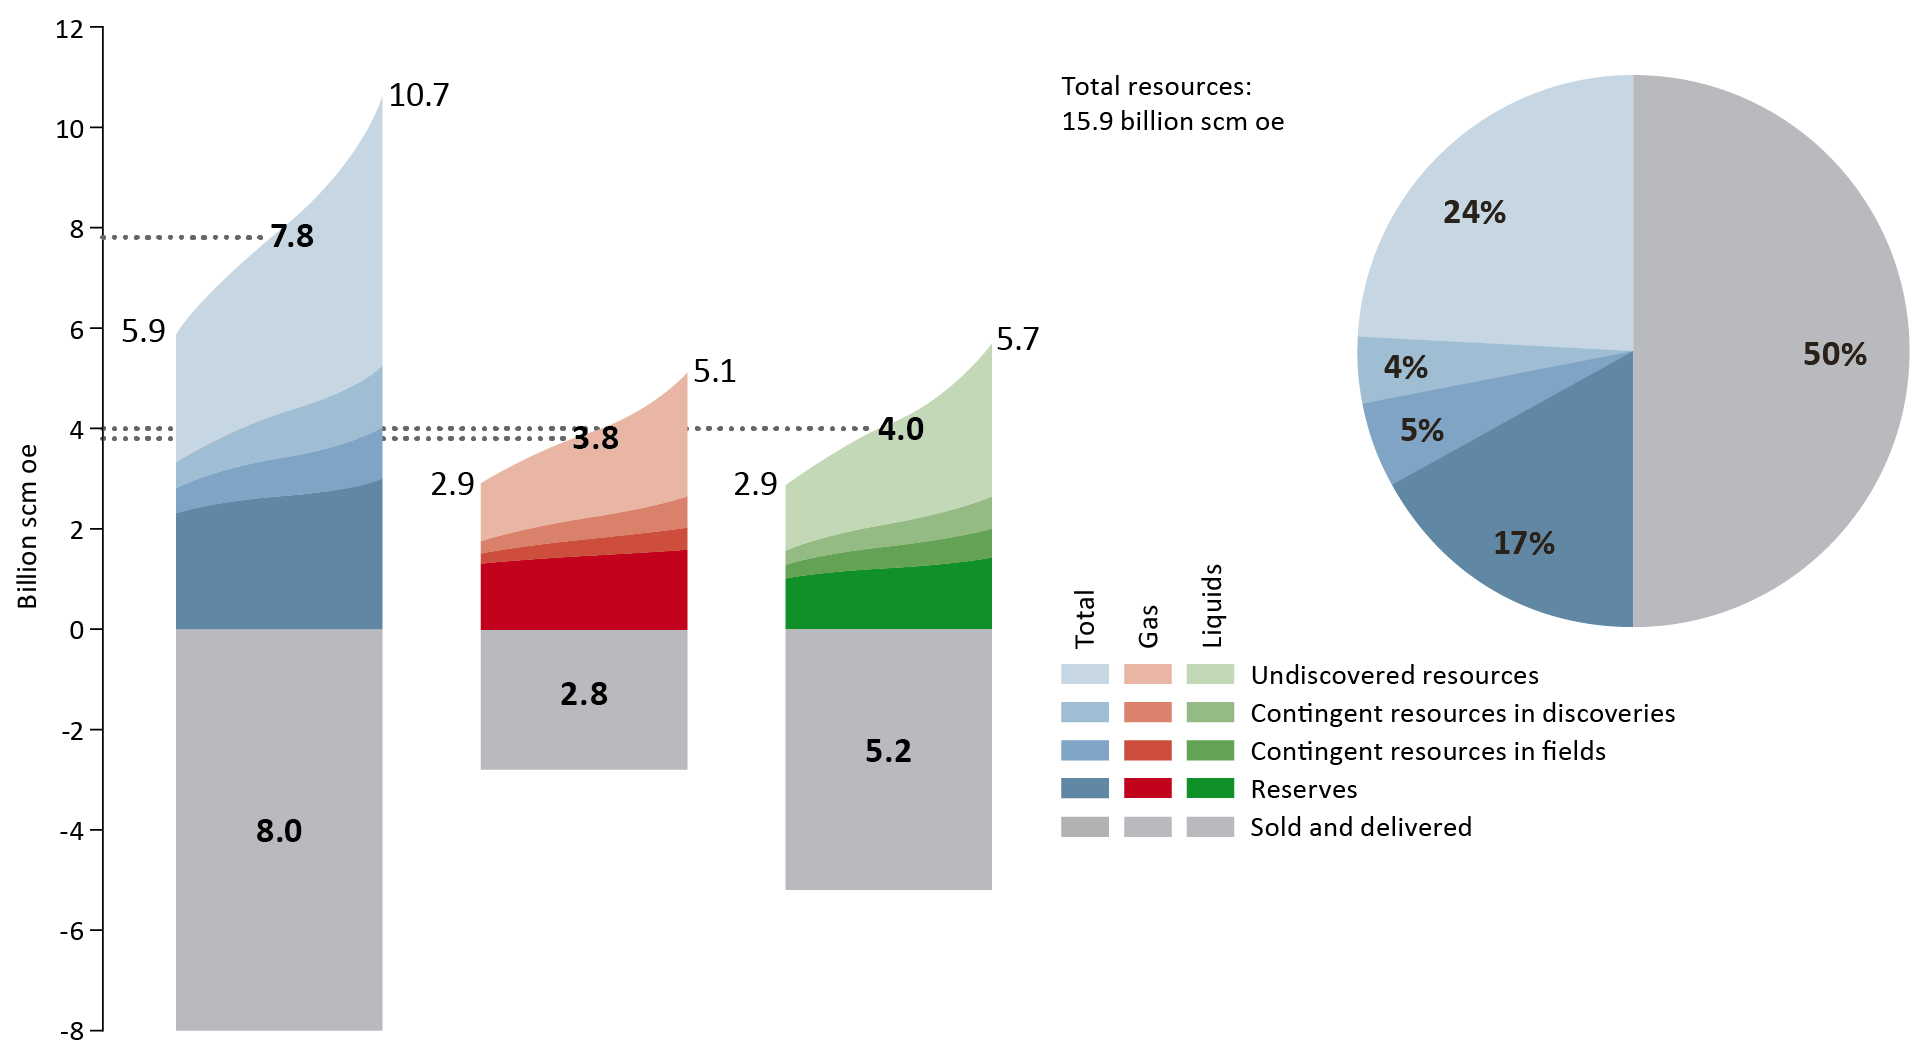
Figure 1-1 Petroleum resources and uncertainty in the estimates as per 31 Dec. 2021.
Resource development
Resource estimates change over time. New information and knowledge change the expected value and uncertainty associated with the overall resources. As resources are mapped, proven, matured and finally produced, their status changes. Figure 1.2 below shows the changes in the estimates for liquids and gas over the last ten years.
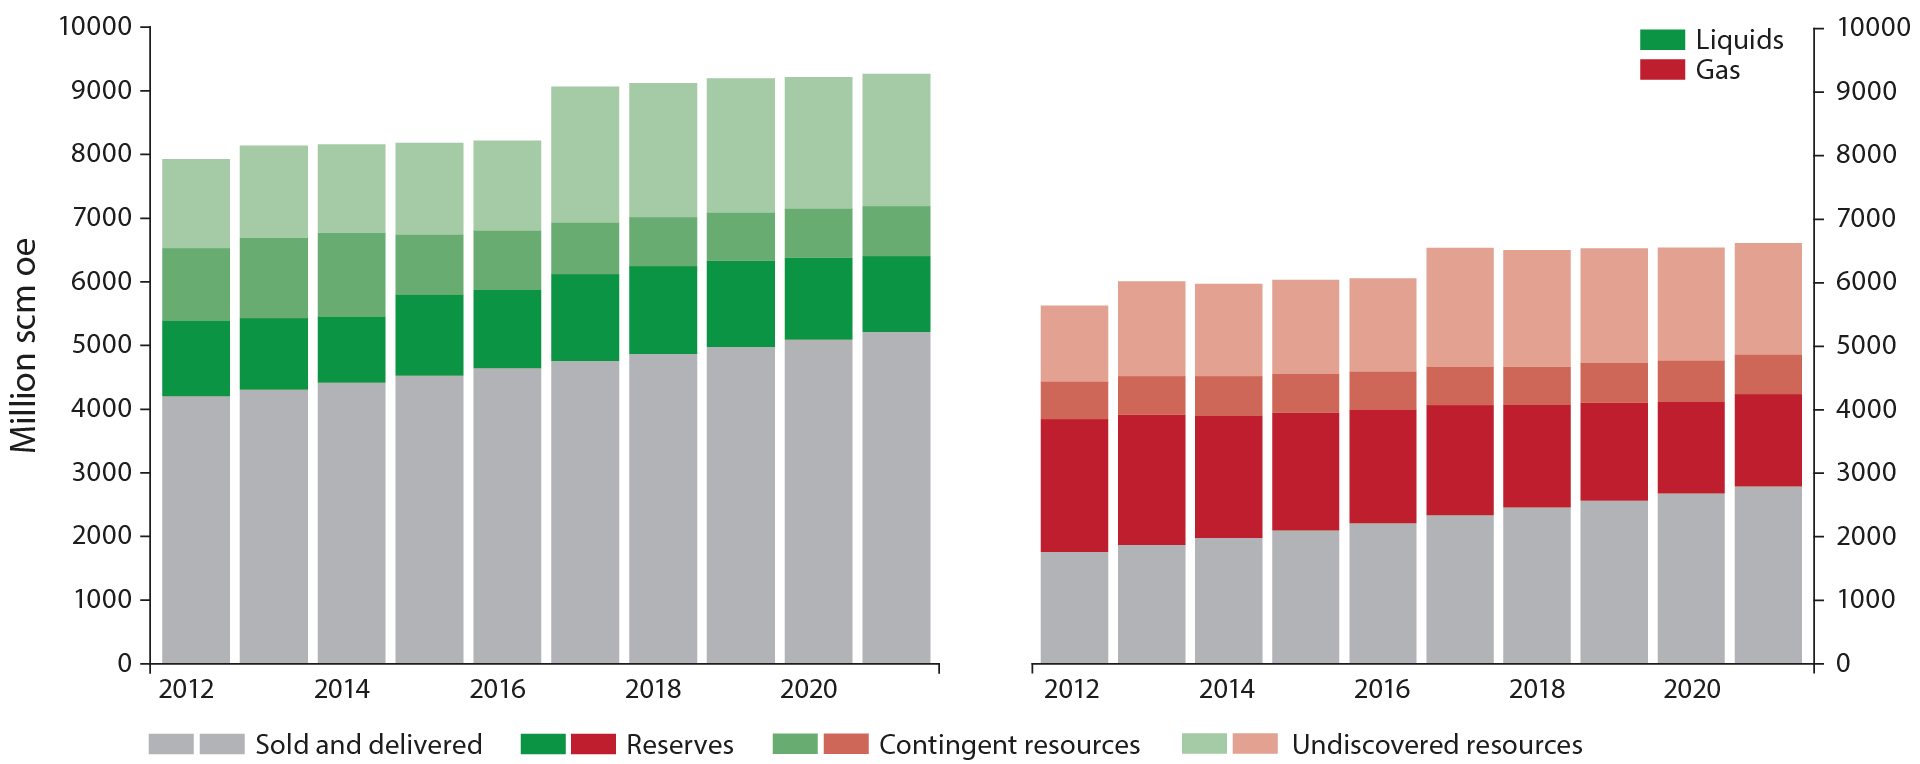
Figure 1-2 Development in expected value for liquids and gas resources over the last ten years. Liquids on the left and gas on the right.
The increase in undiscovered resources in 2017 is caused by including the resources in the Barents Sea North in the estimates. There has been a steady increase in both gross reserves and proven resources for liquids.
As regards gas, there has been a minor increase in gross reserves.
Oil and gas resources in Norwegian ocean areas
The three ocean areas the North Sea, Norwegian Sea and Barents Sea are different both as regards geology, resource base, maturity and scope of infrastructure and knowledge. An overview of the resources in the three ocean areas can be found here (Link to Resource Accounts in Excel format).
There has been petroleum activity in the North Sea since 1965. The Norwegian Sea and Barents Sea (areas north of the 62nd parallel) were opened for petroleum activities in 1980. The remaining resources and distribution between discovered and undiscovered resources in opened and unopened areas, respectively, therefore differ between the three ocean areas. The expected estimates can be found in Figure 1-3, which shows the distribution for oil and gas, respectively. The uncertainty in the volume estimates declines along with increasing maturity; read more in Chapter 3 about uncertainty in the undiscovered resources.
In the North Sea, the majority of oil and gas is defined as reserves, which means that they have approved plans for recovery. In the Barents Sea, the majority of oil and gas resources have the status of undiscovered. Vast areas in the Barents Sea have yet to be opened for petroleum activity, and this is where we find the greatest expected value for undiscovered resources.
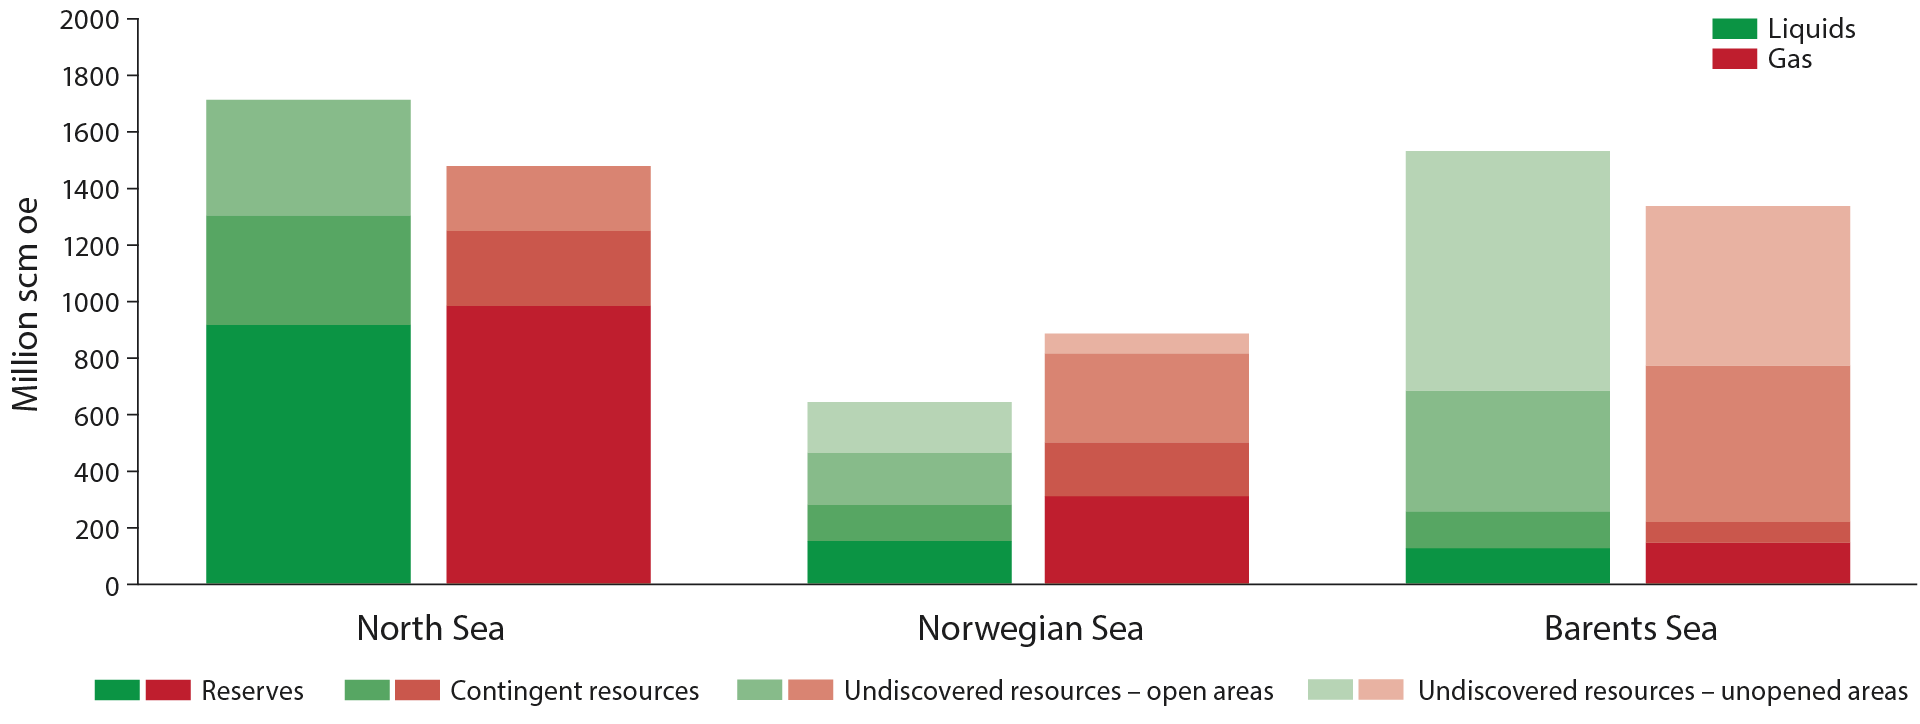
Figure 1-3 Distribution of remaining liquids and gas resources (expected values) distributed by ocean area and resource category. Liquids resources are shown in green and gas resources in red.