2 – Discovered resources
The NPD's resource classification system defines oil and gas resources as reserves once the operator has submitted a plan for development and operation (PDO) or decided to implement a measure to optimise recovery that does not require a PDO. Discoveries are classified as fields once a development plan is approved. There are currently more than 100 fields in production, under development, or with plans for re-development.
The fields with the greatest remaining oil reserves as per 31 Dec. 2021 are Johan Sverdrup (346 million scm), Johan Castberg (90 million scm) and Snorre (74 million scm). The remaining gas reserves are greatest in Troll (685 billion scm), Snøhvit (148 billion scm) and Ormen Lange (105 billion scm).
Reserves
The overall remaining reserves total 1,045 million scmof oil and 1,449 billion scm of gas. This year's Resource Accounts show good growth in gas reserves, 125 billion scm. This is the highest reserve growth in gas since 2012. The growth in liquid reserves is lower, 40 million scm. The increase is mainly caused by the companies adopting and submitting more PDOs in 2021, and that the reserves increased on several fields, e.g. due to a longer expected operating period. Reserve estimates and production for each field can be found in Resource Accounts as per 31 Dec. 2021 (Excel).
In 2014, the Norwegian Petroleum Directorate established a goal for oil reserve growth of 1,200 million scmfor the 2014-2023 period. This was done to ensure necessary focus on reserve growth, and to simultaneously follow up the development in a systematic manner.
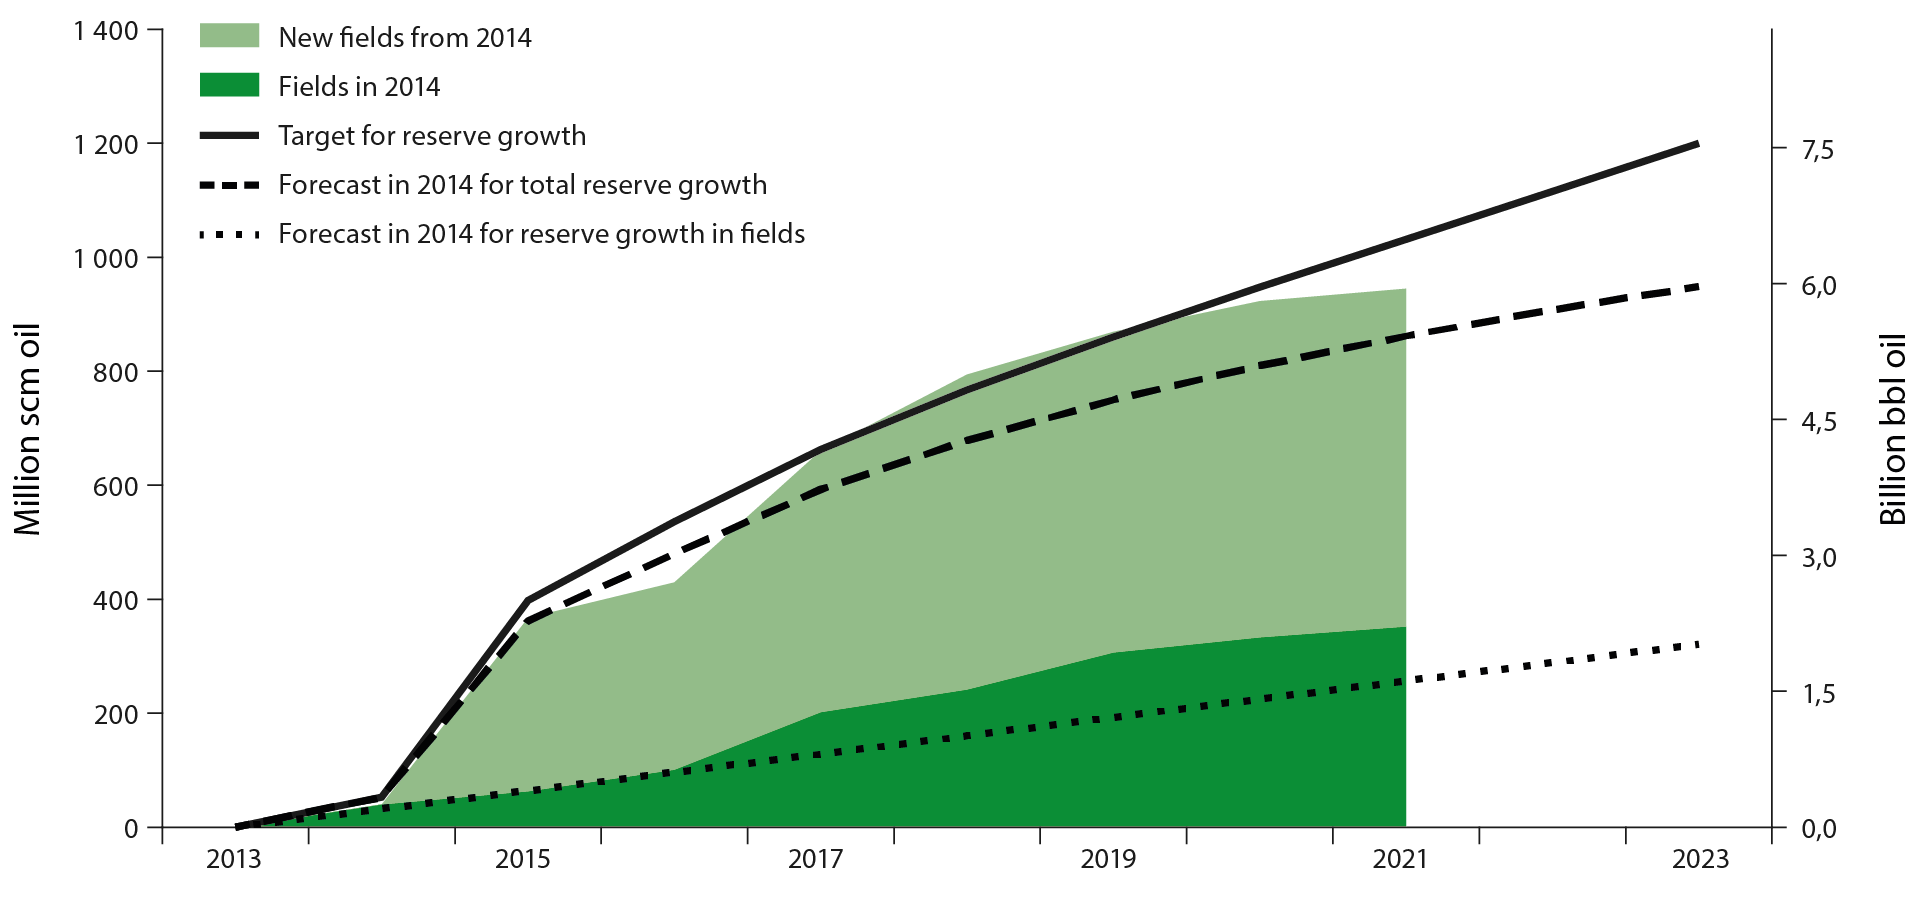
Figure 2-1 Growth in oil reserves from 2014 to 2021 compared with the NPD's forecast and goal from 2014. The growth is distributed between reserves from fields and from new discoveries that have come on stream.
The figures below show the changes in reserves, including produced volumes during the 2012-2021 period. The production is replaced by reserve growth in the years where the columns exceed production, shown in the dotted lines. The last ten-year period has seen an increase in liquids reserves, while there has been a reduction for gas; see Figure 2-2.
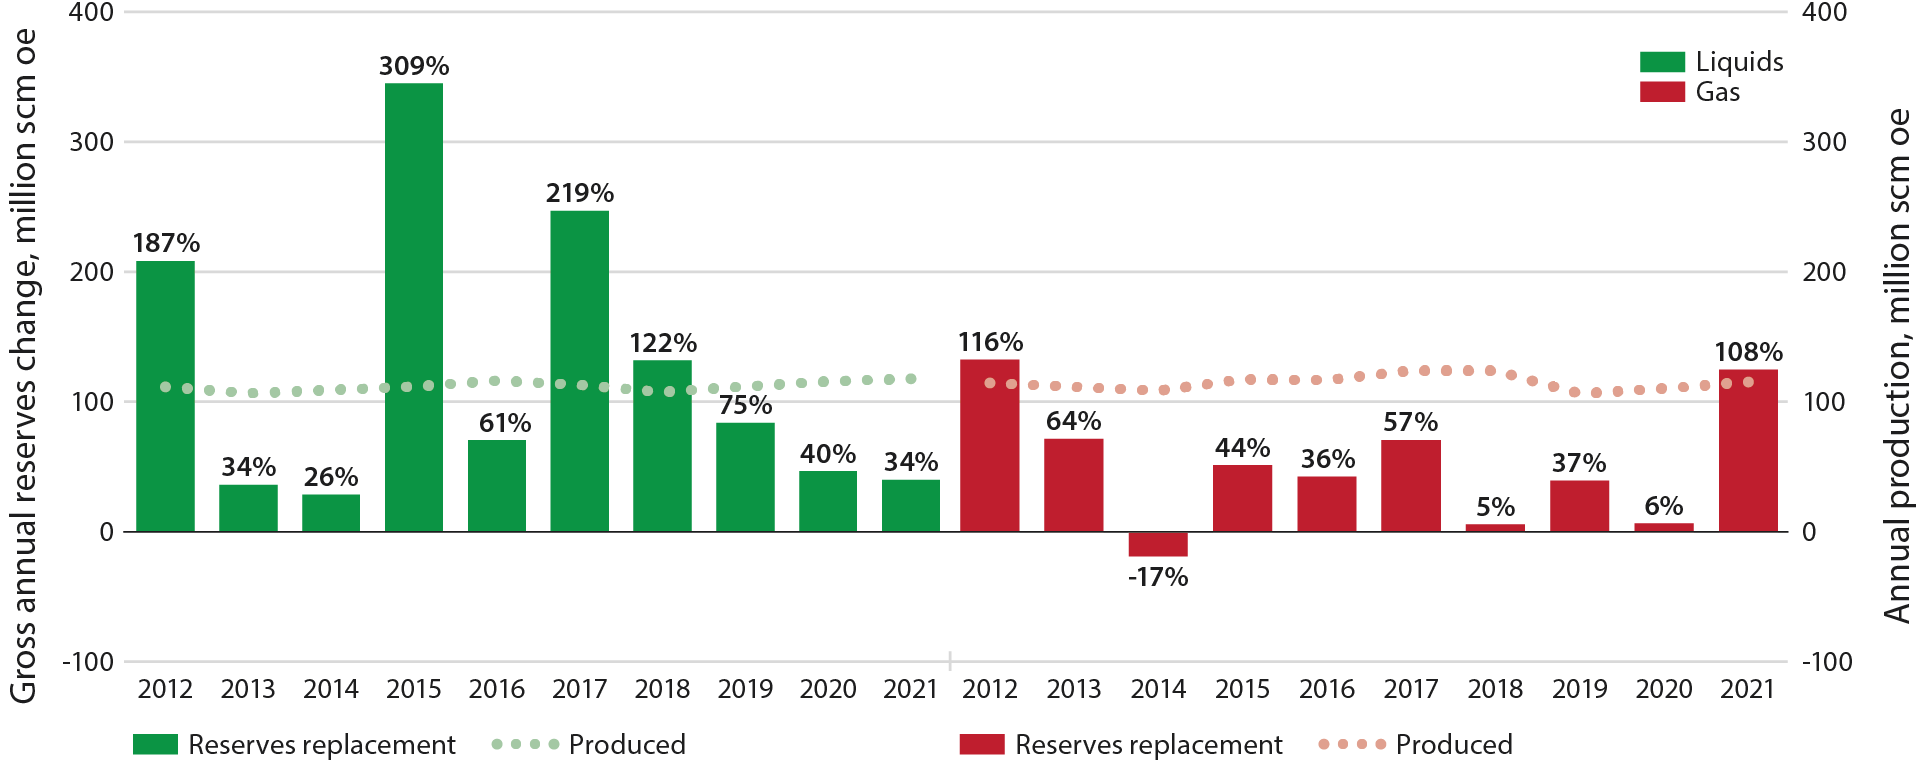
Figure 2-2 Reserve and production development for liquids and gas over the last ten-year period; the percentage shows annual reserve replacement
1,120 million scm of liquids has been produced since 2011, and the Accounts show that the remaining reserves are 117 million scm higher than in 2011. This means that the reserve replacement for liquids has exceeded 100 per cent over the last 10 years, while 34 per cent of the produced liquids reserves were replaced in 2021.
Gas production since 2011 totals 1,149 billion scm, and the Accounts show that the remaining reserves are 622 billion scm lower than in 2011. This yields a reserve replacement for gas of just under 50 per cent over the last 10 years, while more than 100 per cent of the produced gas reserves were replaced in 2021.
Contingent resources in fields
The expected value for contingent oil resources in fields is 377 million scm which is an increase of 31 million scm from 2020. The increase is caused by a project for late-phase production on Snorre.
For gas, the expectation is 316 billion scm, which is a reduction of 26 billion scm compared with 2020. This reduction is mainly caused by maturing resources into reserves and the submission of PDOs for e.g. Ormen Lange phase 3 and low-pressure production on Oseberg.
The Resource Accounts for 2021 include 184 specific, but not yet adopted, projects for improved oil and/or gas production and extended lifetime. Figure 2-3 shows these projects distributed by project type with associated resources shown in oe.
Projects to improve recovery are dominated by new wells, both in the number of projects (75) and volume (approx. 130 million scm oe). Other projects that could contribute considerably are further developments, particularly subsea developments with new templates tied into existing facilities, low-pressure and late-phase production. Fewer measures have been identified which utilise new injection or advanced methods.
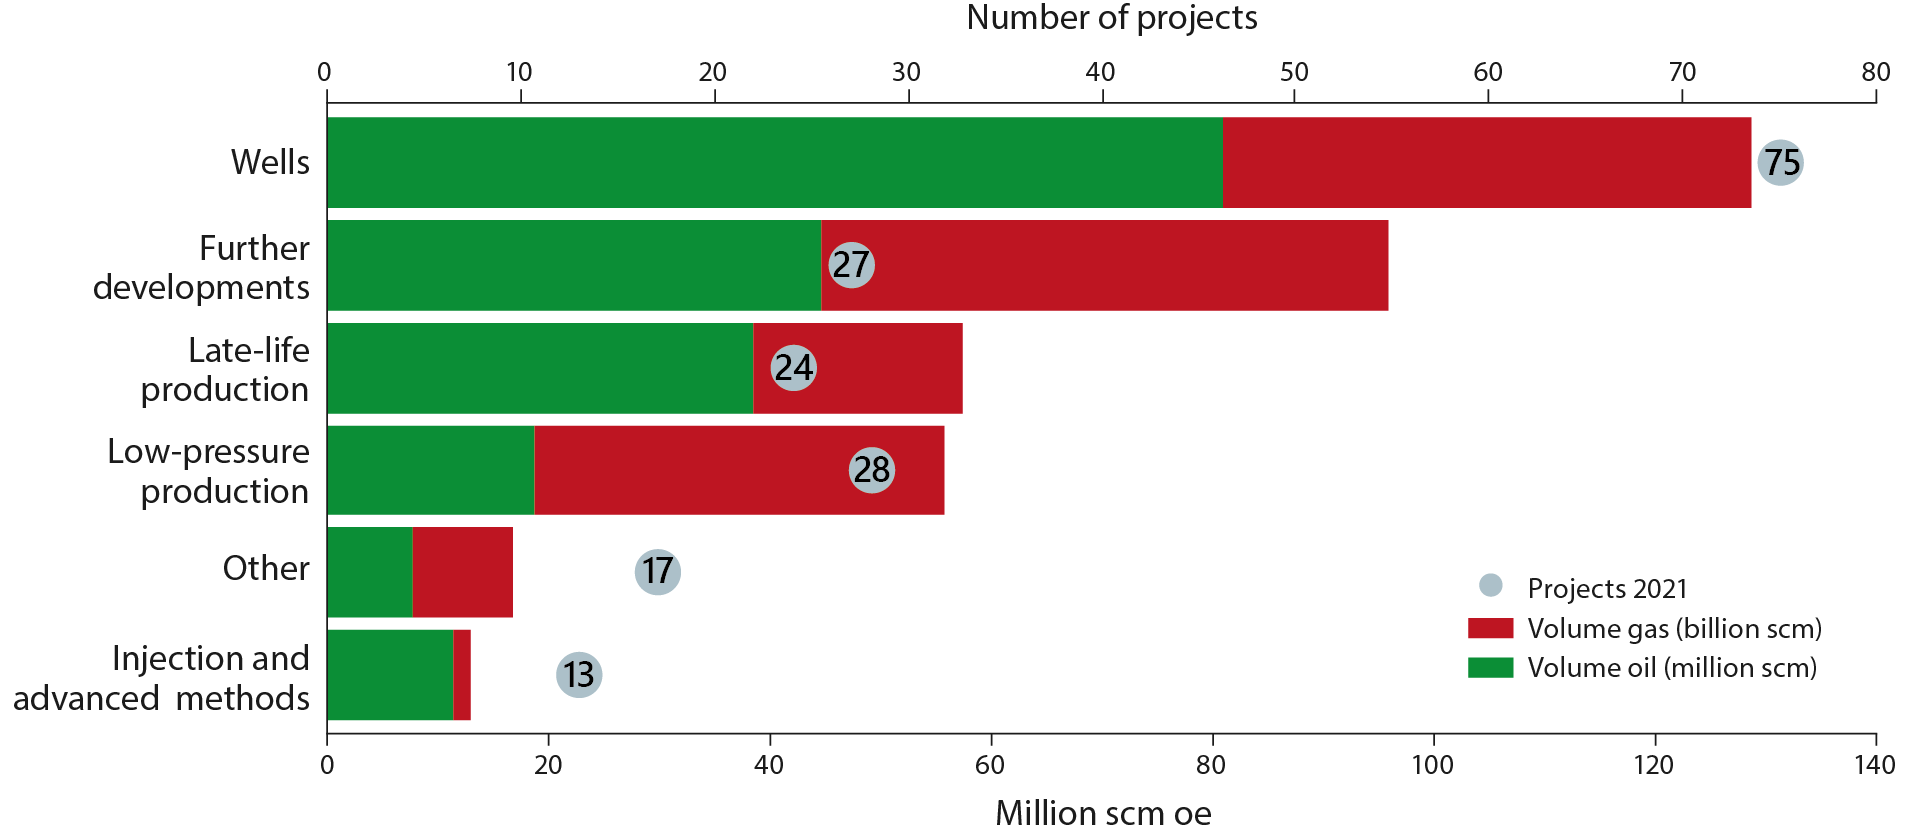
Figure 2-3 Specific projects for improved recovery from fields; number of projects and resources
Uncertainty – fields
The reserve estimates are based on thoroughly prepared plans. Nevertheless, there is uncertainty in the estimates, in the implementation of plans and whether everything will be produced. Despite the reserves being linked to production from existing fields, there is always uncertainty, because both the reservoir and technology can perform differently than expected. The range of uncertainty is shown in Figure 2-4.
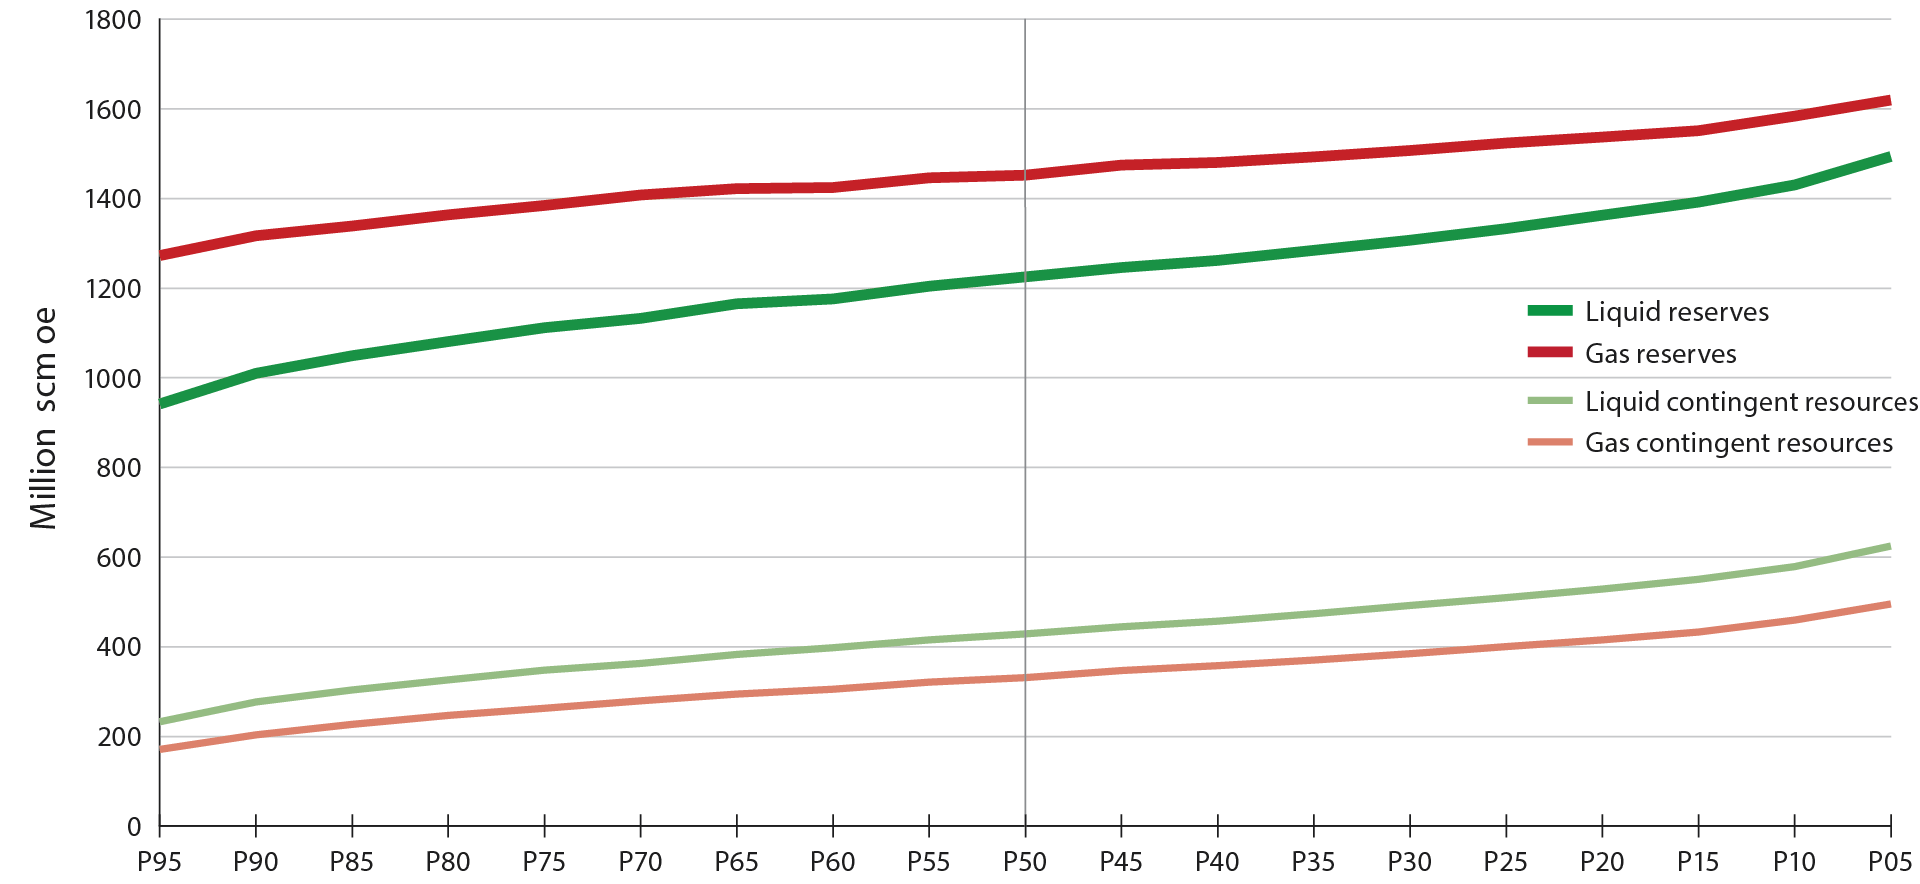
Figure 2-4 Uncertainty in reserves and contingent resources in fields for liquids and gas
The figure shows a probability distribution for the various volume estimates. The low end is the P95 estimate (95 per cent likelihood that the volume exceeds this value), and the high end is the P5 estimate (5 per cent likelihood that the volume exceeds this value).
Discoveries
Twenty discoveries were made in 2021, 18 of which in exploration wells and 2 in development wells with exploration targets. Thirteen of the discoveries were made in the North Sea, 4 in the Norwegian Sea and 3 in the Barents Sea.
On 1 January 2021, the discovery portfolio consisted of 95 discoveries. At the end of 2021, this number was 88, despite 20 new discoveries being made during the year; see Figure 2-5.
Assessments of whether discoveries will be profitable to develop will vary over time. Studies and measures could cause this status to change.
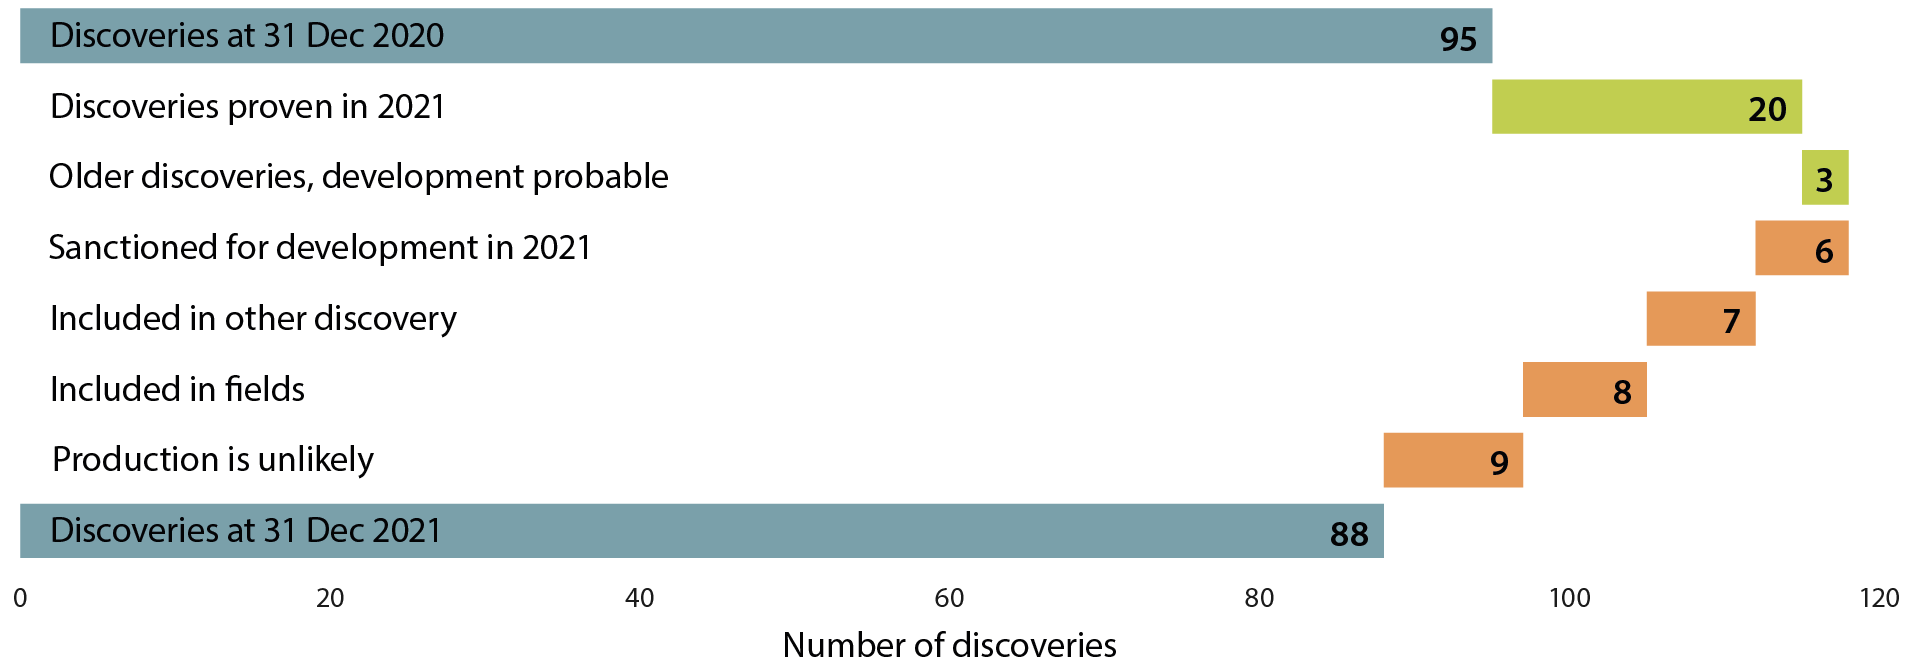
Figure 2-5 Overview of development in discovery portfolio through 2021. Categories in green show contributions to growth and categories in red show contributions to a reduction in the number of discoveries
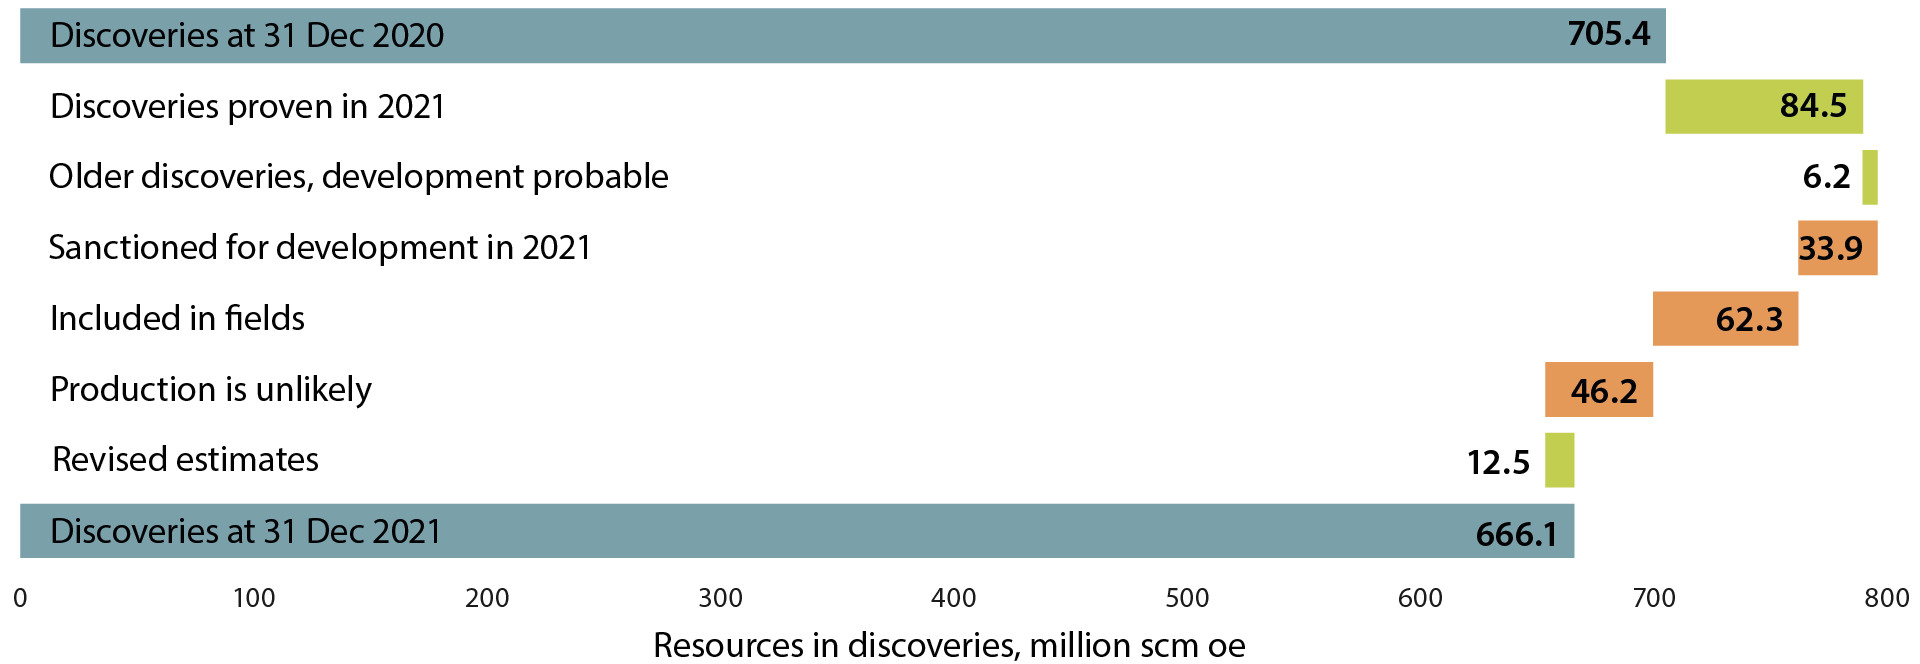
Figure 2-6 Overview of resource development in the discovery portfolio through 2021; categories in green show contributions to growth and categories in red show contributions to a reduction in resources awaiting a development decision
In addition to changes associated with new discoveries and new categorisation, the updates also cover updated estimates of what can be recovered from the various discoveries. This could be new studies of the subsurface, changes in concept for development solutions and conditions on the host installations. Of the 95 discoveries in the Accounts as per 31 Dec. 2020, 75 are also included in the 2021 Accounts. The estimate for recoverable resources in these discoveries has increased by 12.5 million scm oe.
Contingent resources in discoveries
There is a total of 359 million scm of liquids (oil, condensate and NGL) and 307 billion scm of gas in discoveries not yet developed, ref. Table 1-1. The total volume in discoveries has been reduced by 39 million scm oe compared with last year's Accounts. This reduction was mainly caused by resources maturing into reserves for several discoveries.
Many small and a few larger developments.
Figure 2-7 shows the discovery portfolio in the Resource Accounts by ocean area and size. A few major and several small discoveries were made in all areas, and the majority of discoveries are in the North Sea. The largest discovery is 7324/8-1 Wisting, which is located in the Barents Sea. In the Norwegian Sea, 6406/9-1 Linnorm is the largest, while 30/11-8 S Krafla is the largest in the North Sea.
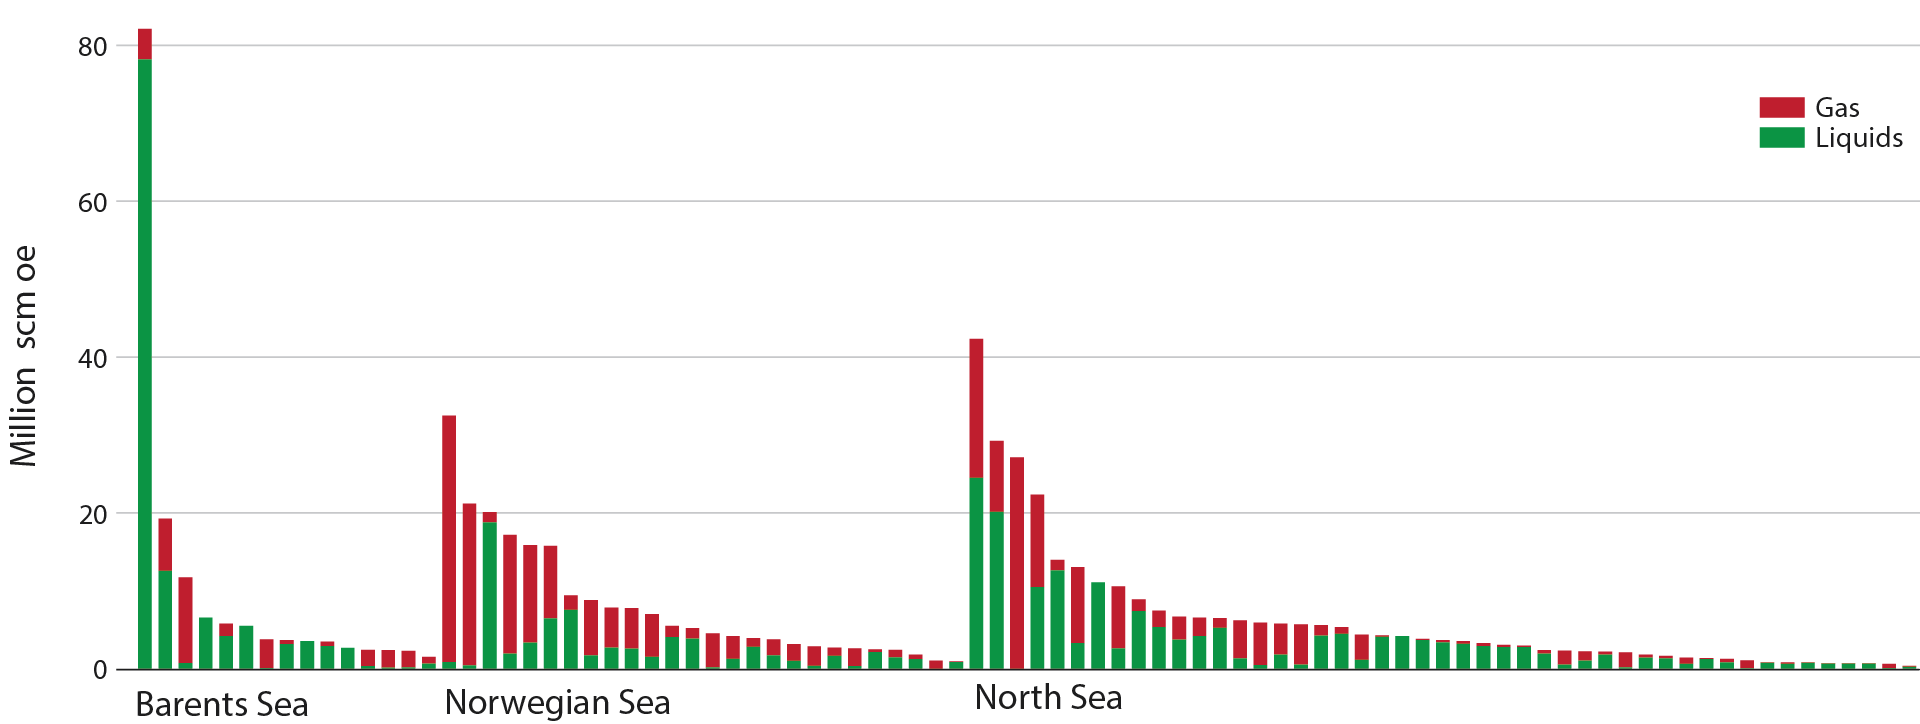
Figure 2-7 Discovery portfolio in the Resource Accounts
Both new and old facilities are important for the development of resources on the Norwegian shelf. A number of newer fields are tied into the existing infrastructure. As is evident from Figure 2-8, there are plans for several more tie-ins. New infrastructure is important for the development of resources in the area where it is established. This will allow for the tie-in of future discoveries, in addition to older discoveries that currently are not profitable for development.
A development with tie-in to existing fields or other major development projects is planned for 83 of the 88 discoveries in the figure. Several of the current discoveries are very likely to have joint solutions or be incorporated into fields before a development decision is made.
The most common development solution is subsea developments. This is the most likely concept for 64 of the discoveries. Another possible solution for smaller discoveries close enough to infrastructure is to use vacant well slots on existing fields. Such a solution has been reported for 18 discoveries.
The term production facilities is used here for platforms with separation and process equipment. Such facilities are the likely concept for five of the discoveries. They are used in areas which lack access to sufficient capacity in existing infrastructure or areas with vast distances. In order to invest in such facilities, the resource volumes must be relatively large, also through coordinated development of multiple smaller discoveries.
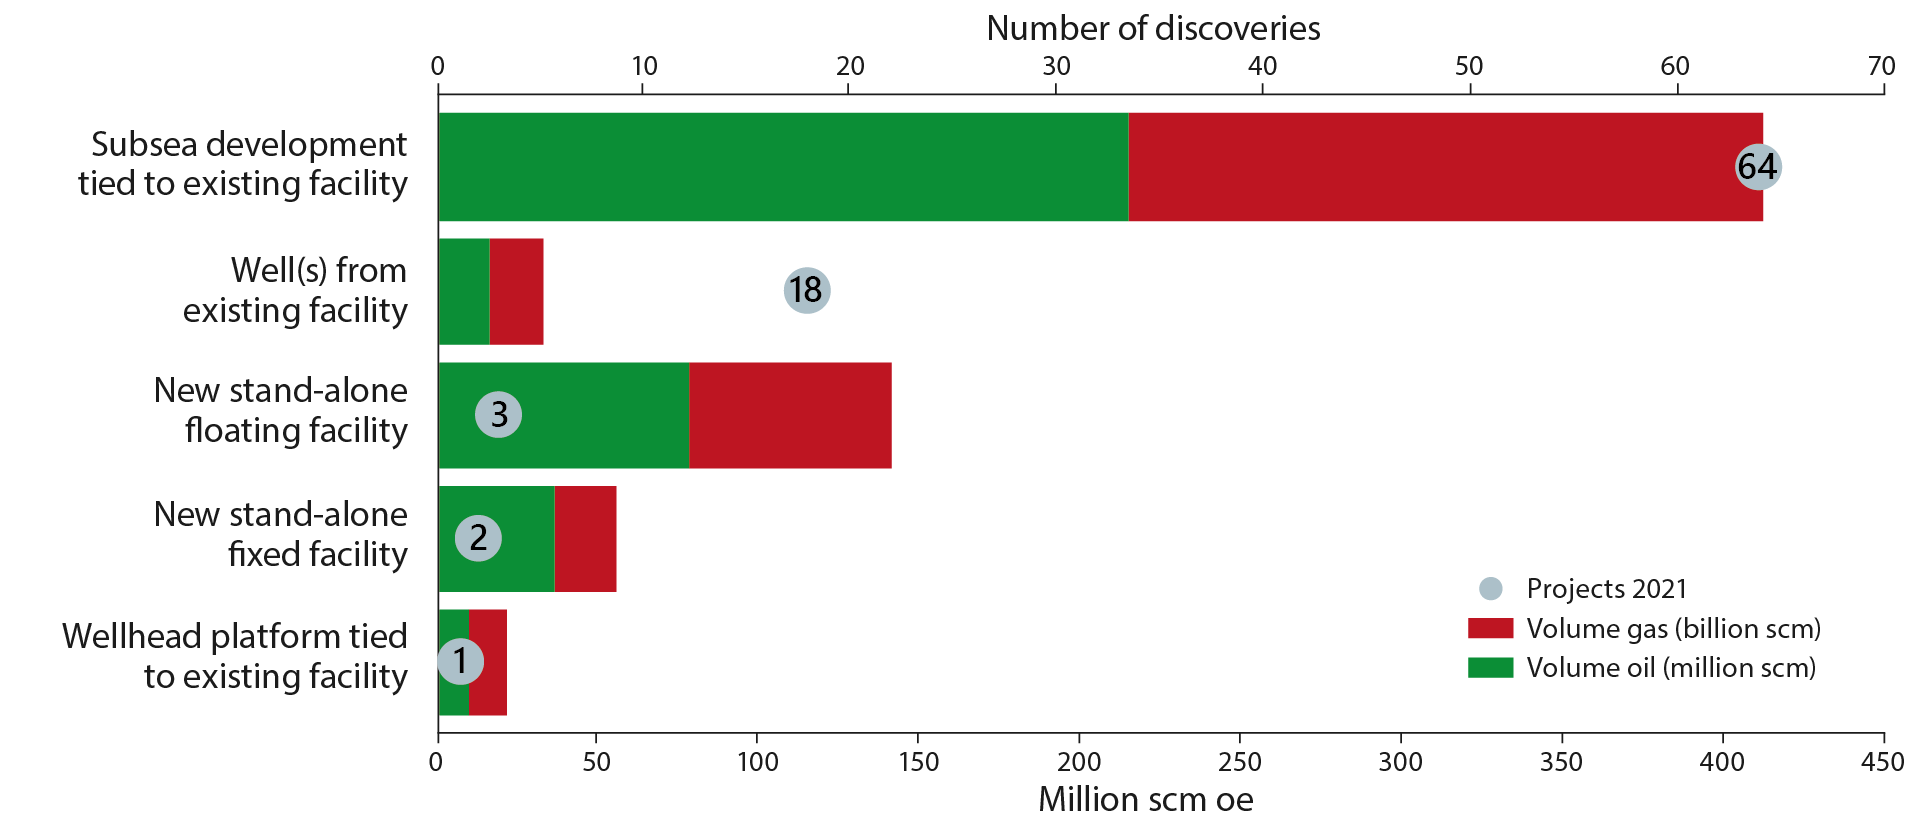
Figure 2-8 Likely development solutions for the 88 discoveries in this year's Resource Accounts, as well as overall resources per development solution
Uncertainty – discoveries
The range of uncertainty is shown in the figure below. The uncertainty is greater for resources in discoveries than in fields, since there is frequently less data available before a discovery is developed and becomes a field. There are many reasons for this, including less data on the size of the discovery and the possible technological solution.
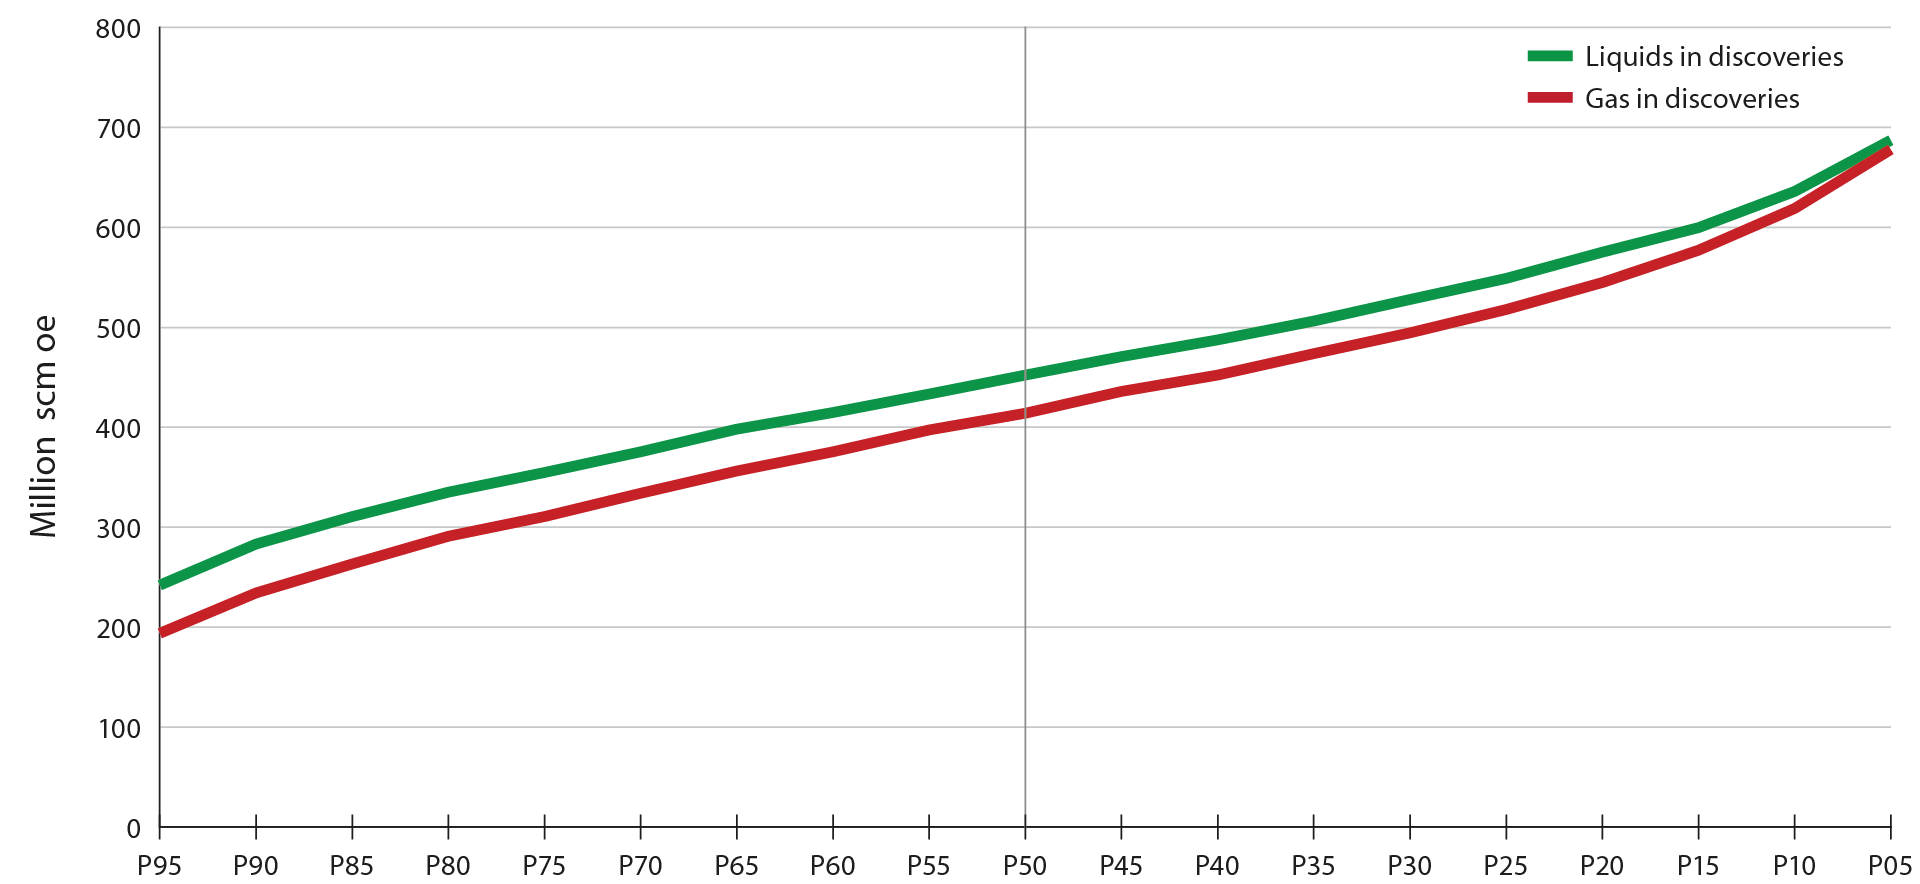
Figure 2-9 Uncertainty in resources in discoveries (liquids and gas)
Remaining proven resources
The figure below shows the change in remaining proven resources from 2020 to 2021. An increase in gross reserves and a minor increase in contingent resources in fields mean that the estimate for overall discovered resources has been reduced by just over 100 million scm oe, despite high production.
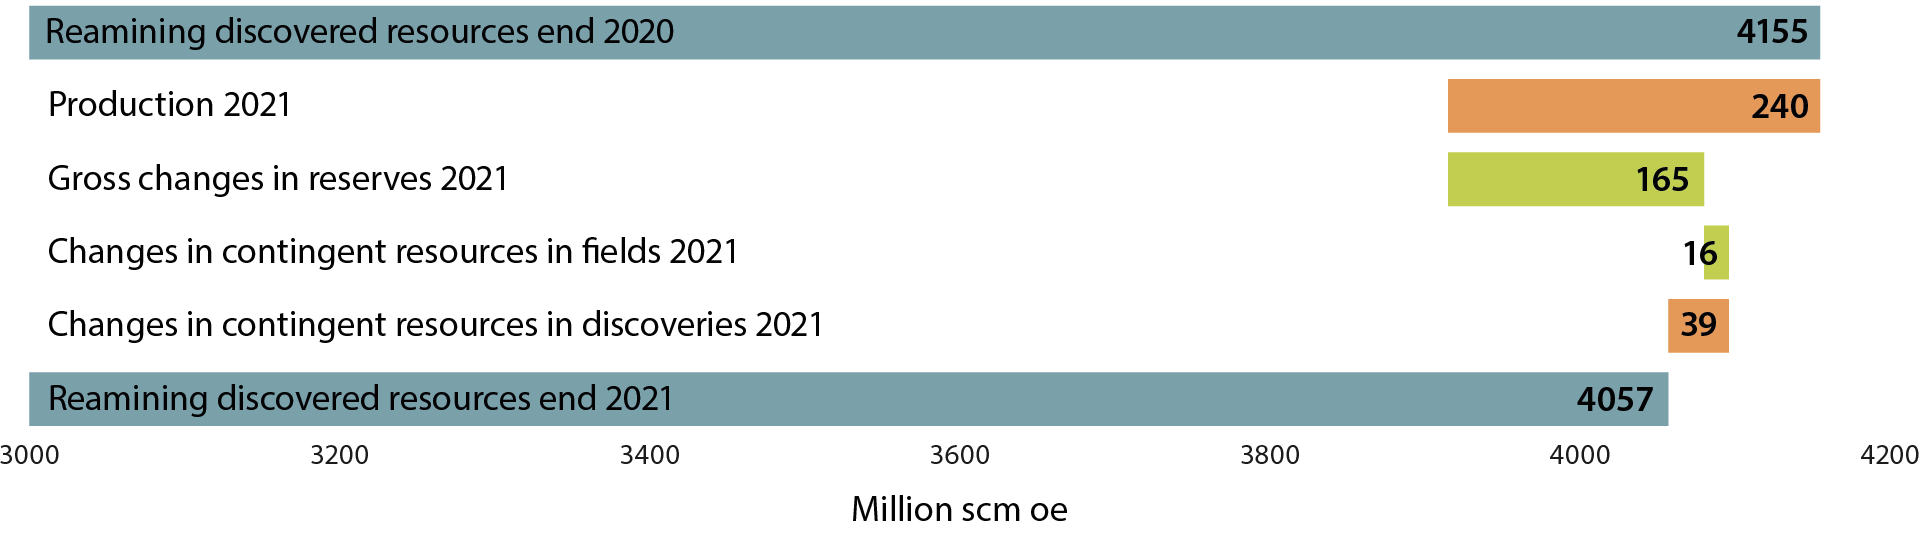
Figure 2-10 Overview of the change in proven resources from 2020 to 2021