2 – Exploration trends on the NCS
Good availability of acreage, substantial cost reductions, access to infrastructure and better data coverage have contributed to the drilling of many exploration wells.
A lot of new discoveries have been made, most of them relatively small. Much remains to be found in both well explored and less investigated areas.
A big potential for exploration success is offered by the combination of greater knowledge, new seismic survey technology and innovative methods for analysing large data volumes. Successful exploration is a critical factor for future production and value creation.
A proud history
Big discoveries
The 50th anniversary of the Ekofisk discovery at the southern end of Norway’s North Sea sector was celebrated in 2019. When officially inaugurating production from the field in 1971, just two years later, then prime minister Trygve Bratteli made his celebrated comment that “This could be a red-letter day in Norway’s economic history”.
Finding Ekofisk sparked great interest in exploring the NCS and several substantial discoveries were made over the next 20 years, such as Statfjord, Gullfaks, Oseberg and not least Troll (figure 2.1). These fields have formed the backbone in developing Norway as a petroleum nation, both economically and technologically. Discoveries in recent years have been substantially smaller. Nevertheless, large discoveries such as Johan Sverdrup, 7324/8-1 (Wisting) and Johan Castberg are still being made.
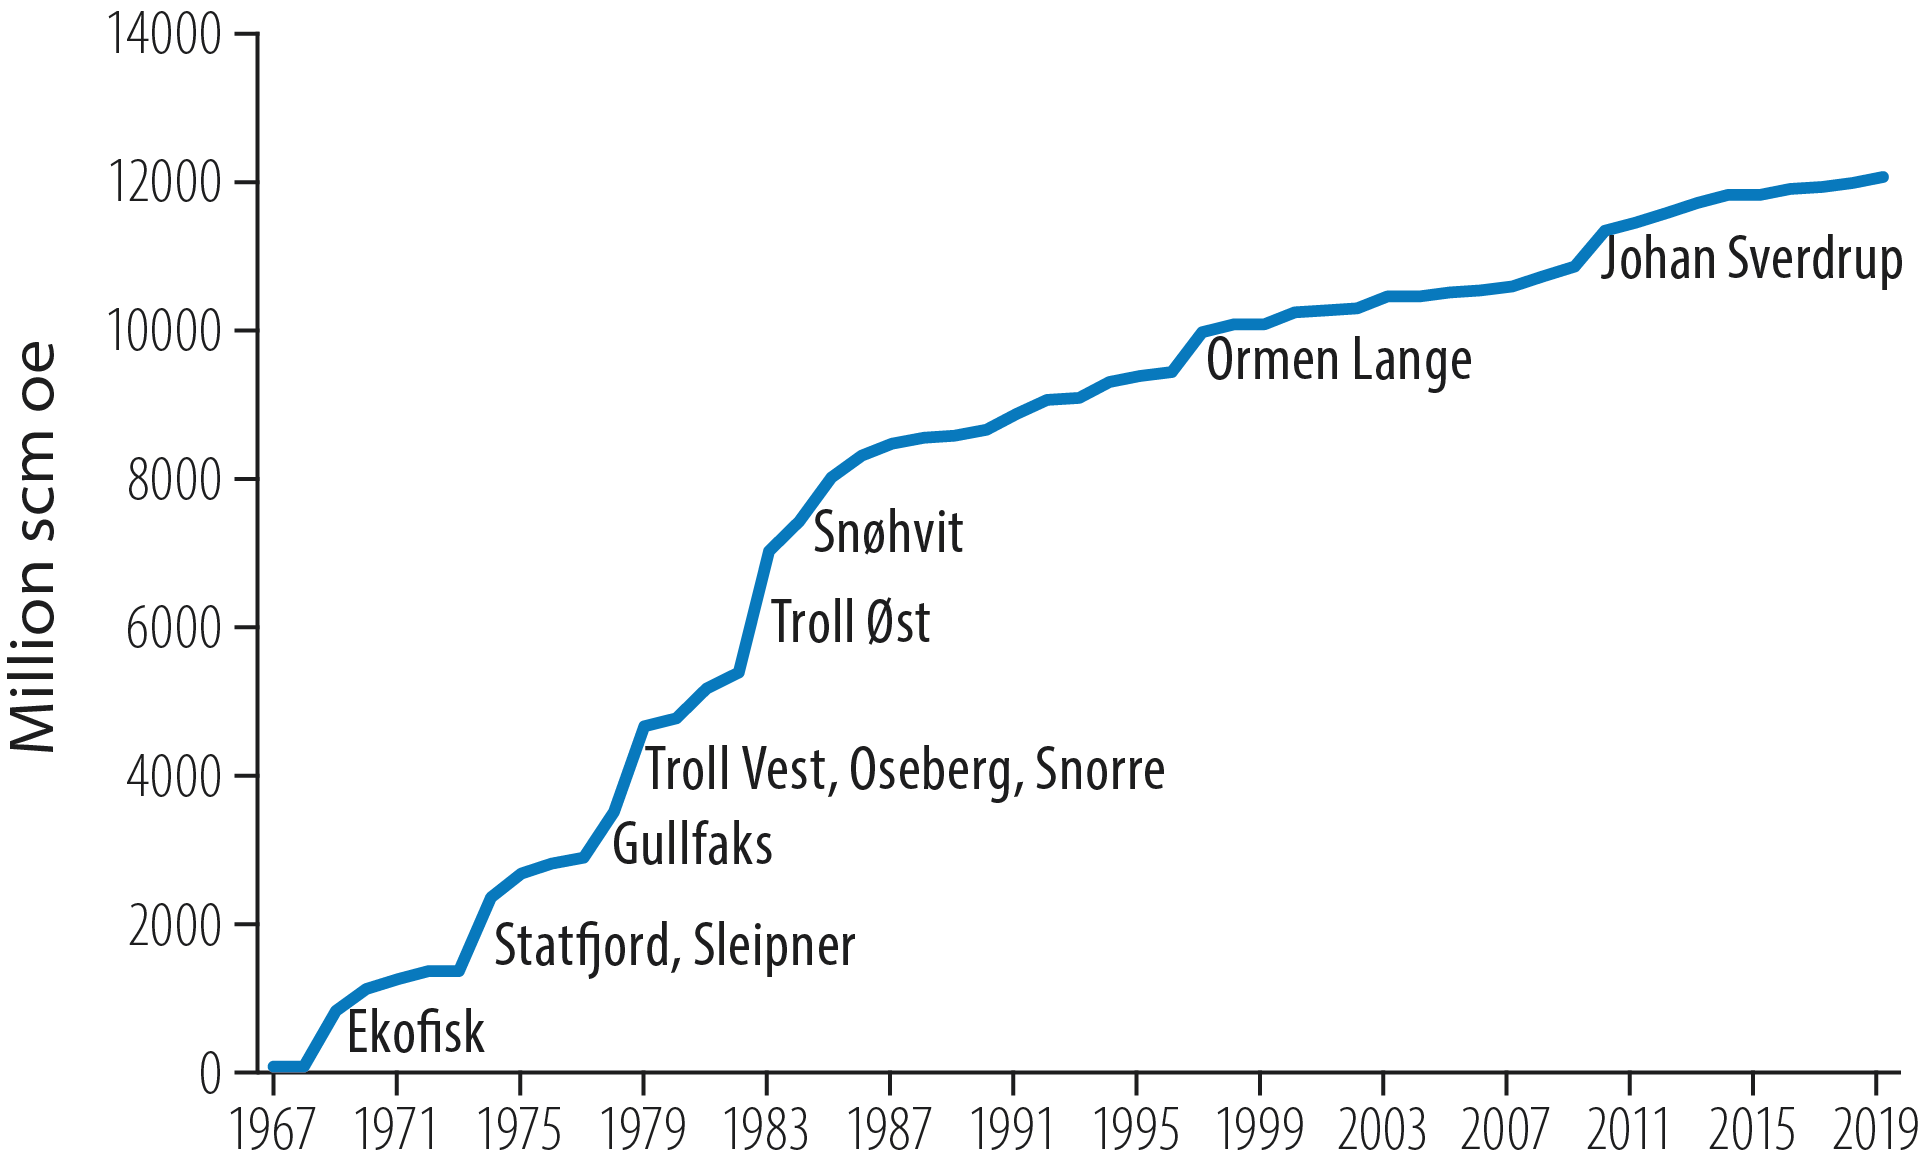
Figure 2.1 Resource growth on the NCS
A total of 1 714 exploration and 4 800 production wells had been completed on the NCS up to 31 December 2019, with 113 fields brought on stream. Twenty-six of the latter have ceased production. Eight onshore plants have also been built. New technology has been developed and adopted to meet the challenges faced as the most easily accessible resources are produced, and to comply with ever-stricter environmental and safety standards for prudent operations.
Developments have moved from large steel and concrete platforms with processing facilities, permanent personnel and many support functions to solutions based on subsea installations where processing and support are provided from existing facilities or from shore. The extensive infrastructure of field installations, pipelines and land plants has reduced the cost of developing smaller discoveries and increased interest in exploring for minor petroleum accumulations. Such re-use of infrastructure contributes to greater value creation and efficient resource utilisation, and makes small discoveries profitable.
The government has played an active role in developing Norway’s petroleum and supplier industries. A gradual build-up has characterised the strategy for resource management and industrial development. Where exploration is concerned, the main rule has been step-by-step progress. This principle means that drilling results should be available for an area before further blocks are offered there. New information will contribute to more effective exploration and fewer dry wells.
Successful exploration is a critical factor
for future production and value creation
Substantial value
Norway’s Petroleum Act specifies that the petroleum resources belong to the Norwegian people and must benefit the whole country. Oil and gas production has long been the country’s biggest provider of value creation, government revenues, investment and exports.
This industry has contributed substantially to making Norway a wealthy nation today. At the beginning of its Oil Age, the country’s gross domestic product (GDP) per capita was relatively low compared with many western countries, such as the USA, Sweden and Germany [1] (figure 2.2). Over subsequent decades, growing petroleum output raised the level of Norwegian incomes. When production peaked in the early 2000s, rising petroleum prices drove incomes even higher.
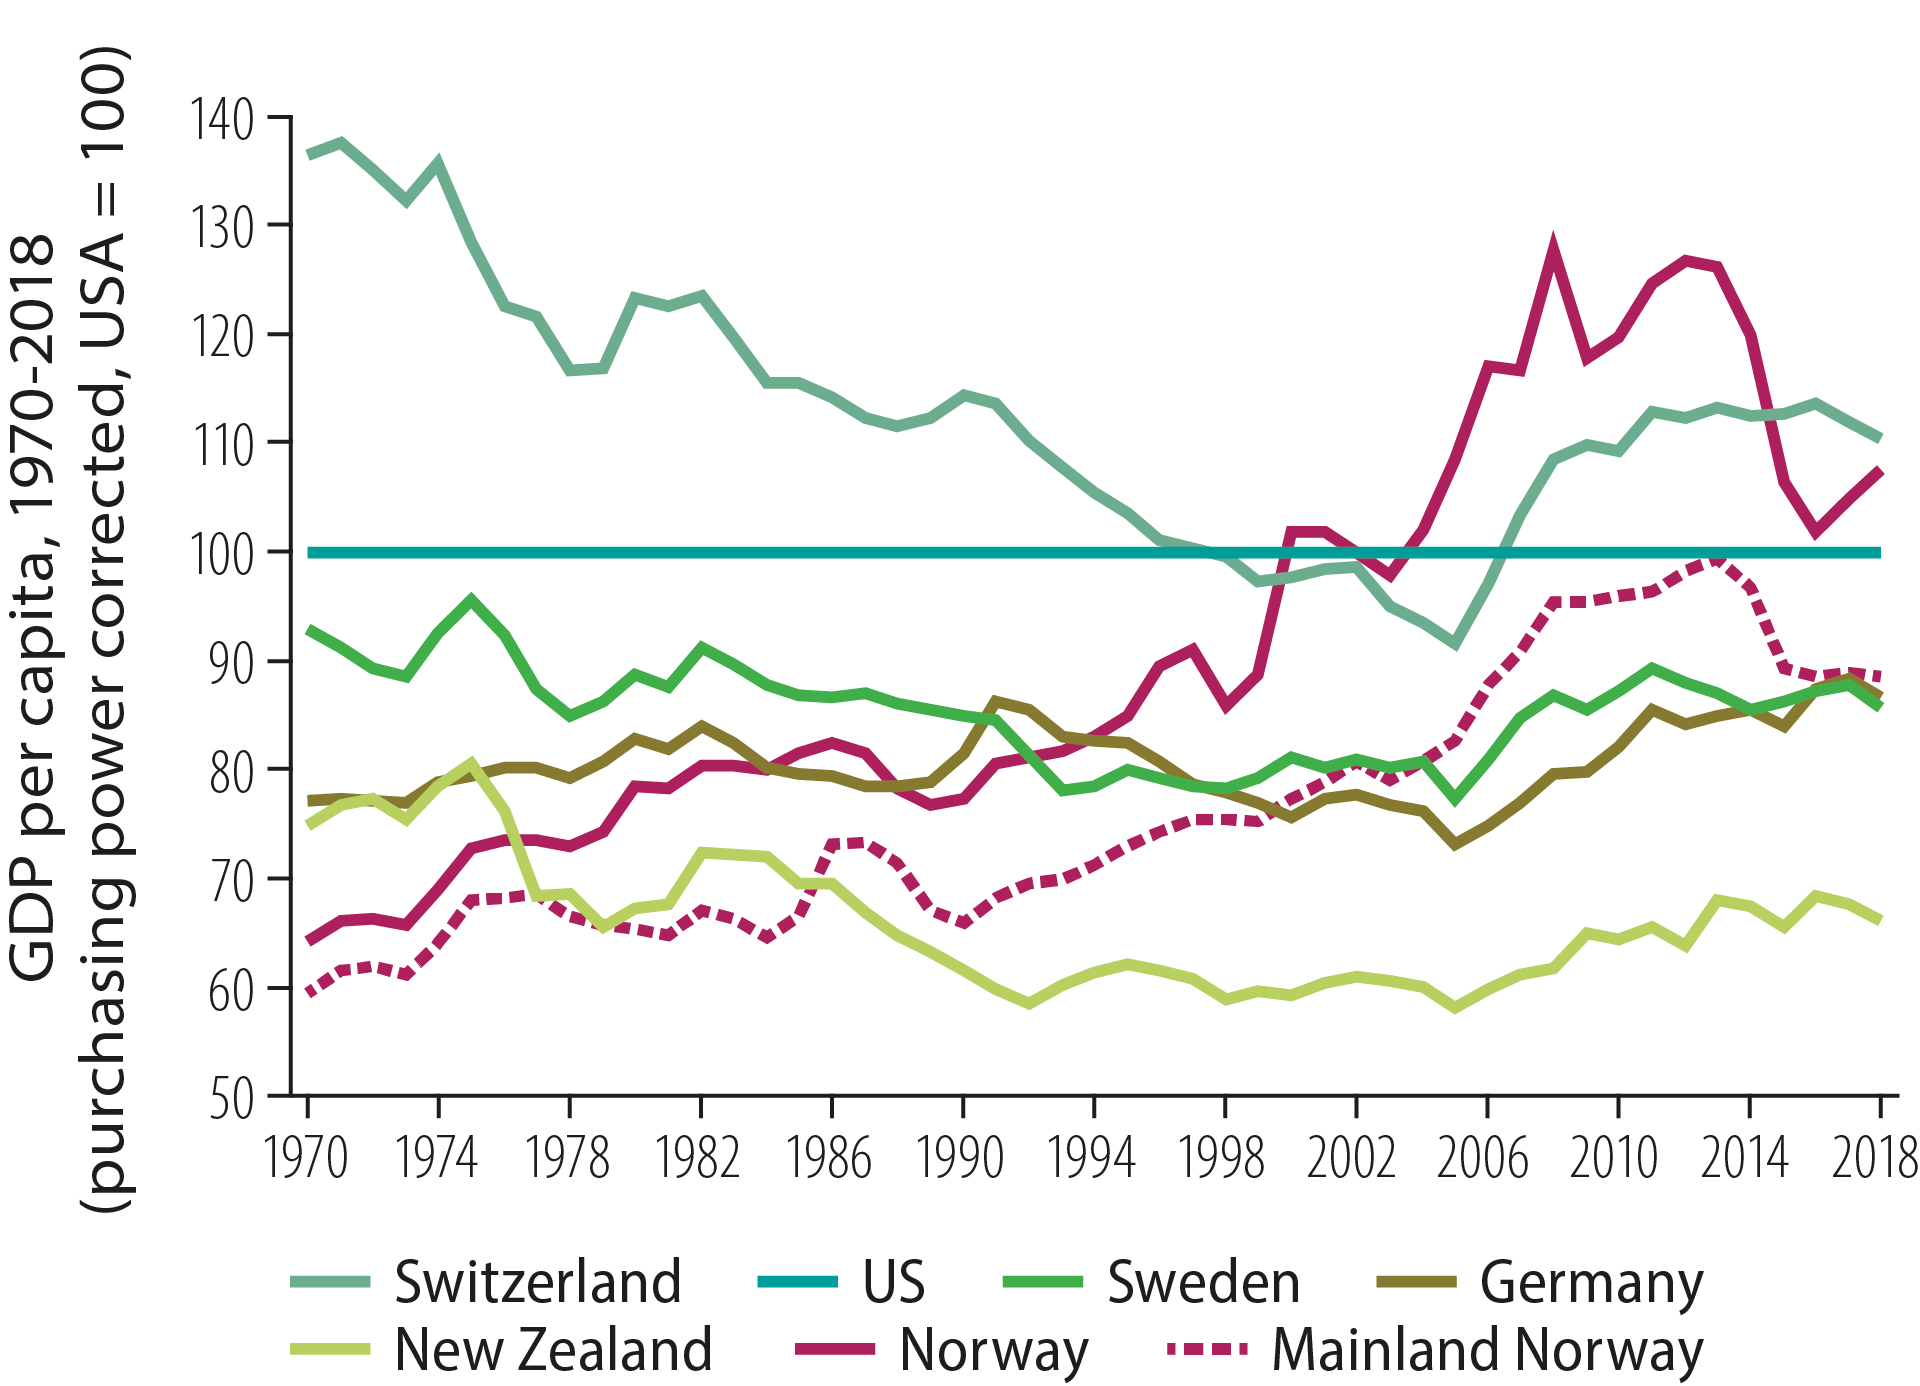
Figure 2.2 GDP per capita, 1970-2018. Sources: Norges Bank, OECD and Statistics Norway.
Activities on the NCS have had spin-offs for other industrial sectors. A growing number of companies – not just in the engineering industry – have turned their attention to deliveries for the oil business. New products and technological solutions have been developed. Many firms have found assignments on the NCS to be a springboard into new export markets. Petroleum activities have also contributed to substantial productivity improvements in adjacent industries because oil-related knowledge and technology rubs off on them.
The petroleum sector accounted in 2019 for about 13 per cent of all value creation in Norway and roughly 36 per cent of Norwegian export earnings (figure 2.3). Total net cash flow to the government from the petroleum industry is estimated at NOK 87 billion in 2020, down by about NOK 170 billion from 2019. Most of these revenues are placed in the oil fund (the Government Pension Fund Global), which had a market value of more than NOK 10 000 billion in October 2020.
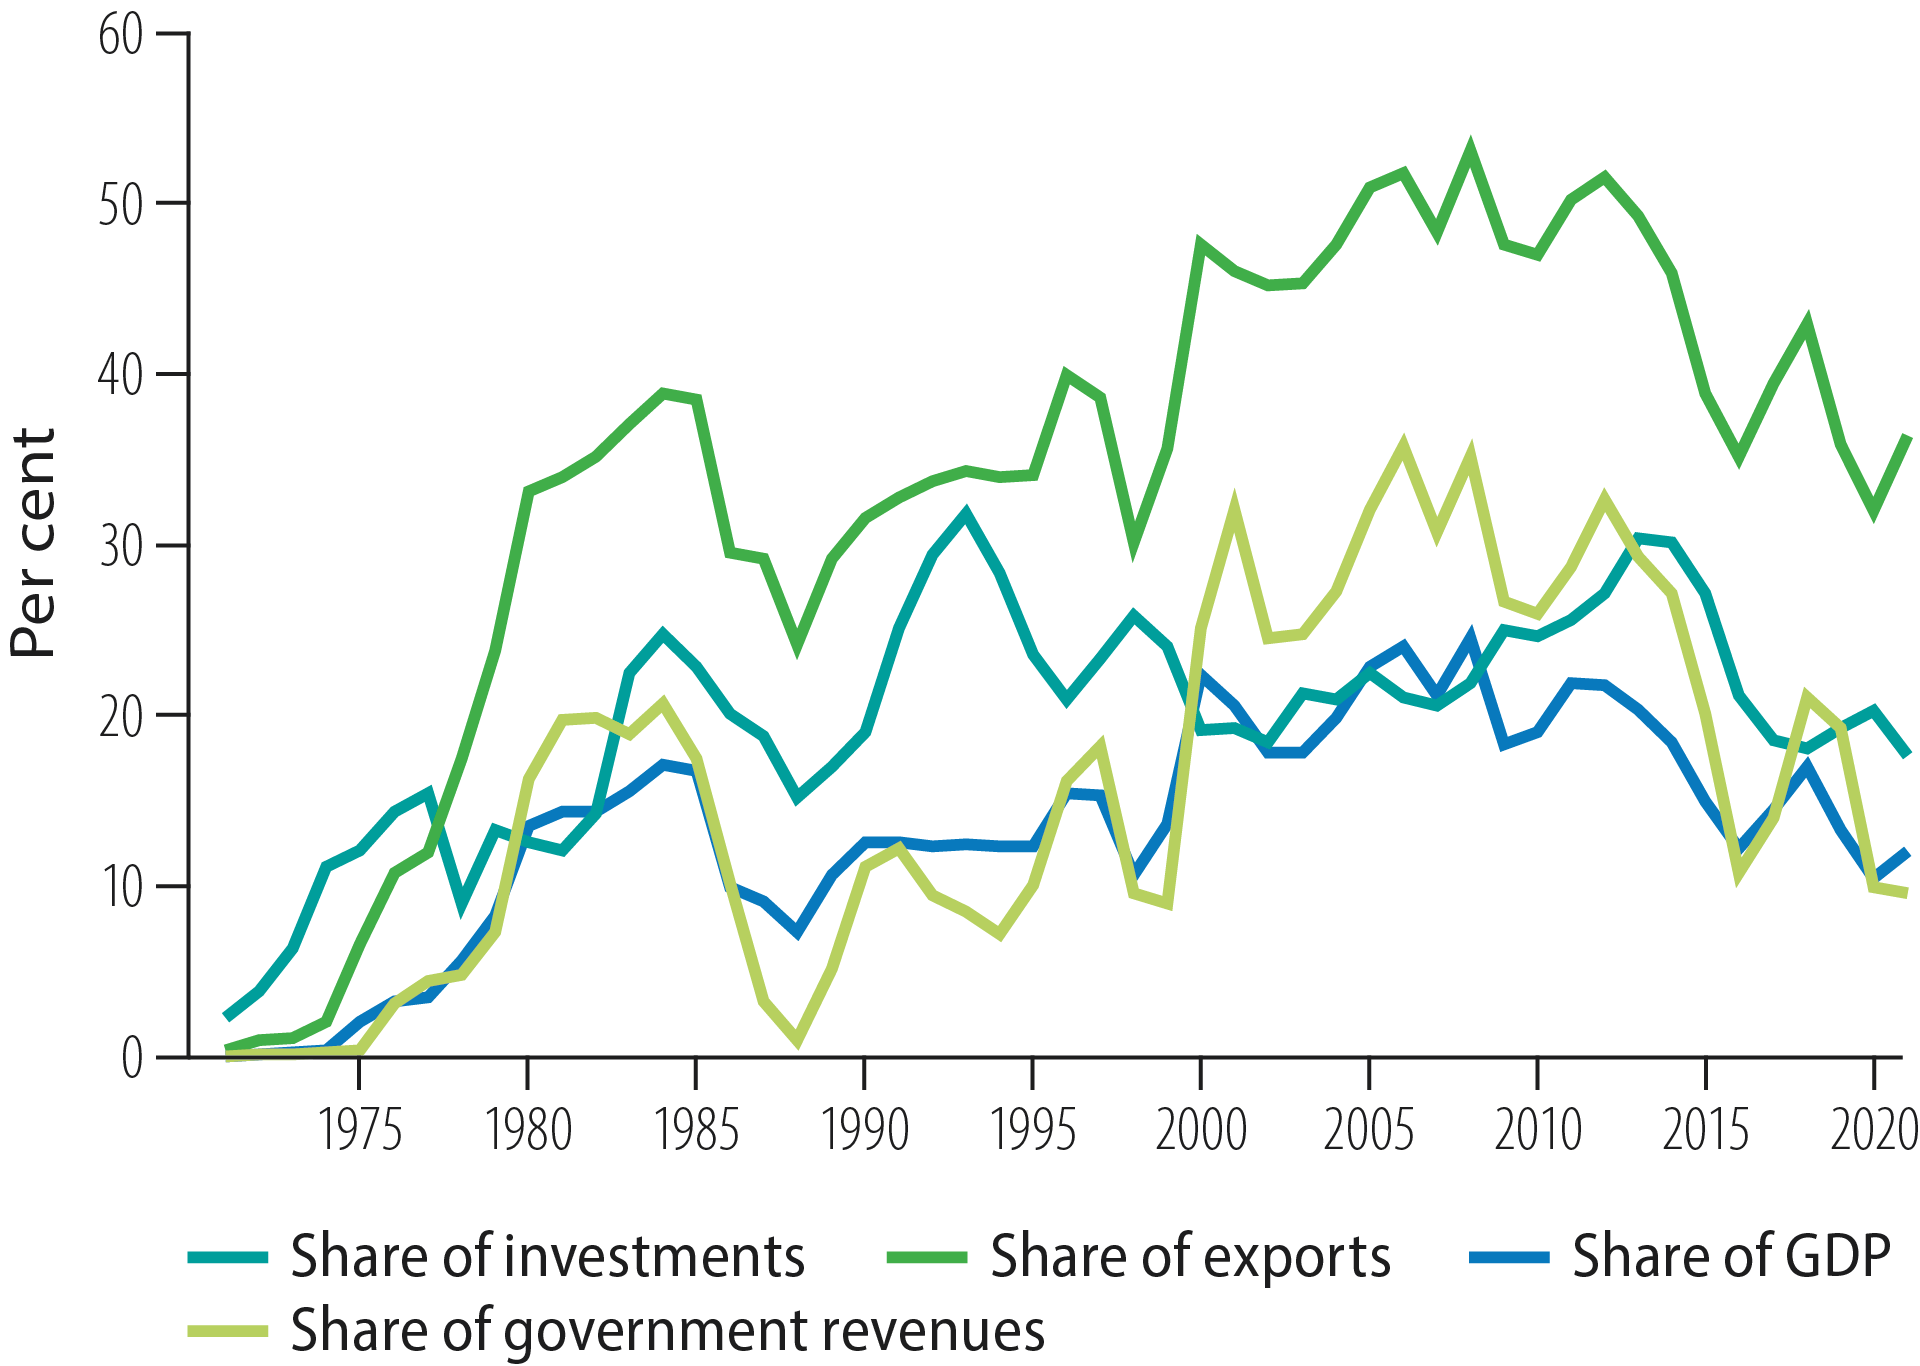
Figure 2.3 Macroeconomic indicators for the oil industry, 1971-2020. Source: norskpetroleum.no (updated October 2020).
Even small developments on the NCS would have ranked as substantial industrial projects if they were pursued onshore. A report from Menon Economics [2] for the Ministry of Petroleum and Energy (MPE) shows that about 225 000 people were employed directly or indirectly by the Norwegian petroleum sector in 2017. Value creation per direct petroleum-sector employee in 2019 was about NOK 19 million, compared with roughly NOK 1 million per employee in the mainland economy overall [3].
High activity level – declining resource growth
Exploration activity has been high in the recent past and, until the coronavirus pandemic began in the spring of 2020, was expected to remain relatively stable at a strong level for the next few years. Measures implemented to reduce the spread of the virus have contributed to reduced demand for petroleum and a fall in oil prices. In the exploration sector, short-term conditions are expected to lead to fewer exploration wells being drilled and fewer seismic surveying assignments.
Historical figures illustrate how oil prices affect drilling, with a clear relationship between (nominal) oil prices and the number of exploration wells (figure 2.1).
Activity increased sharply after 2006. In addition to higher oil prices, changes made to the regulatory framework in 2003-05 were important for the growth in exploration drilling (fact box 2.1).
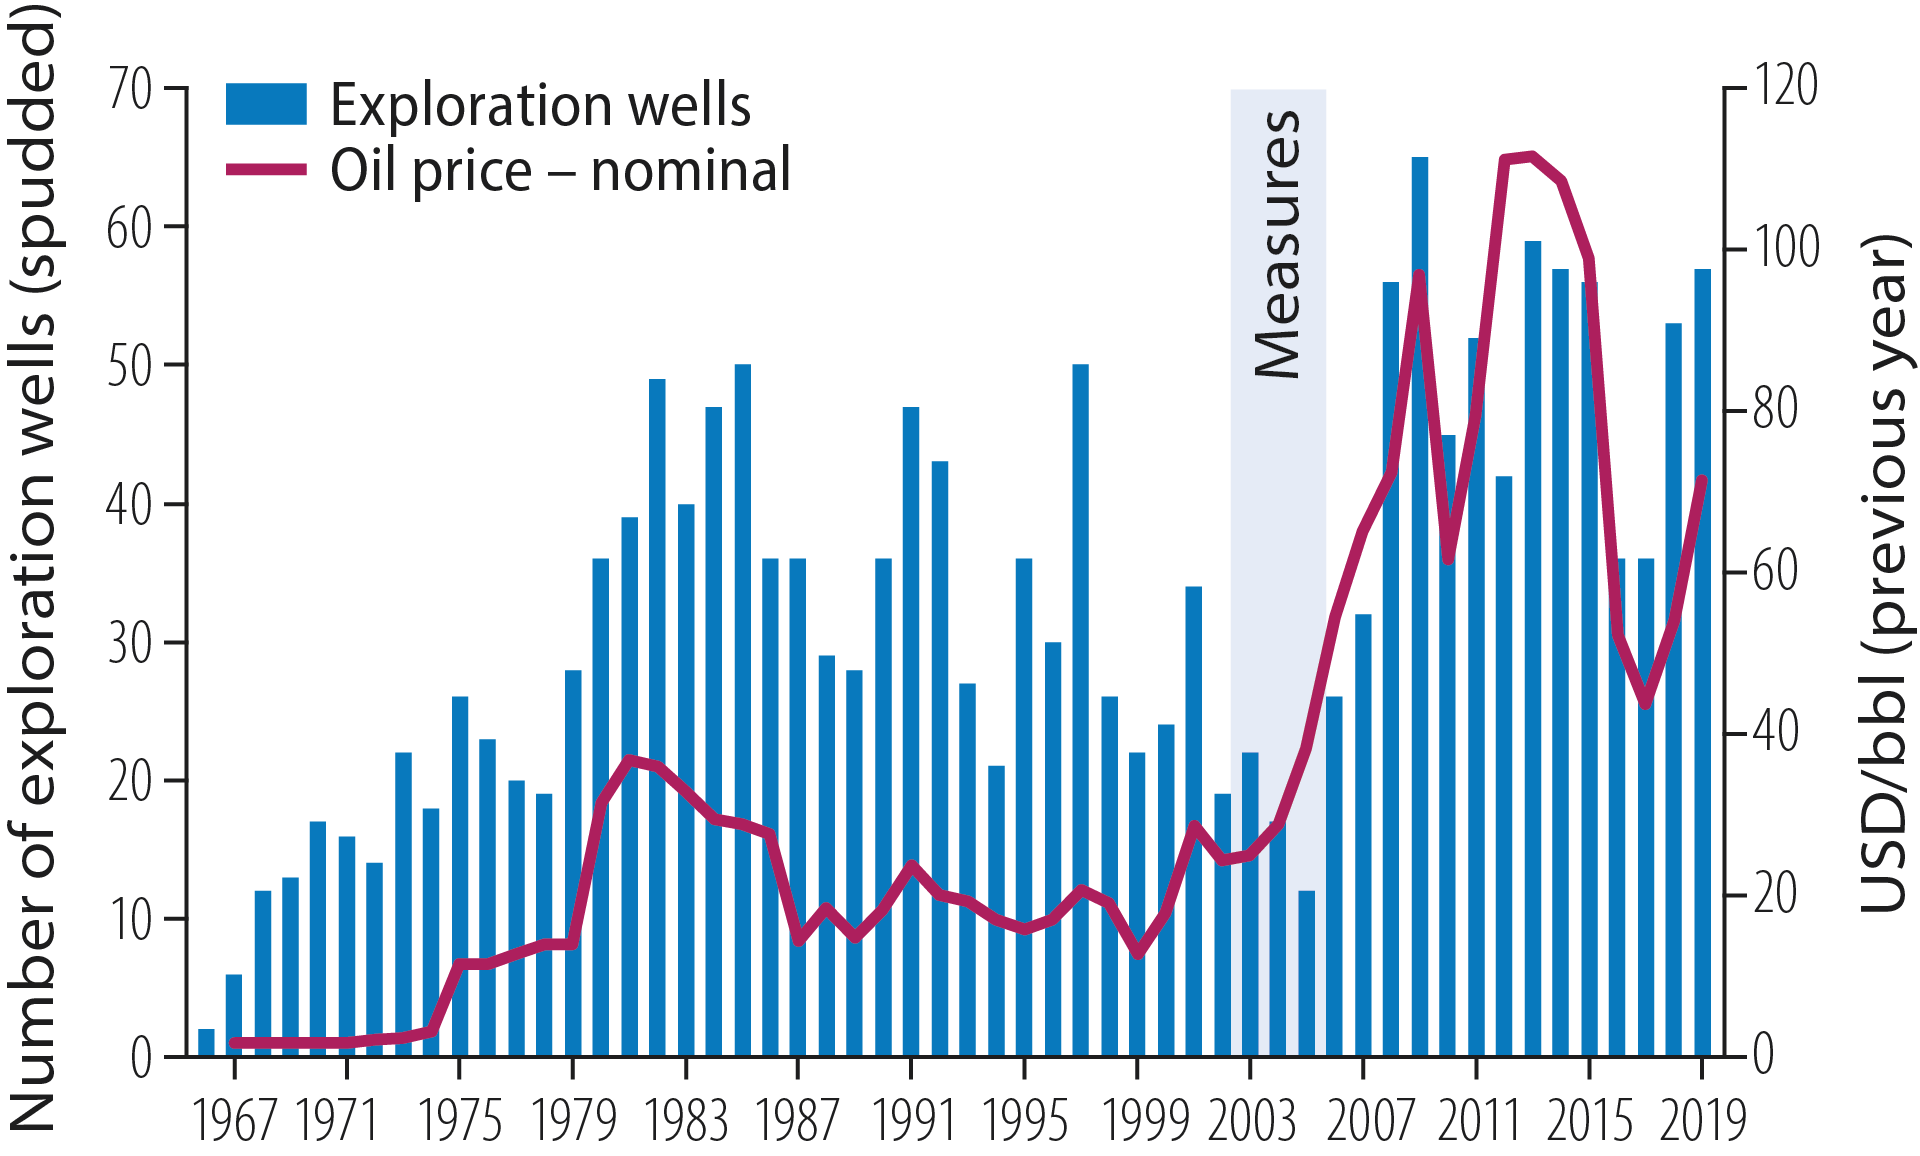
Figure 2.4 Historical development of oil prices and exploration wells.
Exploration picked up after oil prices rose in 2017. Fifty-three exploration wells were spudded in 2018, 17 more than the year before, including 31 in the North Sea, 15 in the Norwegian Sea and seven in the Barents Sea (figure 2.5). Of the 53, 28 were wildcats and 25 were for appraisal.
In 2019, 57 wells were spudded – 37 in the North Sea, 15 in the Norwegian Sea and five in the Barents Sea (figure 2.5). Of these, 43 were wildcats and 14 were for appraisal.
Fact box 2.1 Measures to increase exploration
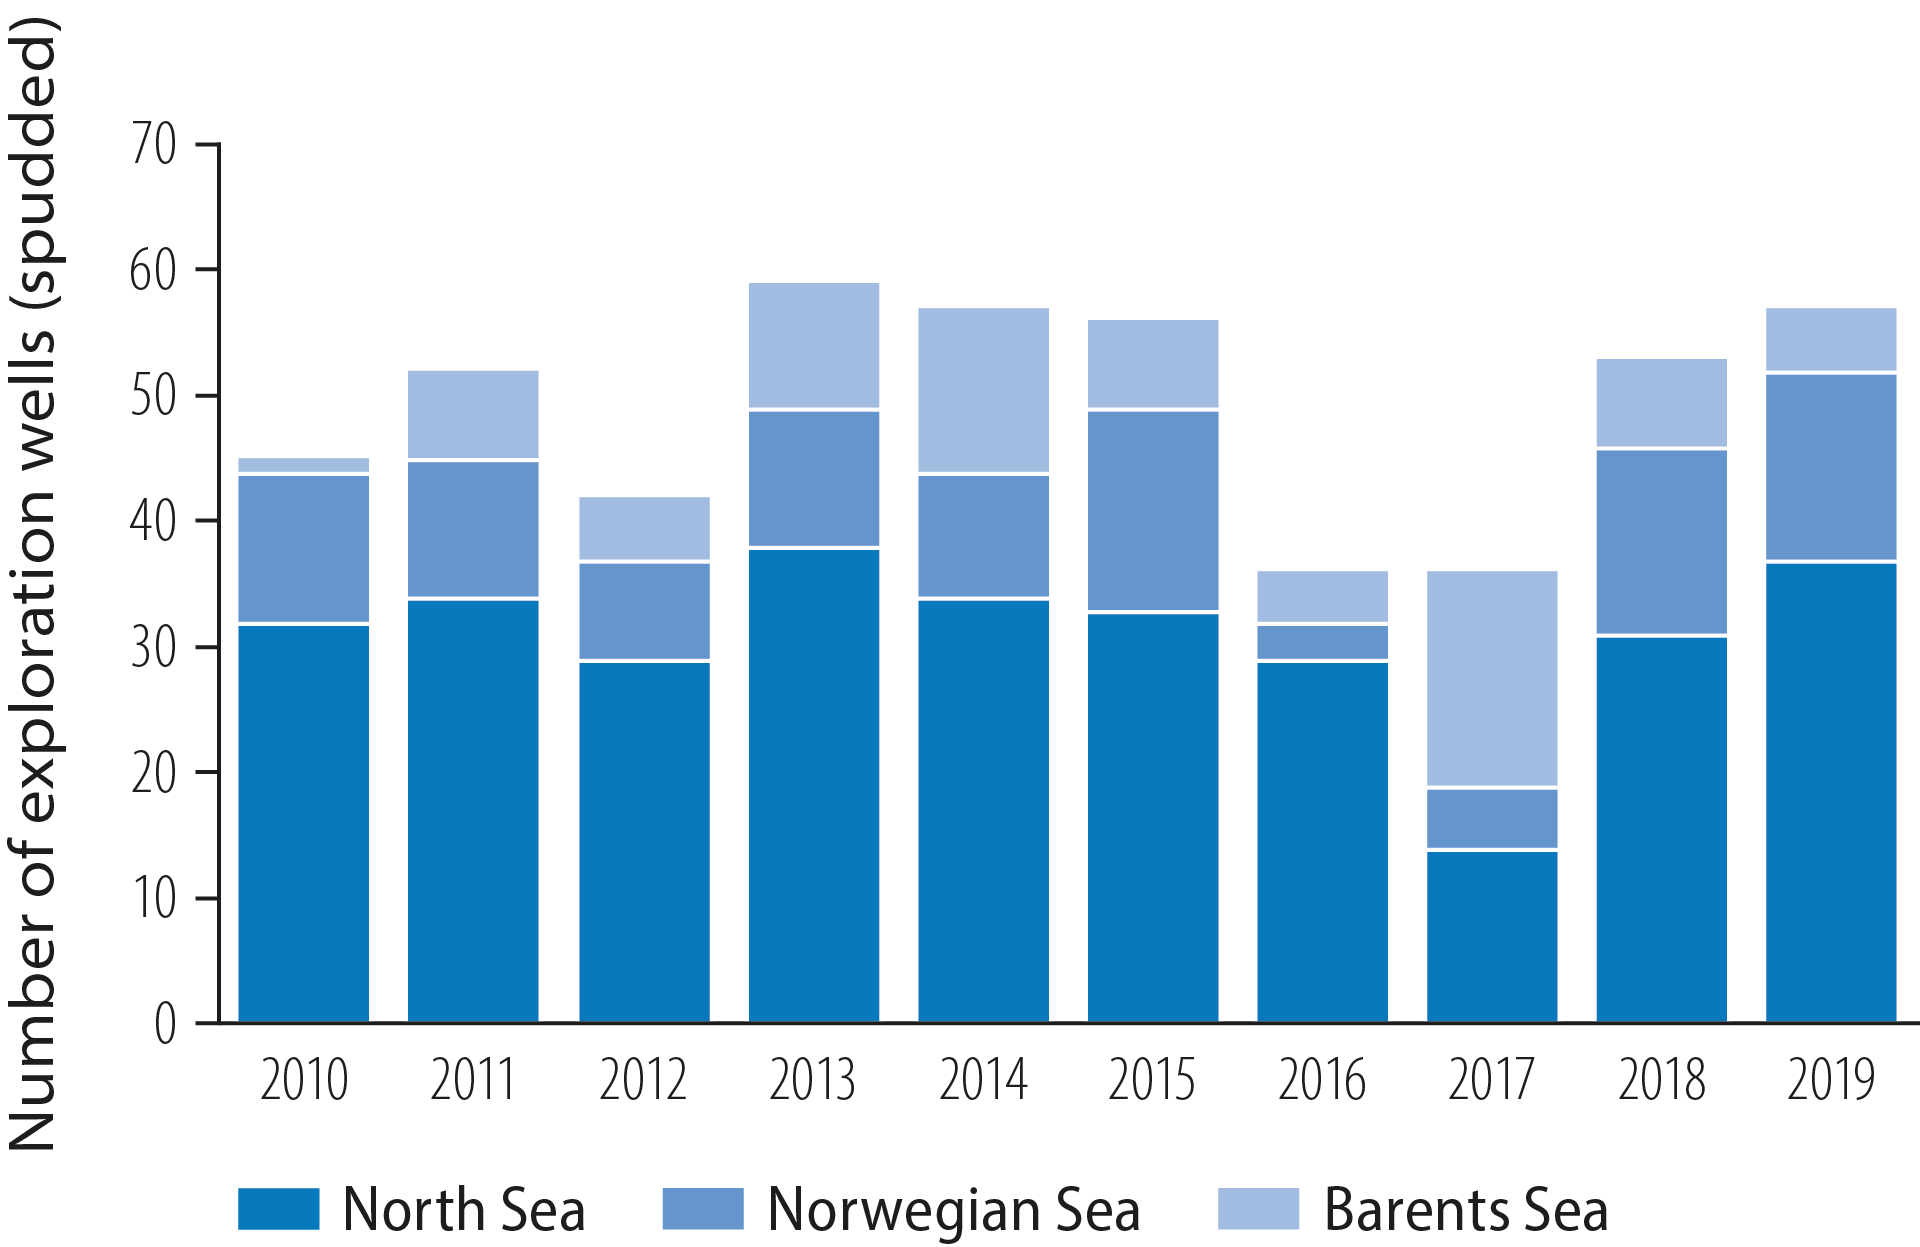
Figure 2.5 Exploration wells spudded by region, 2010-19
Most wells in recent years have been drilled close to existing infrastructure (figure 2.6). Spare capacity in these facilities can make it profitable to explore for and develop ever smaller discoveries. Along with lower costs and good earnings for the companies, this is an important reason why exploration activity has been high in recent years. A good supply of attractive exploration acreage, technological progress in seismic surveying and large volumes of new seismic data have also been important factors (fact box 2.2).
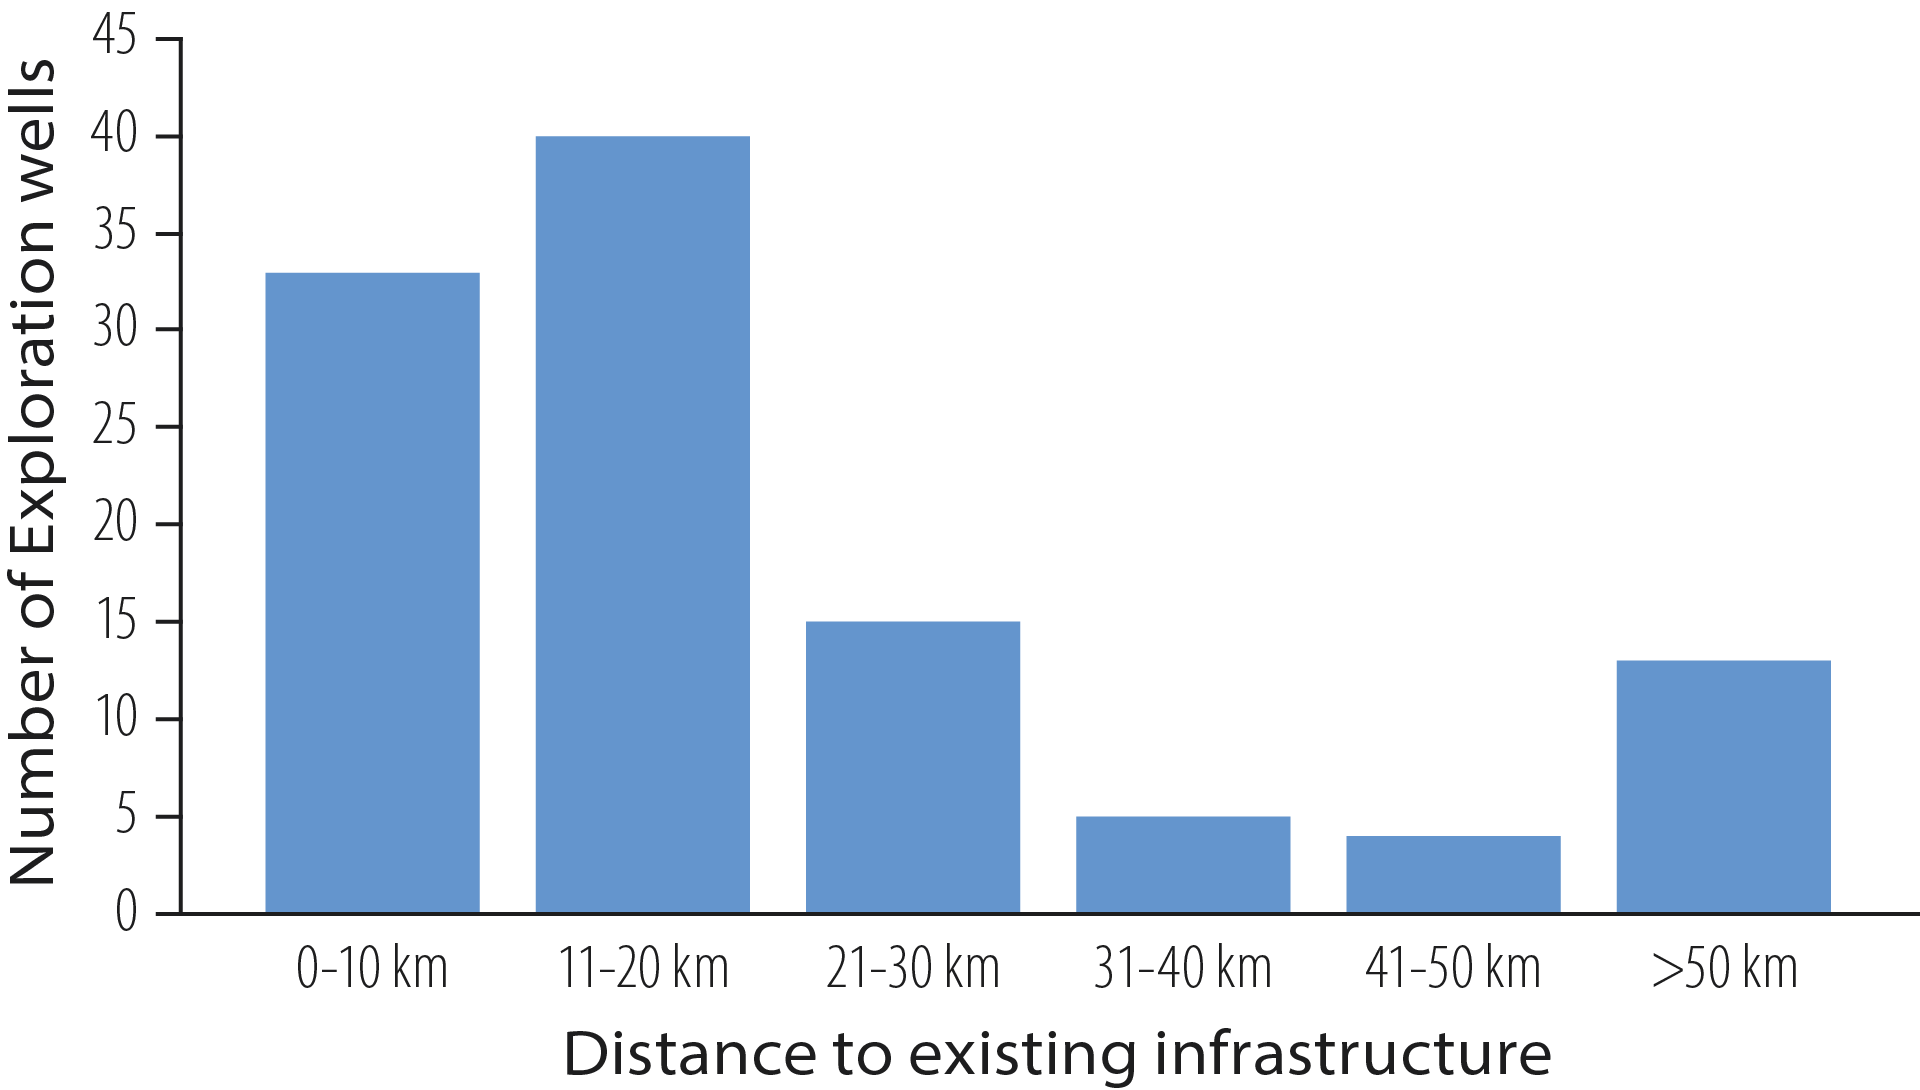
Figure 2.6 Exploration wells 2018-19 and closeness to infrastructure
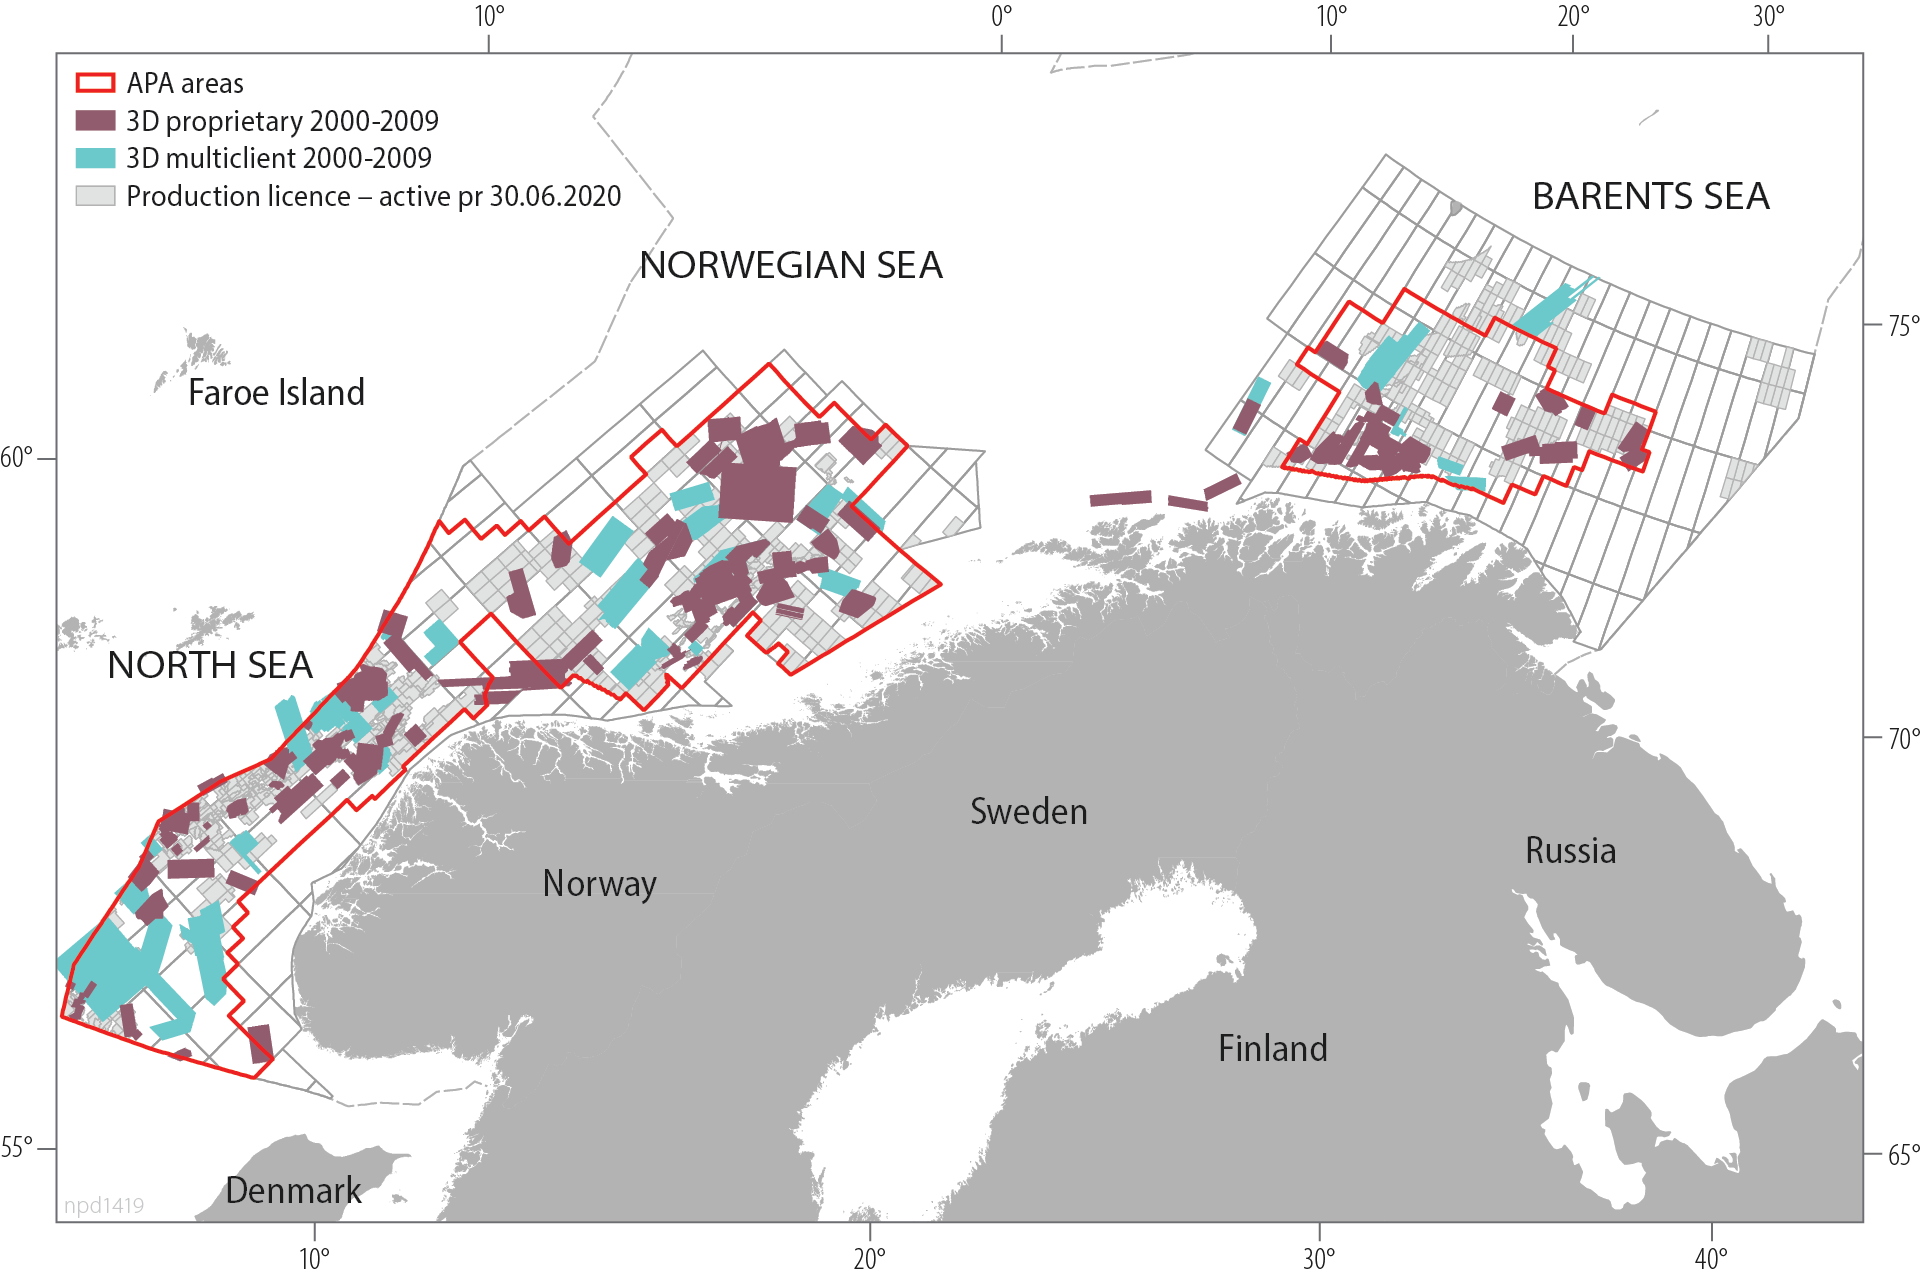
Figure 2.8 3D data acquisition by oil companies (proprietary) and survey companies (for sale or multi-client), 2000-09
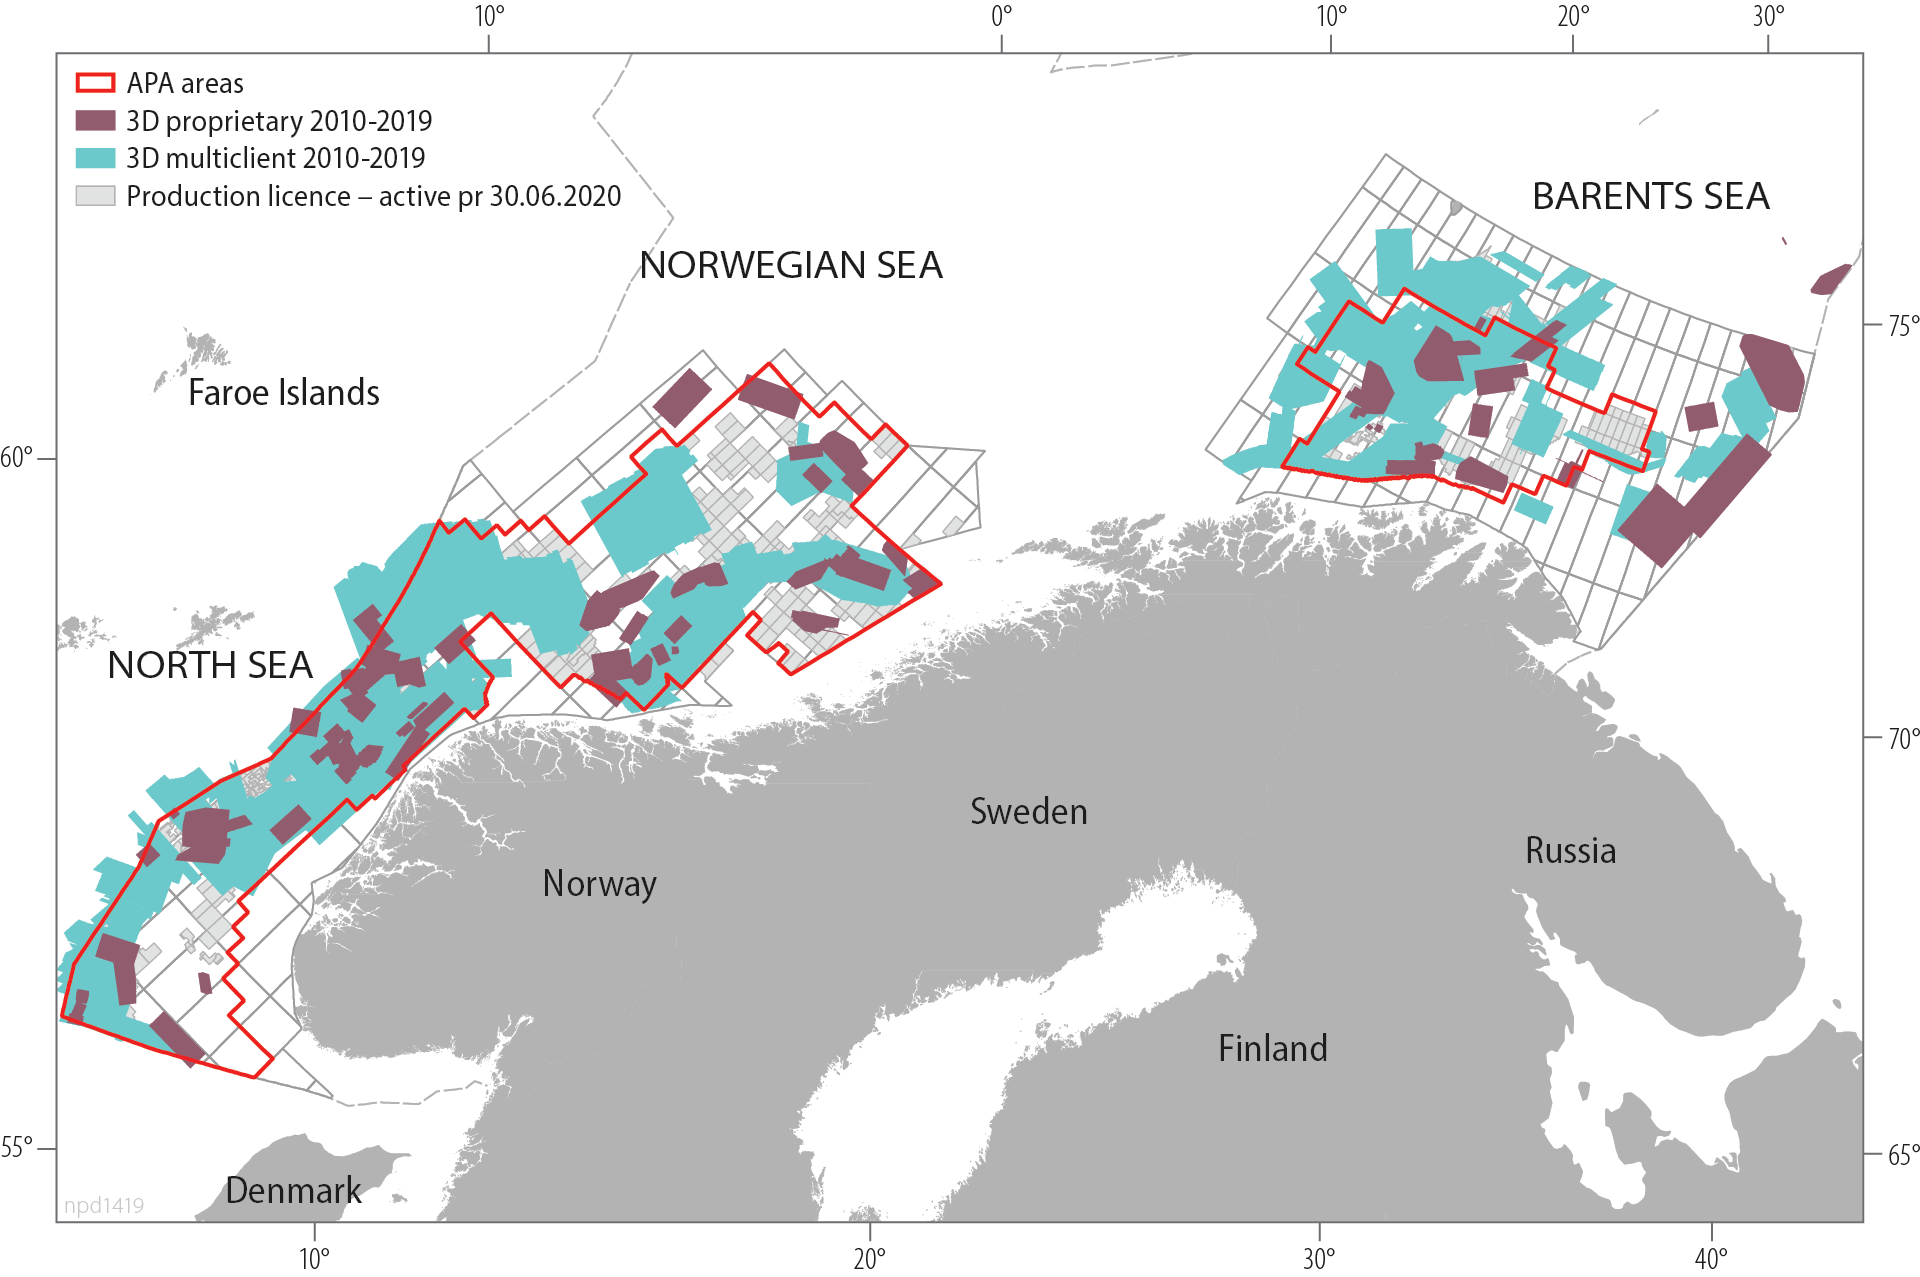
Figure 2.9 3D data acquisition by oil companies (proprietary) and survey companies (for sale or multi-client), 2010-19
Good supply of acreage from licensing rounds
A good supply of attractive acreage from licensing rounds is important for maintaining exploration and laying the basis for new discoveries. Since the restructuring of exploration policy in 2003-05, the number of production licences awarded has risen sharply (figure 2.10). A total of 151 licences were awarded in the annual APA rounds in 2019-20. These awards have been made to the whole spectrum of companies, from majors to small newcomers to the NCS. The many applications received show that interest in the NCS is high, and that it is competitive in the international market.
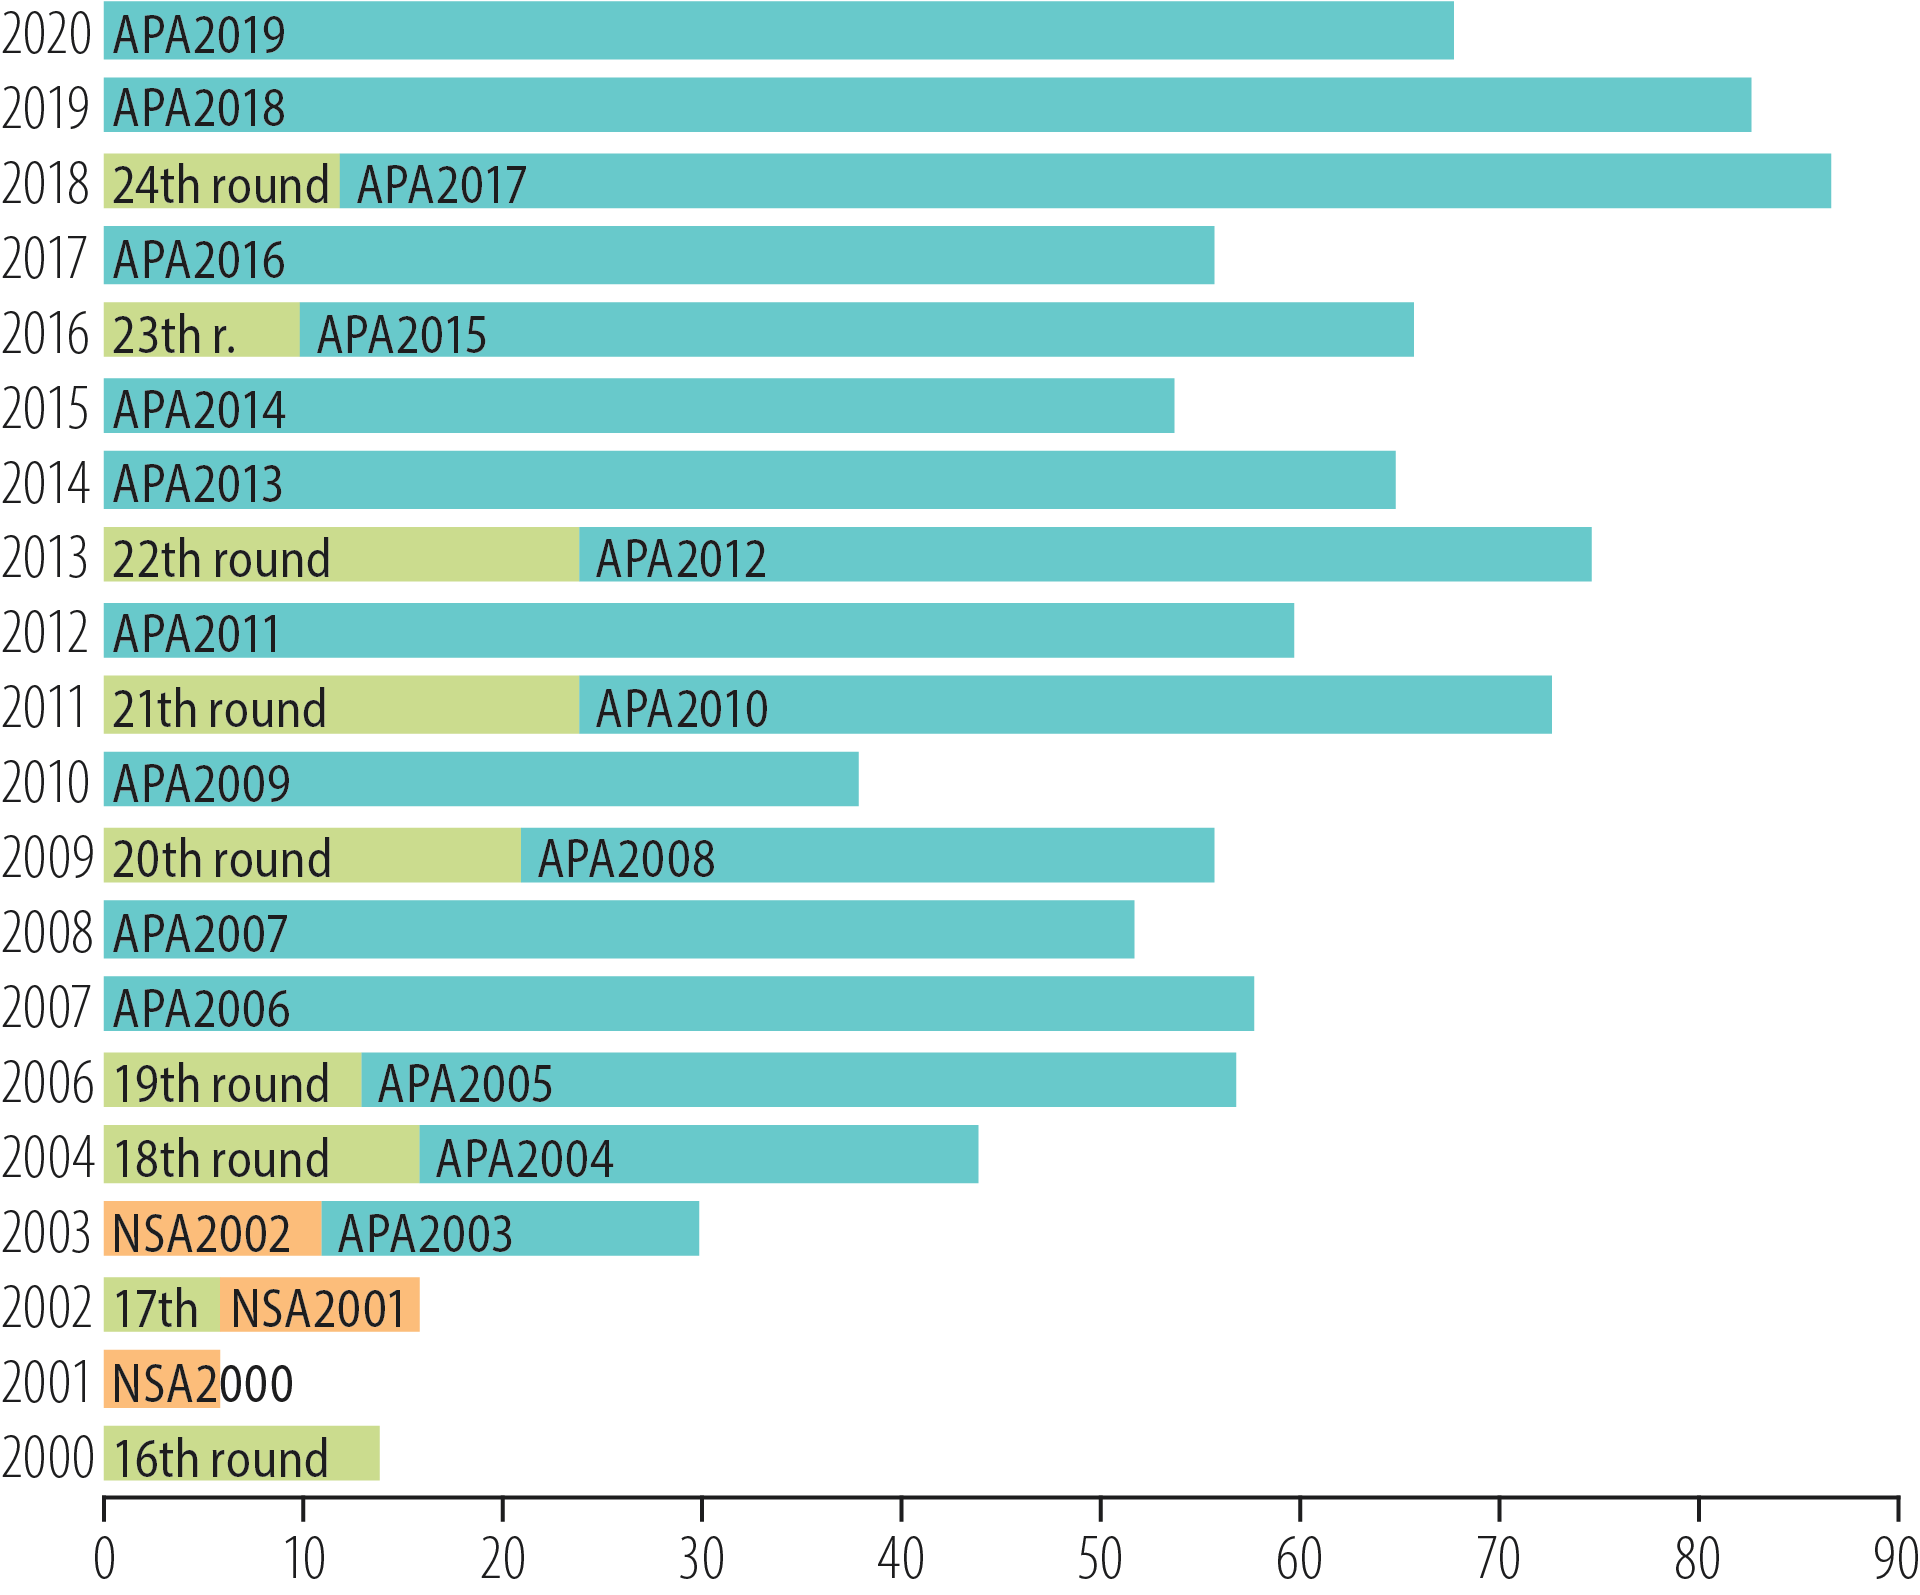
Figure 2.10 Production licences awarded since 2000
The APA has contributed to extensive awards and a marked increase in licenced acreage (figure 2.11), which now covers much of the North and Norwegian Seas (figure 2.12). Work programmes in the licences can lay the basis for a high level of exploration in coming years.
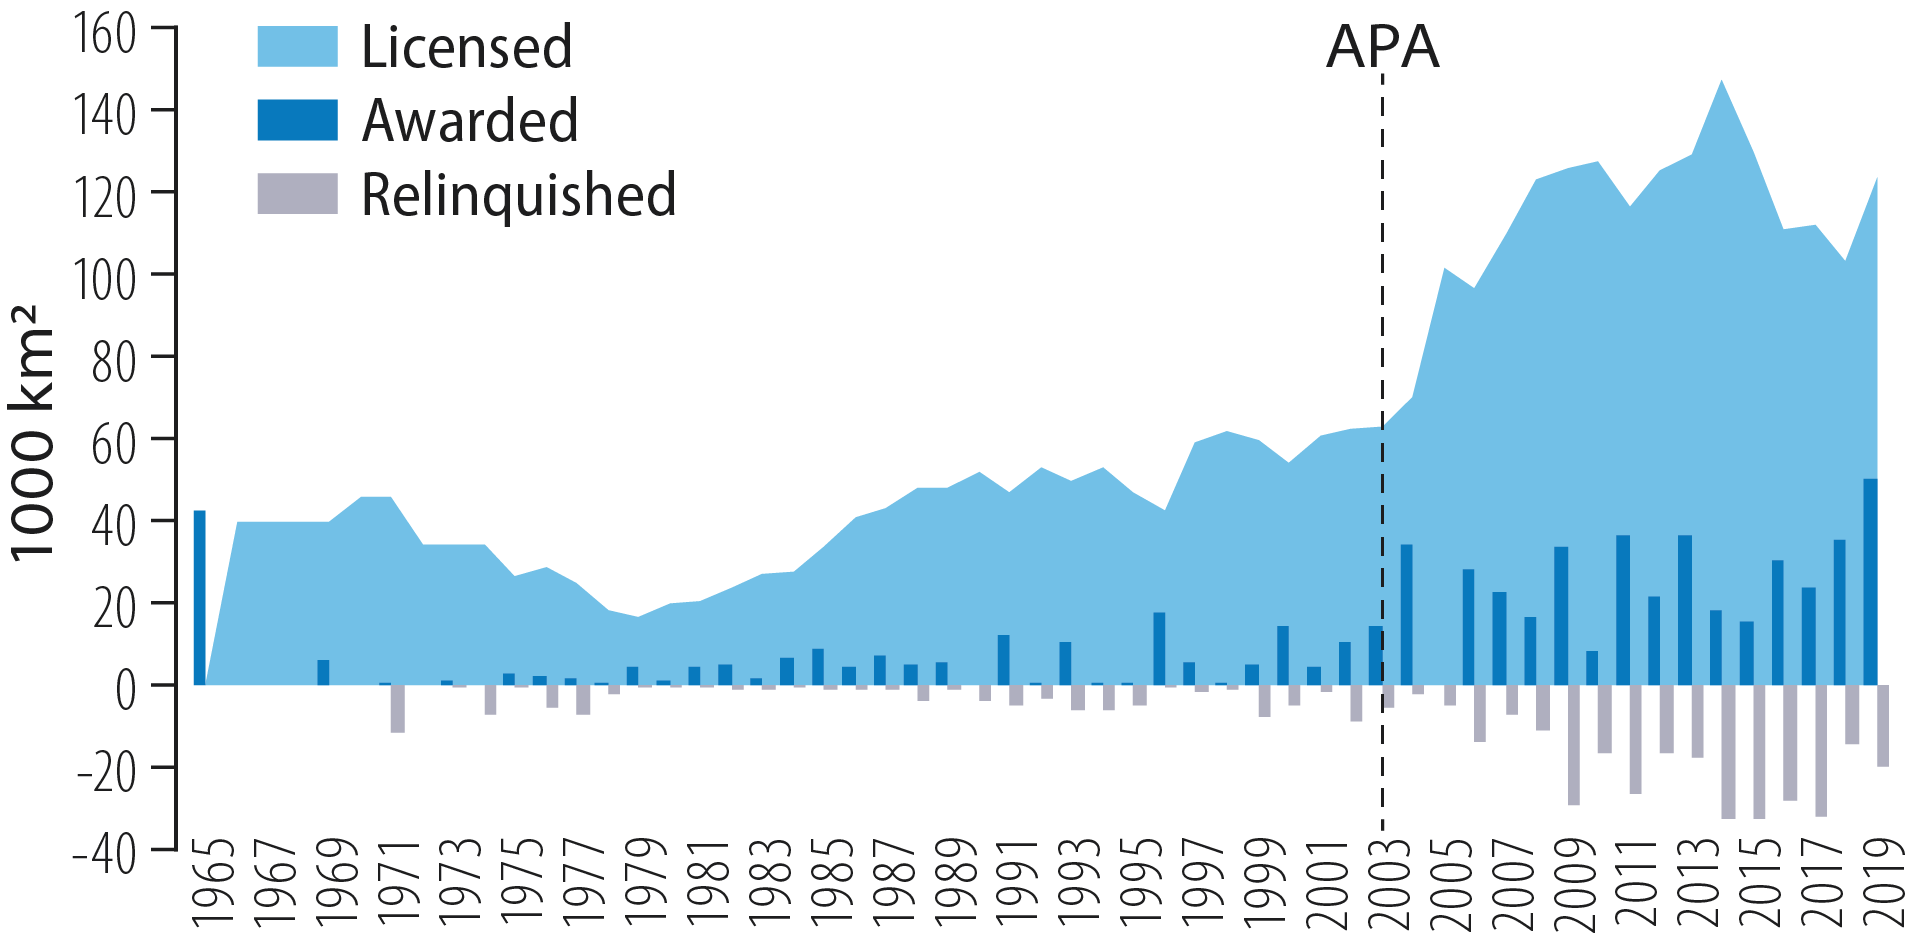
Figure 2.11 Development of available exploration acreage on the NCS
Since the APA scheme was launched, acreage has been awarded and relinquished several times (figure 2.13). Discoveries are still being made in such areas – including some big discoveries, such as Johan Sverdrup.
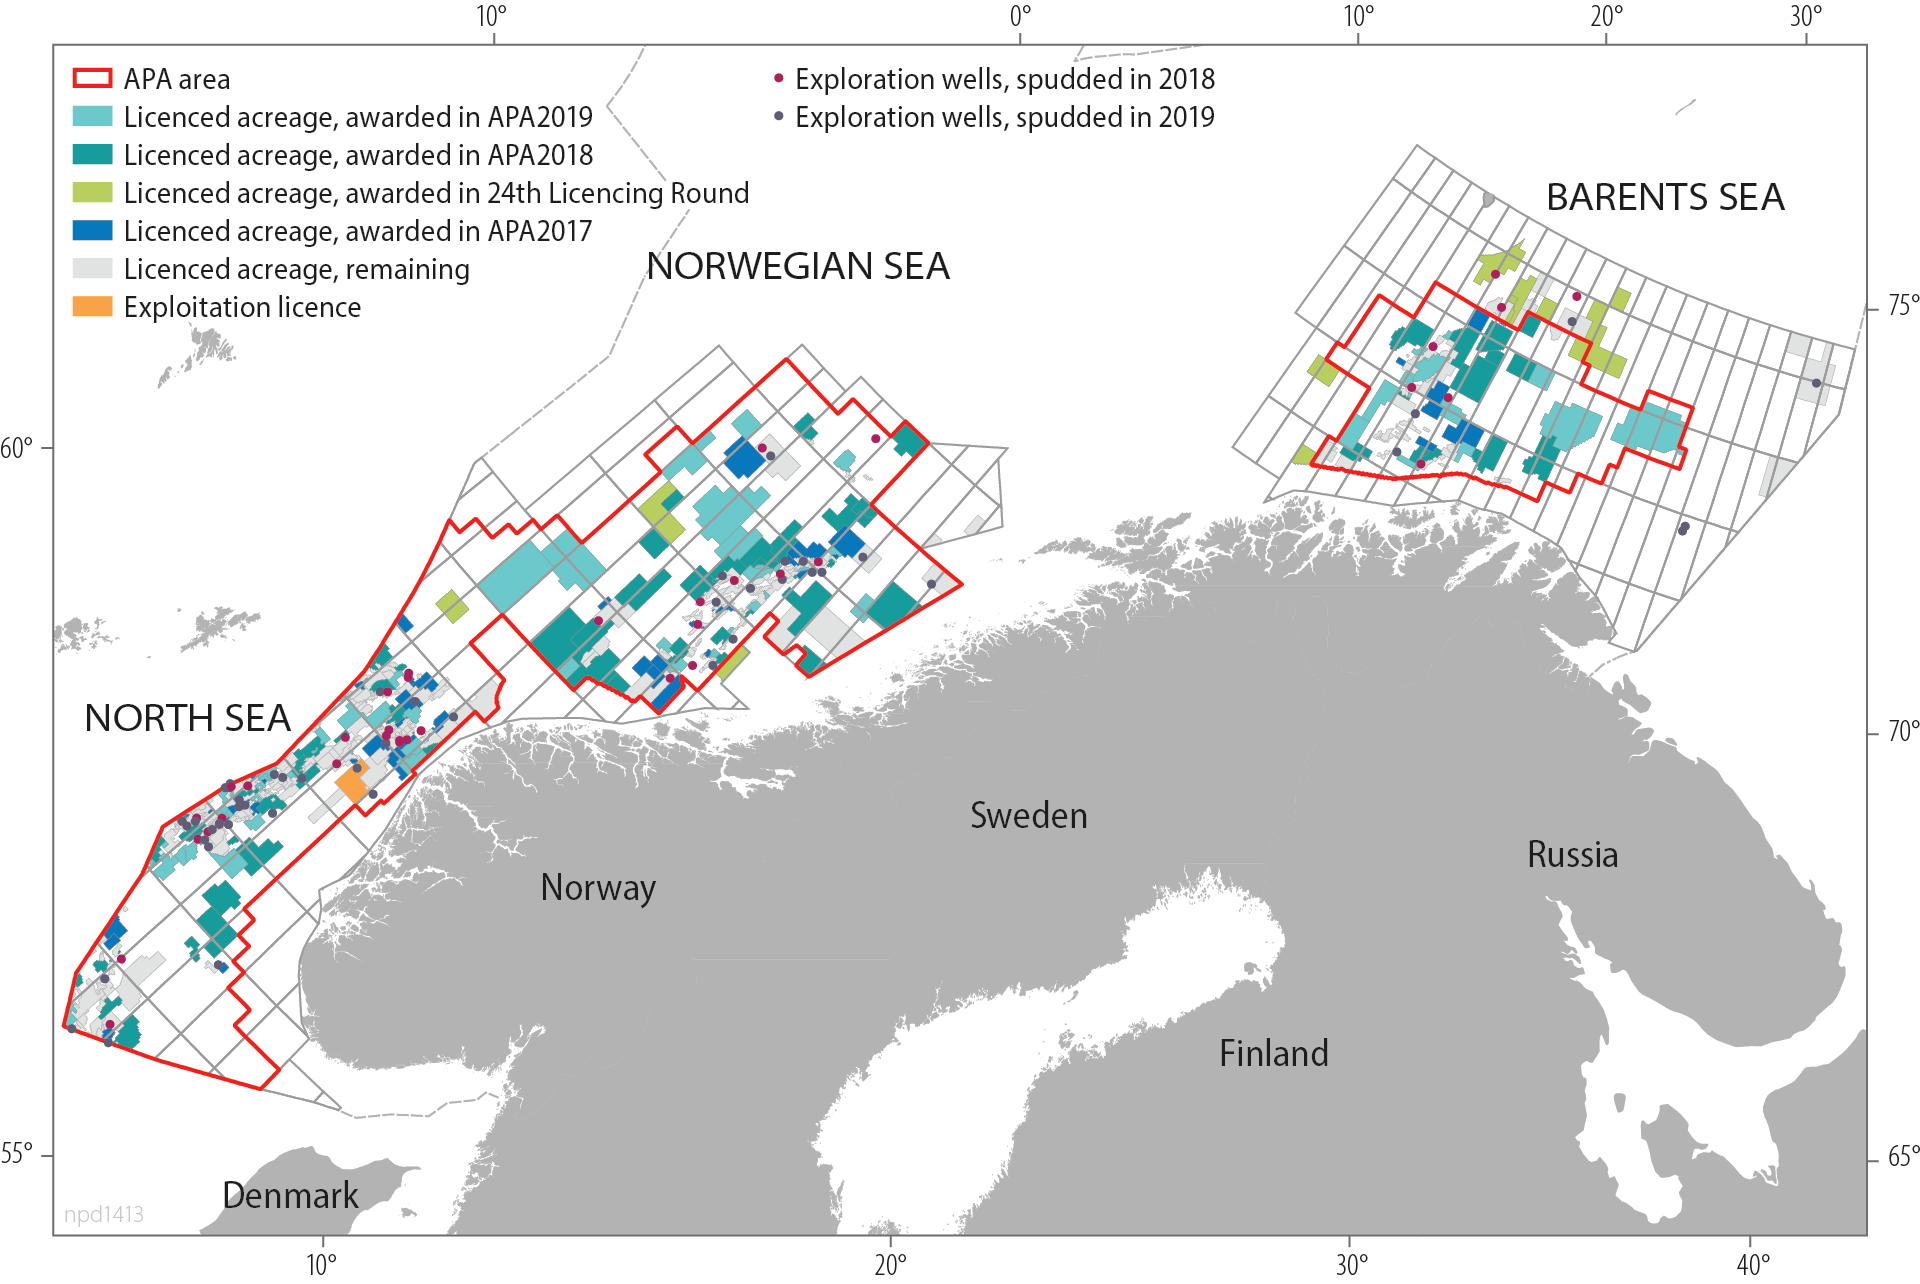
Figure 2.12 Area licensed on the NCS at 31 December 2019
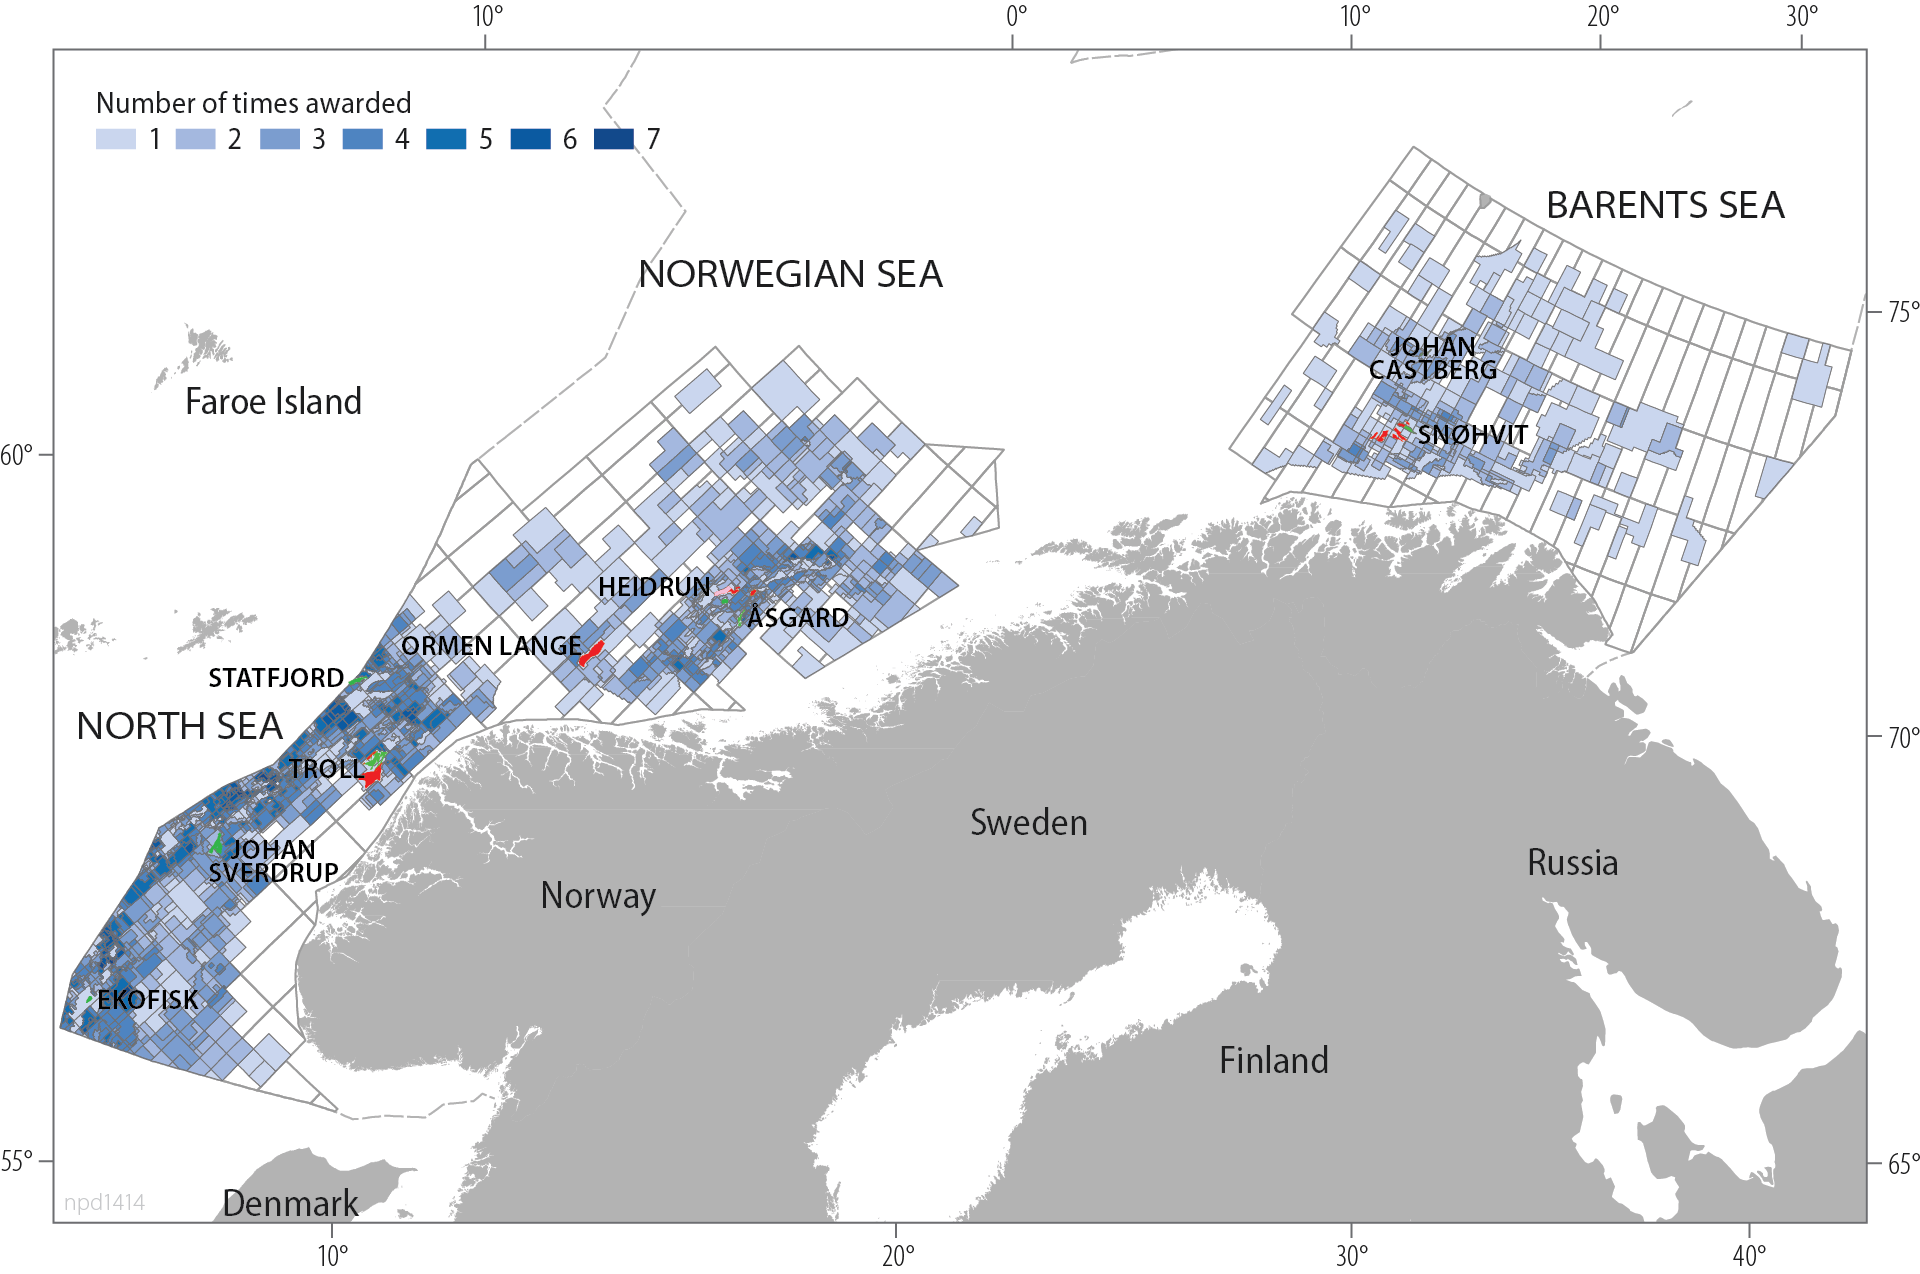
Figure 2.13 Number of times acreage has been awarded
Supply of acreage through an active market for purchase and sale of interests
Companies can also access exploration acreage by buying interests in production licences (figure 2.14). Such activity was record high in 2019. A well-functioning secondary market gives companies the opportunity to build a balanced portfolio of exploration acreage outside the licensing rounds.
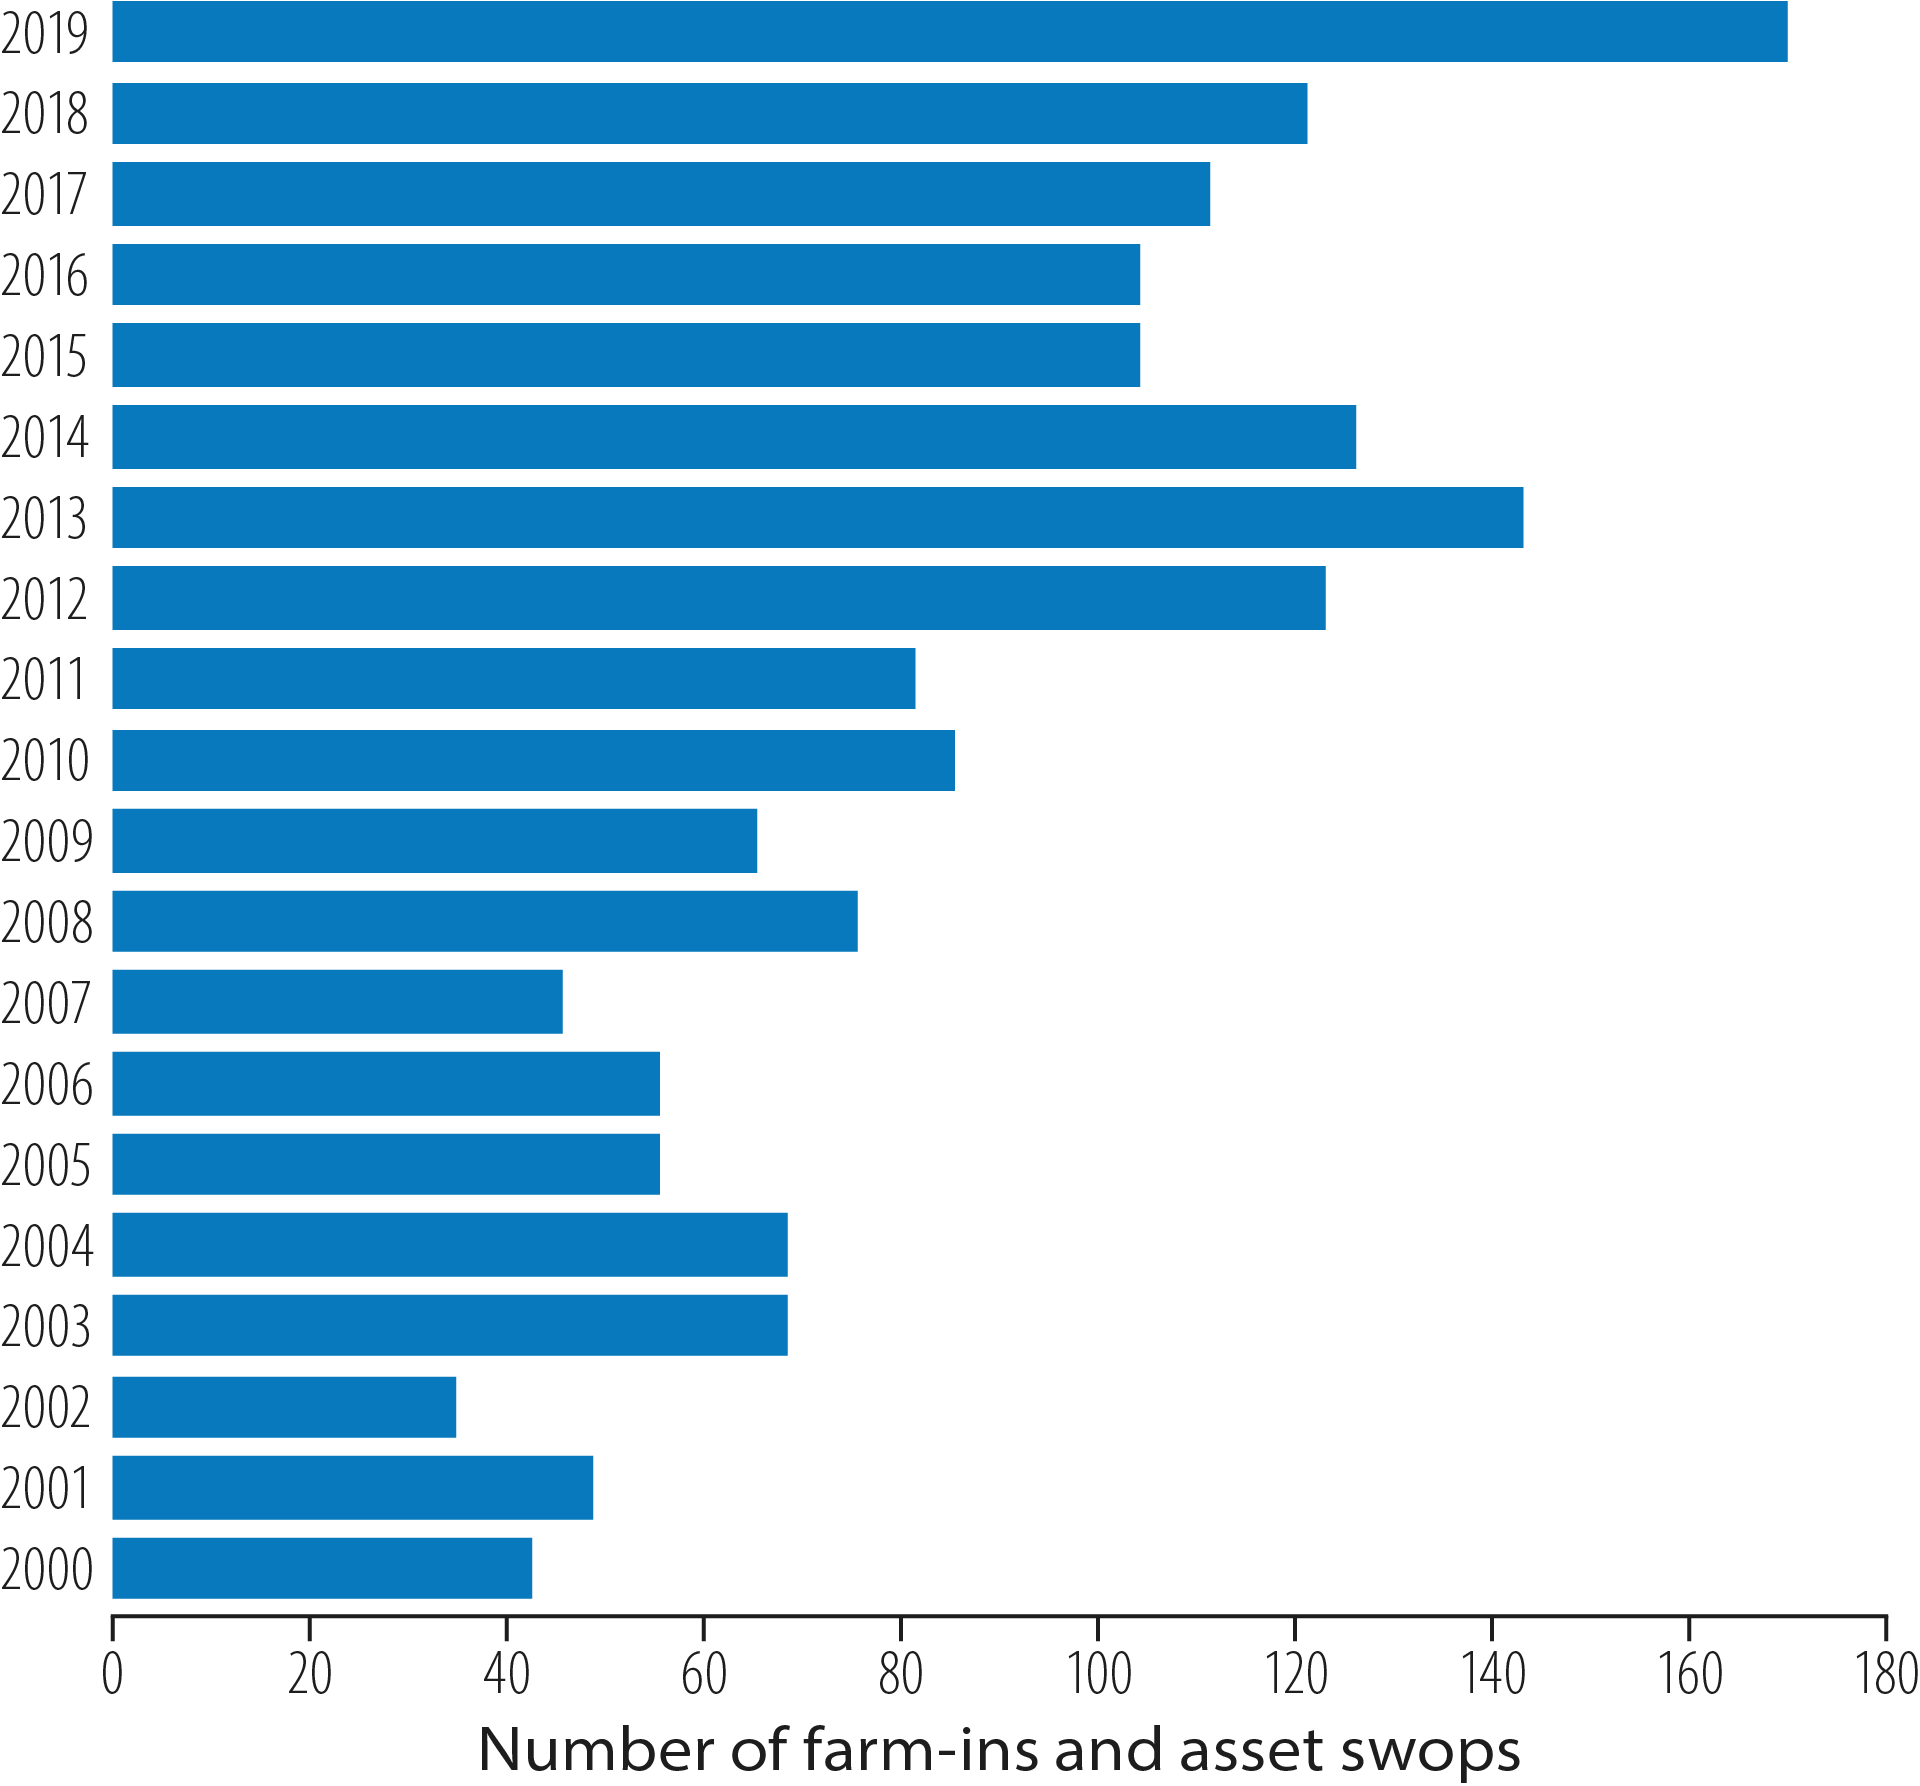
Figure 2.14 Farm-ins and swops of licence interests on the NCS
Many discoveries
The high level of exploration has yielded many discoveries. Figure 2.15 presents discoveries per annum since 2000 by region. Government measures contributed to a substantial increase in discoveries from 2007.
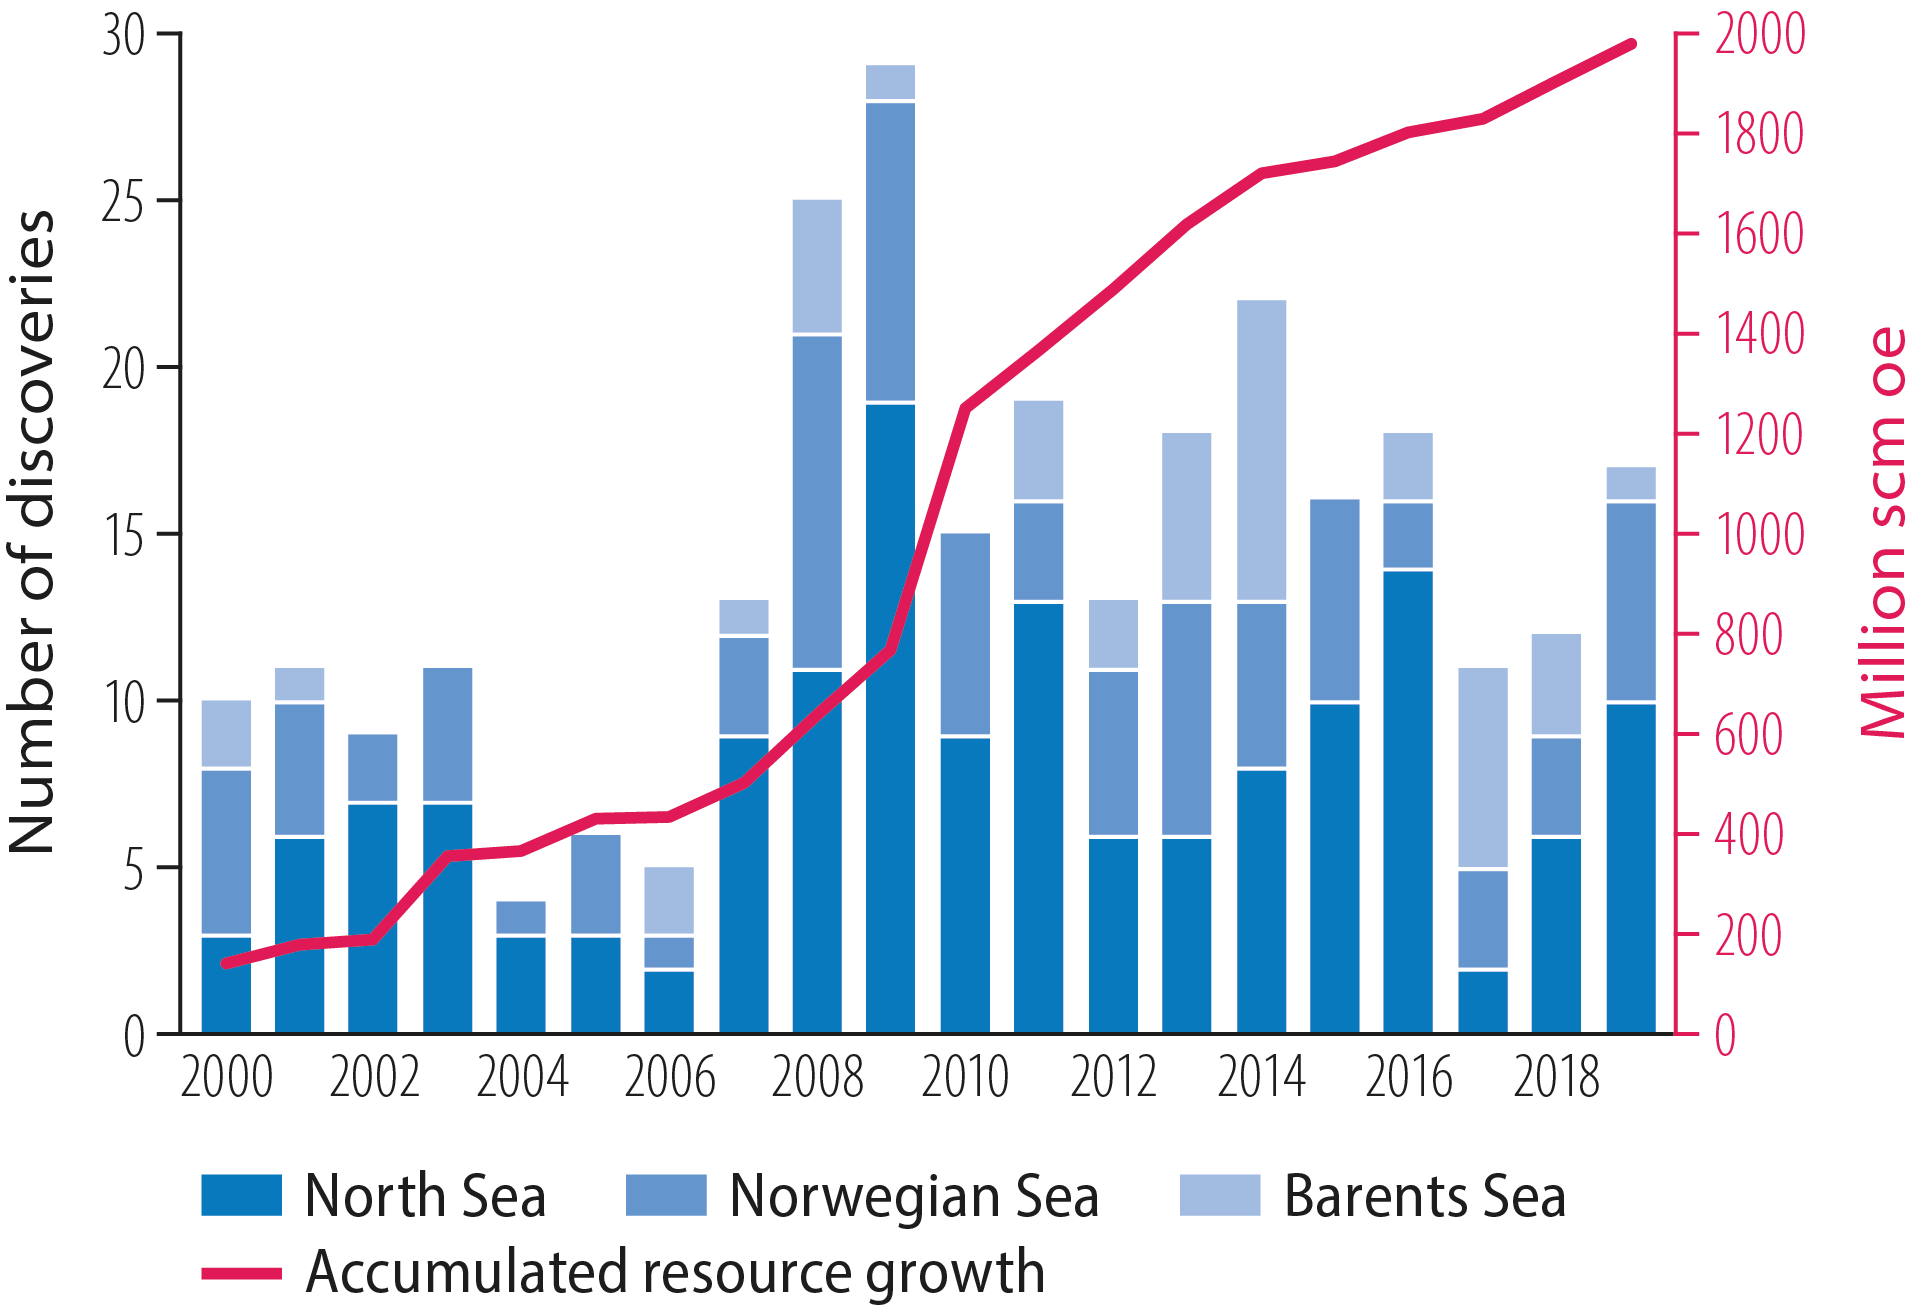
Figure 2.15 Number of discoveries by region and total resource growth, 2000-19
A total of 31 discoveries were made in 2018-19 – 17 in the North Sea, 10 in the Norwegian Sea and four in the Barents Sea. Preliminary assessments indicate that 2018 and 2019 were the two best exploration years of the past five (figure 2.16).
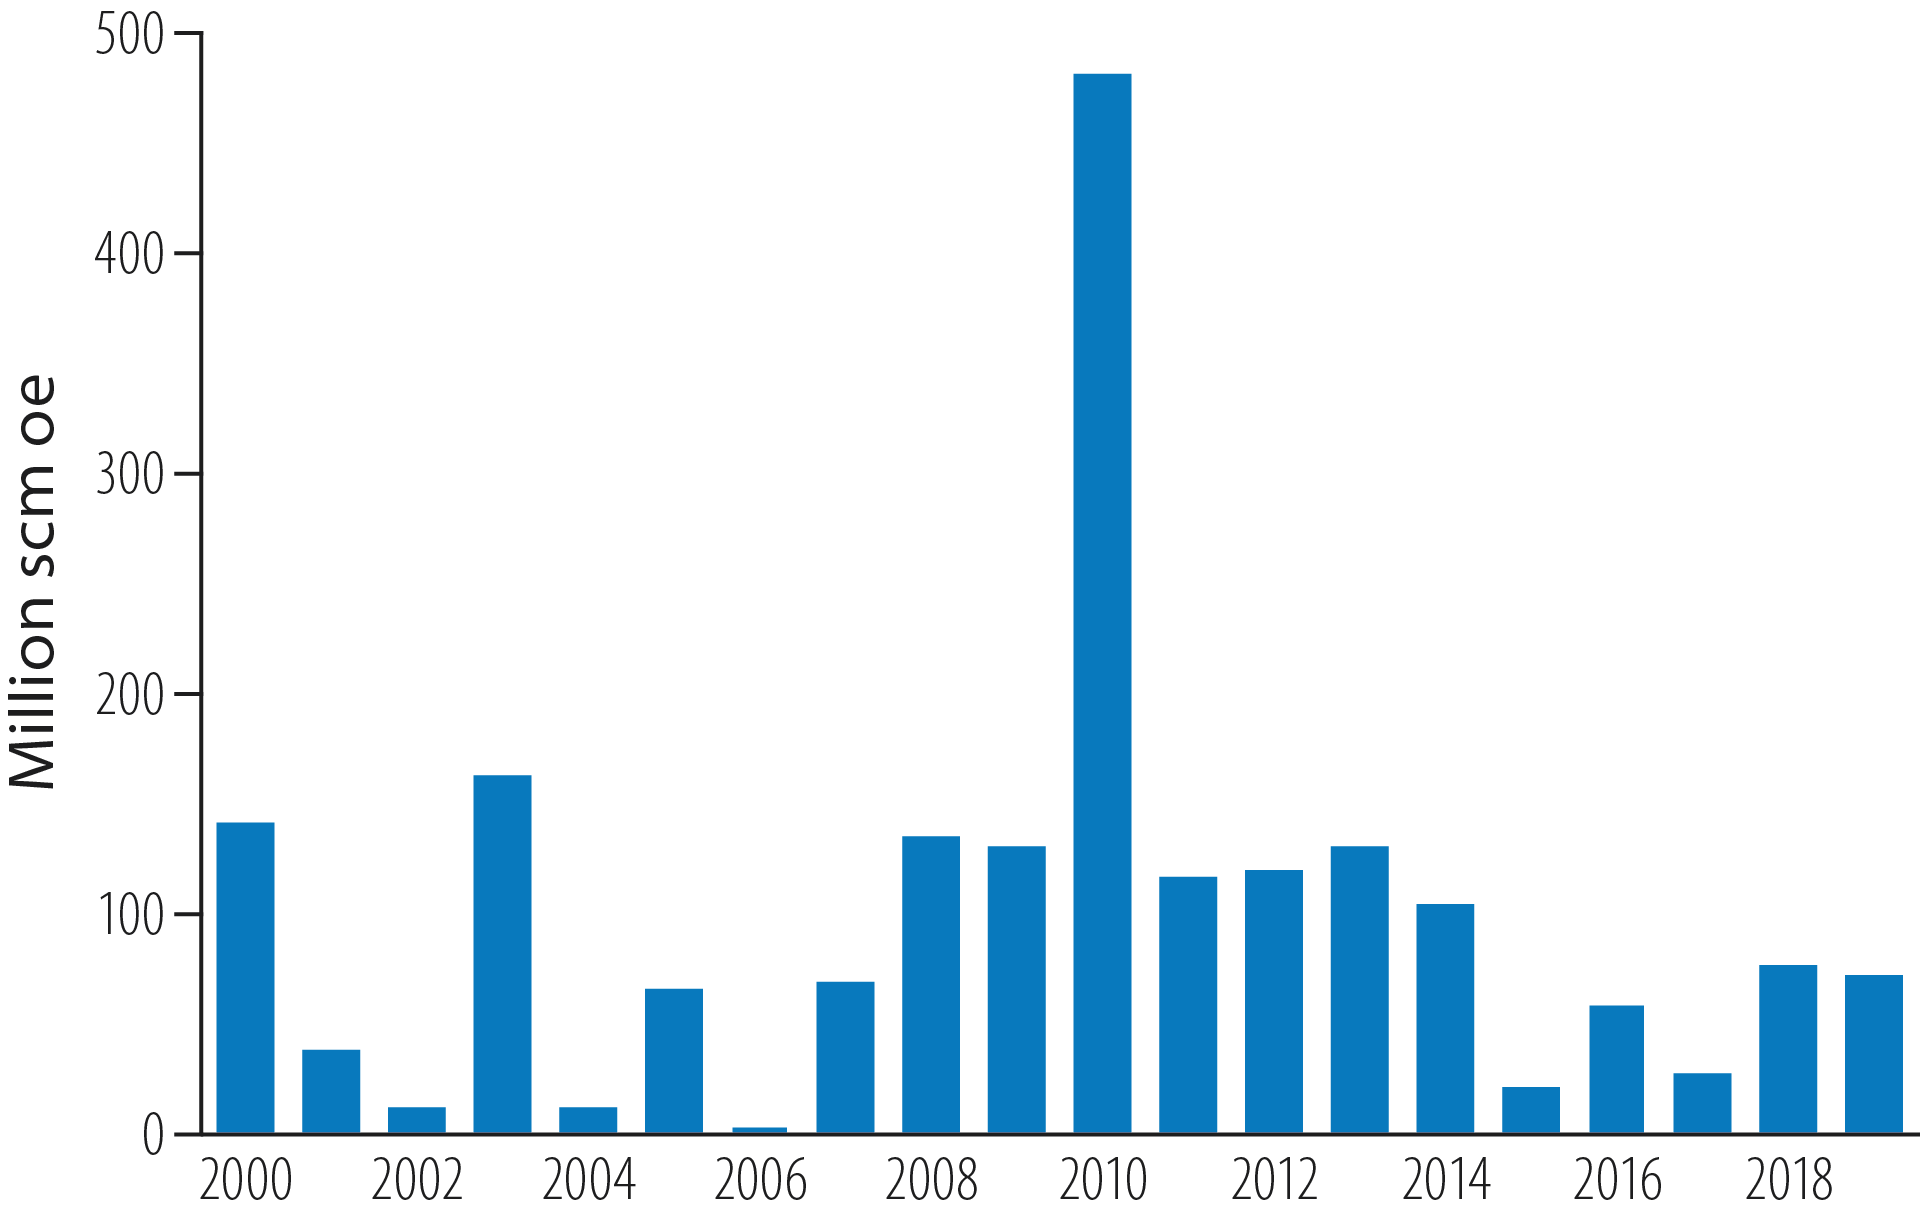
Figure 2.16 Annual resource growth from exploration, 2000-19
Discoveries in different plays give new understanding
Wells have been drilled in a number of plays during recent years, but most frequently in those with Jurassic reservoirs which are already well-explored. More than half the discoveries over the past five years are in Jurassic plays (figure 2.17). An example of discoveries in less explored plays is 25/2-21 (Liatårnet), proven during 2019 in a Miocene reservoir (Neogene). It is considered to be the first oil discovery in this play on the NCS, although earlier wells in the area have yielded traces of oil. Results from a forthcoming appraisal well will be important in determining whether the discovery can be developed and for further exploration in this play.
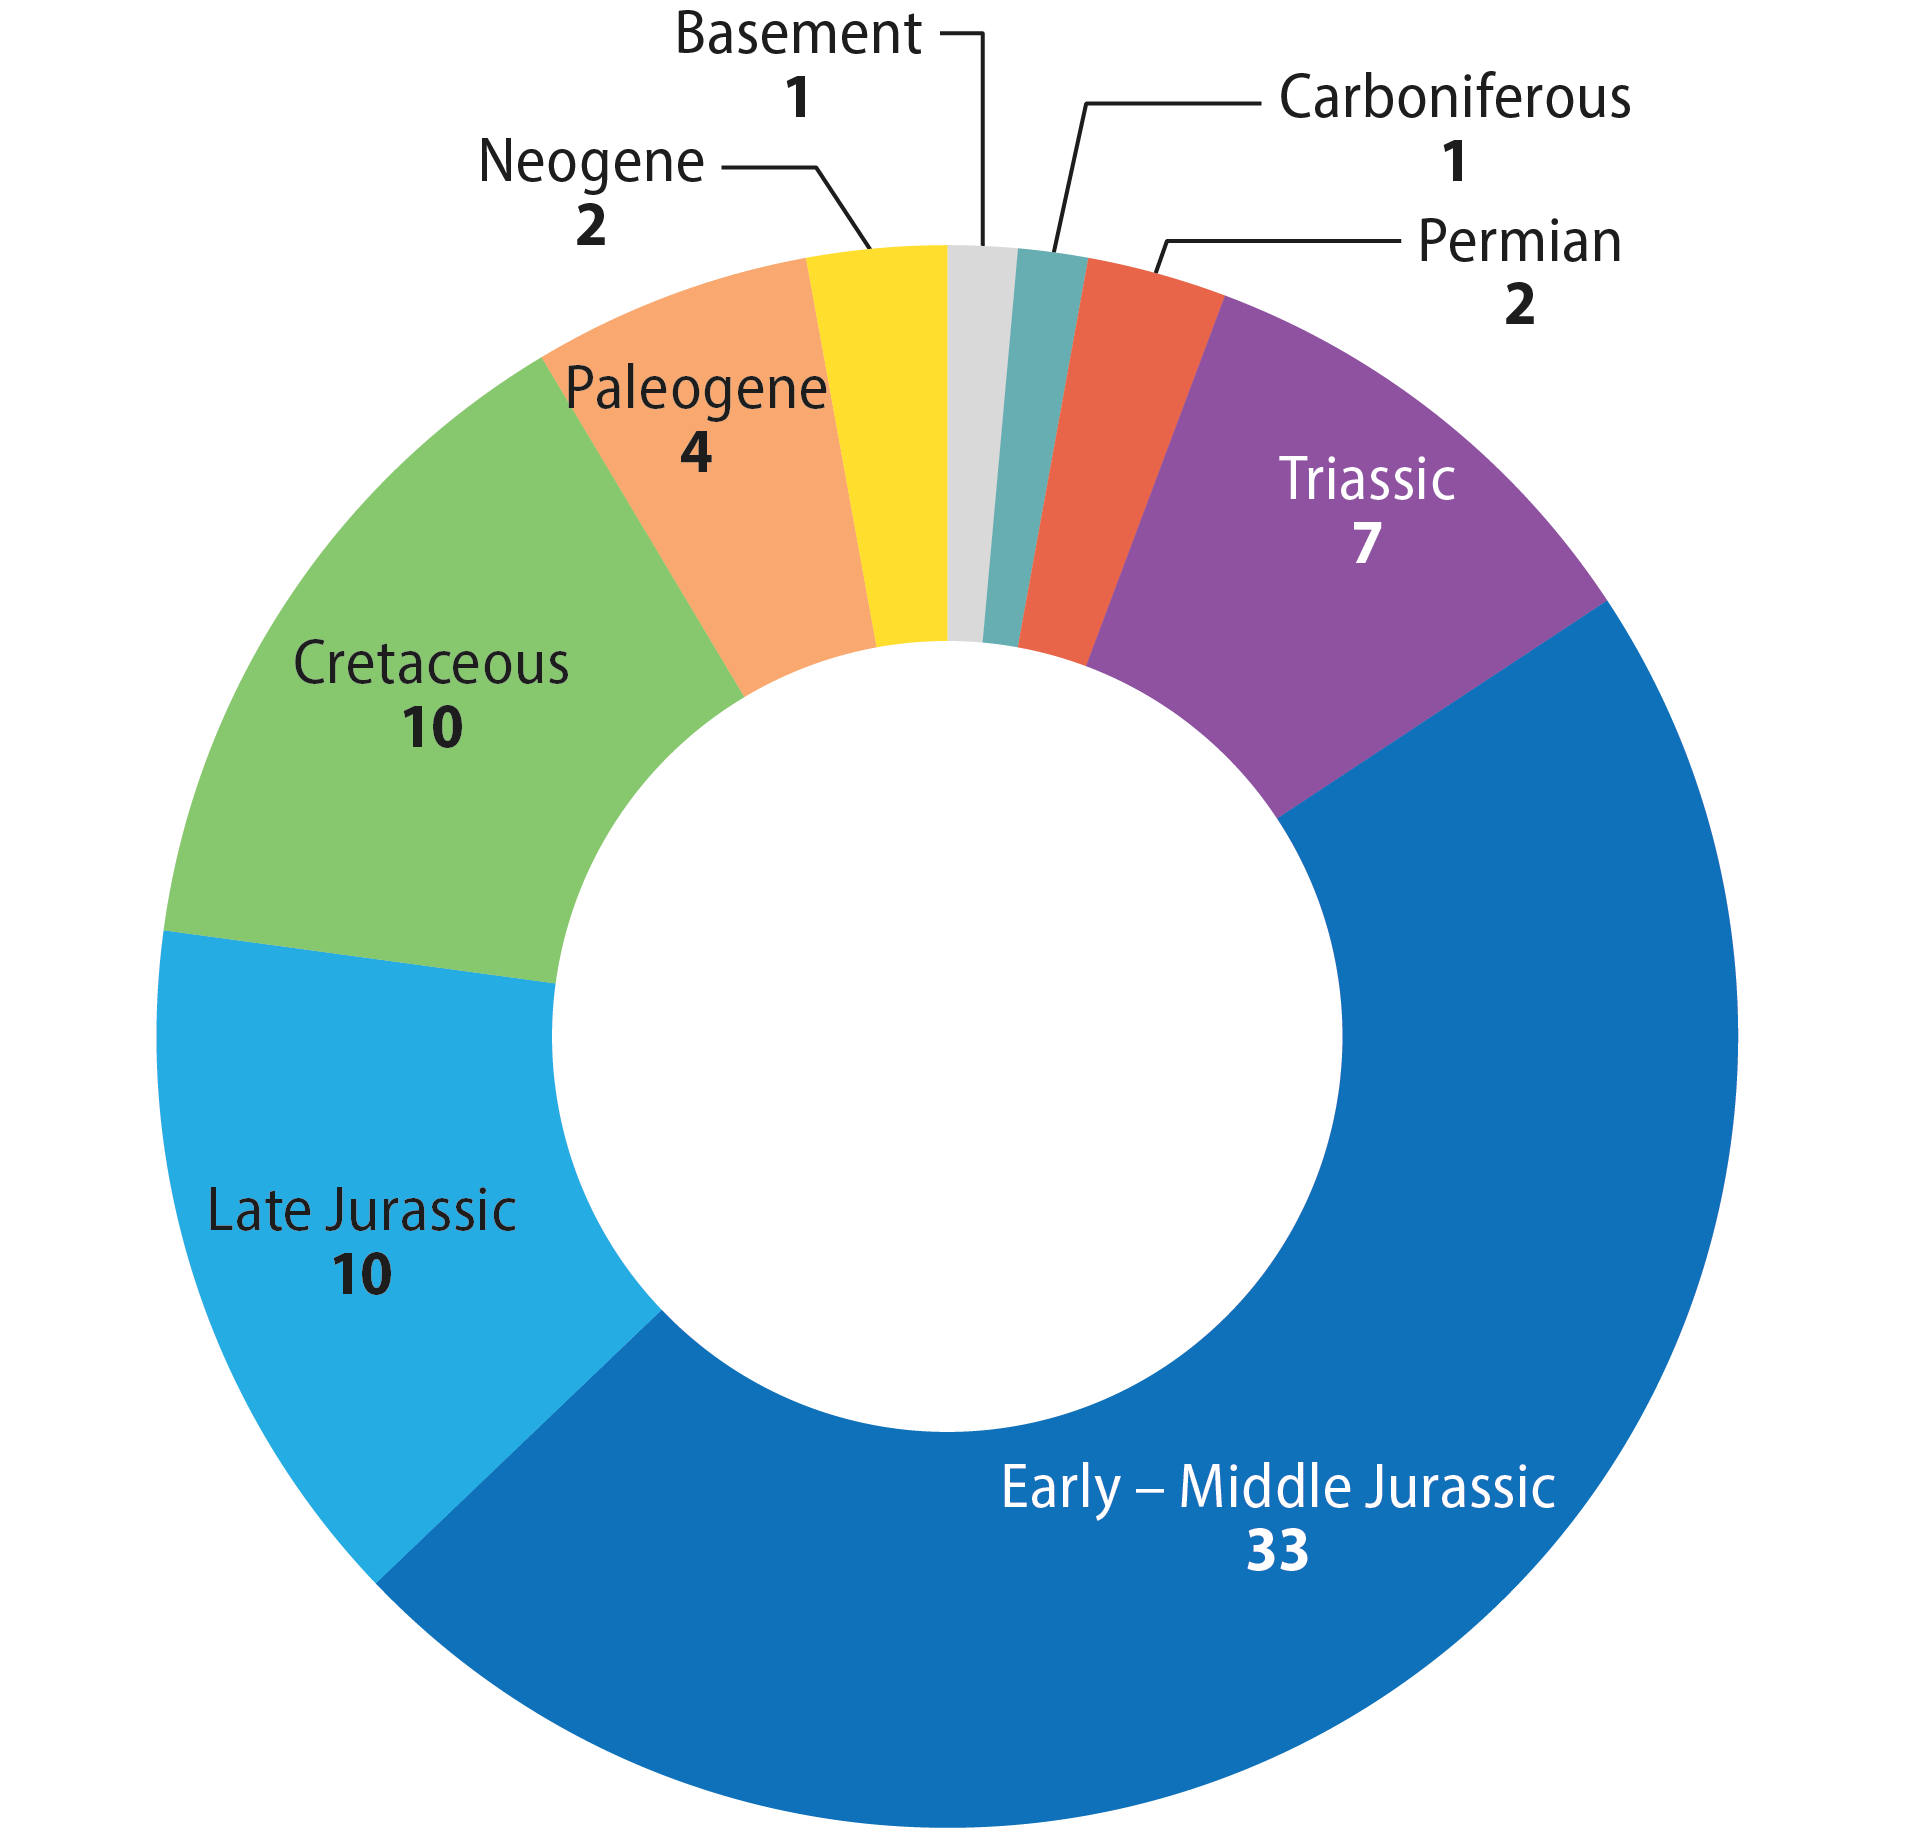
Figure 2.17 Discovery wells by reservoir age, 2015-19
Several discoveries have been made in injectites in the central part of Norway’s North Sea sector (fact box 2.3). The latest generation of 3D seismic data, based on broadband technology, has improved imaging of these complex structures and provided a better basis for drilling decisions, well execution and further exploration. Challenges in obtaining sufficiently good seismic images mean that drilling wells horizontal or with specially designed paths still represents the only way of determining injectite extent.
Plays involving Cretaceous reservoirs are well known in the Norwegian Sea but their petroleum potential has been regarded as limited. Over the past couple of years, however, several discoveries have been made in such formations. This indicates that these plays could have a bigger potential than previously thought, and industry interest in them is therefore greater than before.
Discovery size declining
International experience shows that the largest discoveries are made early in the exploration phase for a new petroleum province, and that their size declines as the area matures. This also applies to the NCS, with some exceptions such as Johan Sverdrup. The average discovery size has been falling for a long time, reflecting the fact that exploration increasingly takes place in mature areas (figure 2.19).

Figure 2.19 Development of average discovery size by region
Access to infrastructure – important for small discoveries
Small discoveries can become profitable by tying them back to nearby infrastructure. Coordinating several minor discoveries can also help to improve the profitability of such tie-ins. A good example is provided by the ongoing Breidablikk development, where plans call for several small discoveries to be jointly developed and phased into the Grane facility in the North Sea.
Another is the unitisation of several discoveries in the Halten East area of the Halten Bank in the Norwegian Sea, which could form the basis of a coordinated development tied back to Åsgard B.
New infrastructure – collaboration and coordination
Achieving profitability in small discoveries located far from cost-effective infrastructure is more demanding. In such areas, large new discoveries or coordination of several small discoveries may provide the basis for a stand-alone production facility. Establishing new infrastructure with flexible capacity could lower the financial threshold for developing new discoveries and for exploration activity.
Establishing the Polarled pipeline, which carries gas from Aasta Hansteen in the Norwegian Sea to Nyhamna on Norway’s west coast, has increased interest in exploring for gas in this part of the NCS (figure 2.20). Several active licences have been awarded near Polarled in 2018-20.
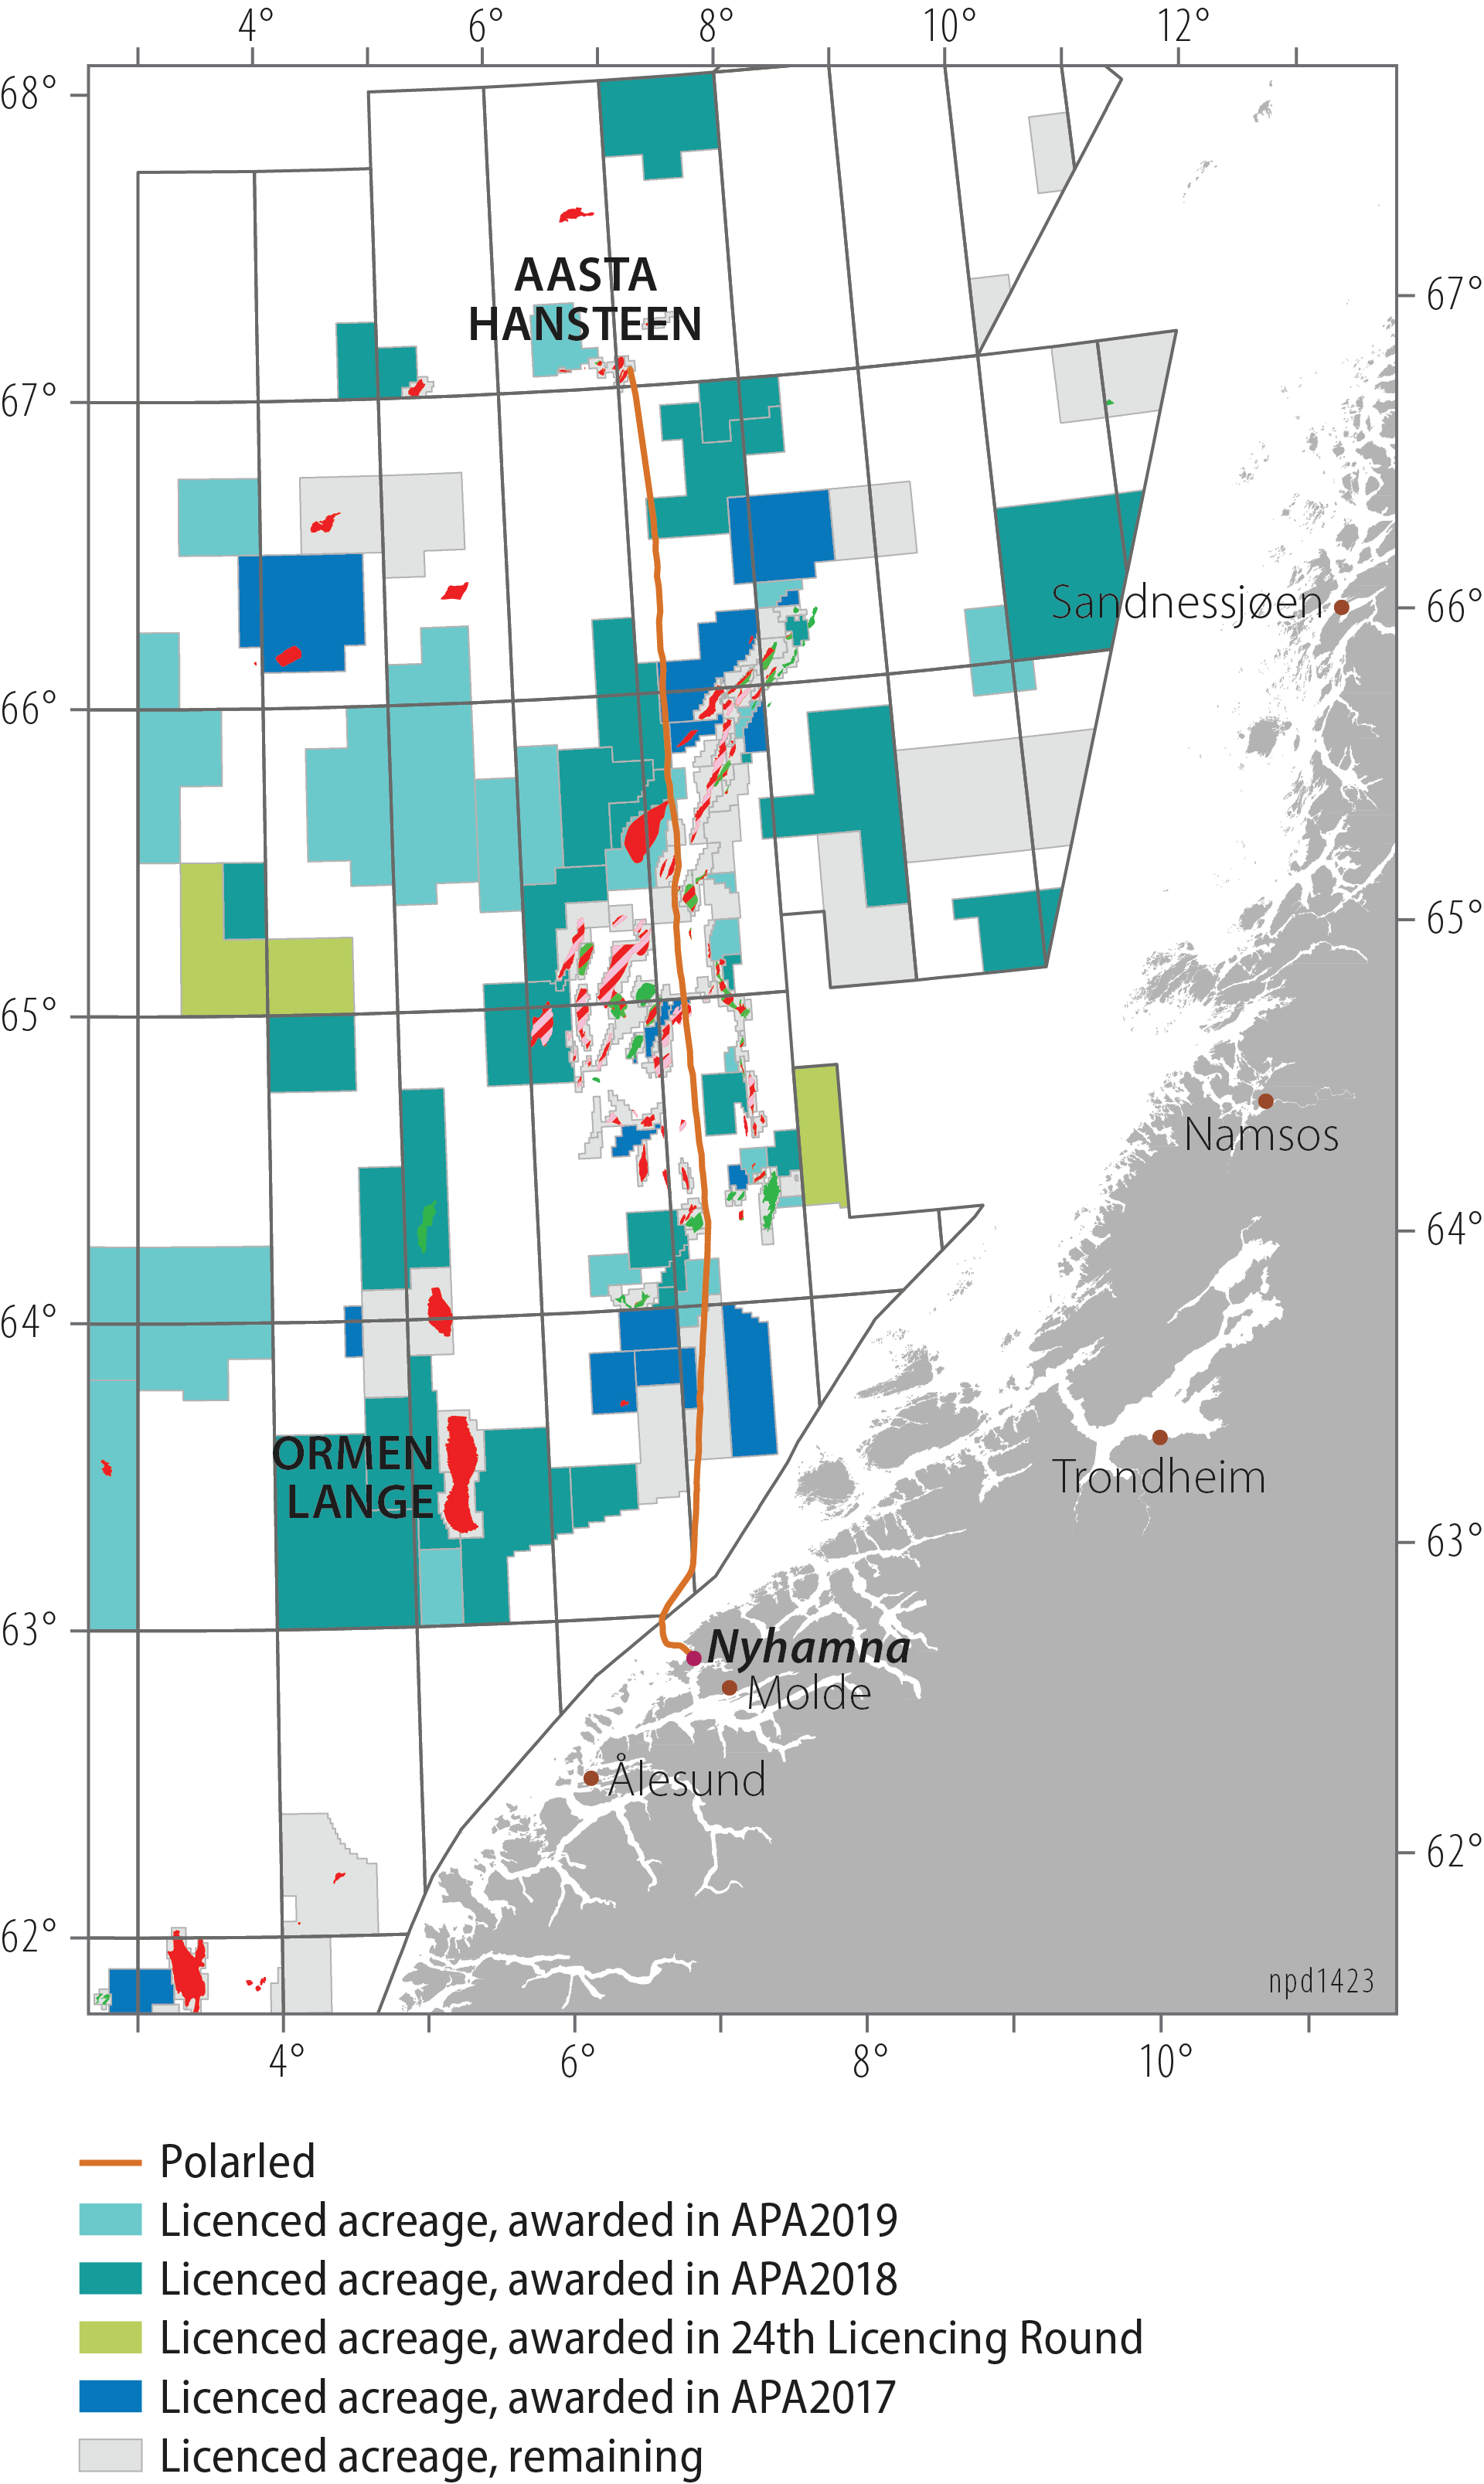
Figure 2.20 Awards near Polarled in the Norwegian Sea, 2018 and 2019
Gas is only exported from the Barents Sea today via Snøhvit’s gas liquefaction plant at Melkøya in northern Norway. Existing capacity at this Hammerfest LNG facility will be fully utilised right up to 2050, based on gas in fields on stream and under development. Lack of access to gas infrastructure weakens incentives to explore, and this affects company exploration strategies. Expanding gas export capacity from Barents Sea South could increase exploration. That will be important for realising a larger share of the Barents Sea’s resource potential.
Studies by Gassco and the NPD show that developing new gas infrastructure in the Barents Sea could be socioeconomically profitable. That calls for collaboration and coordination across production licences and players.
Small discoveries give low materiality and influence the player picture
Although small discoveries can yield a high financial return in percentage terms, their materiality – or net present value (NPV) – is considerably lower than for big discoveries. The majors have traditionally concentrated on large projects. As discovery size declines, NCS developments face strong competition for investment funds and expertise at the majors. The latter appear to be reducing their activities on the NCS because new discoveries and projects are too small. The trend for participation by majors in exploration wells is an indicator of this (figure 2.21).
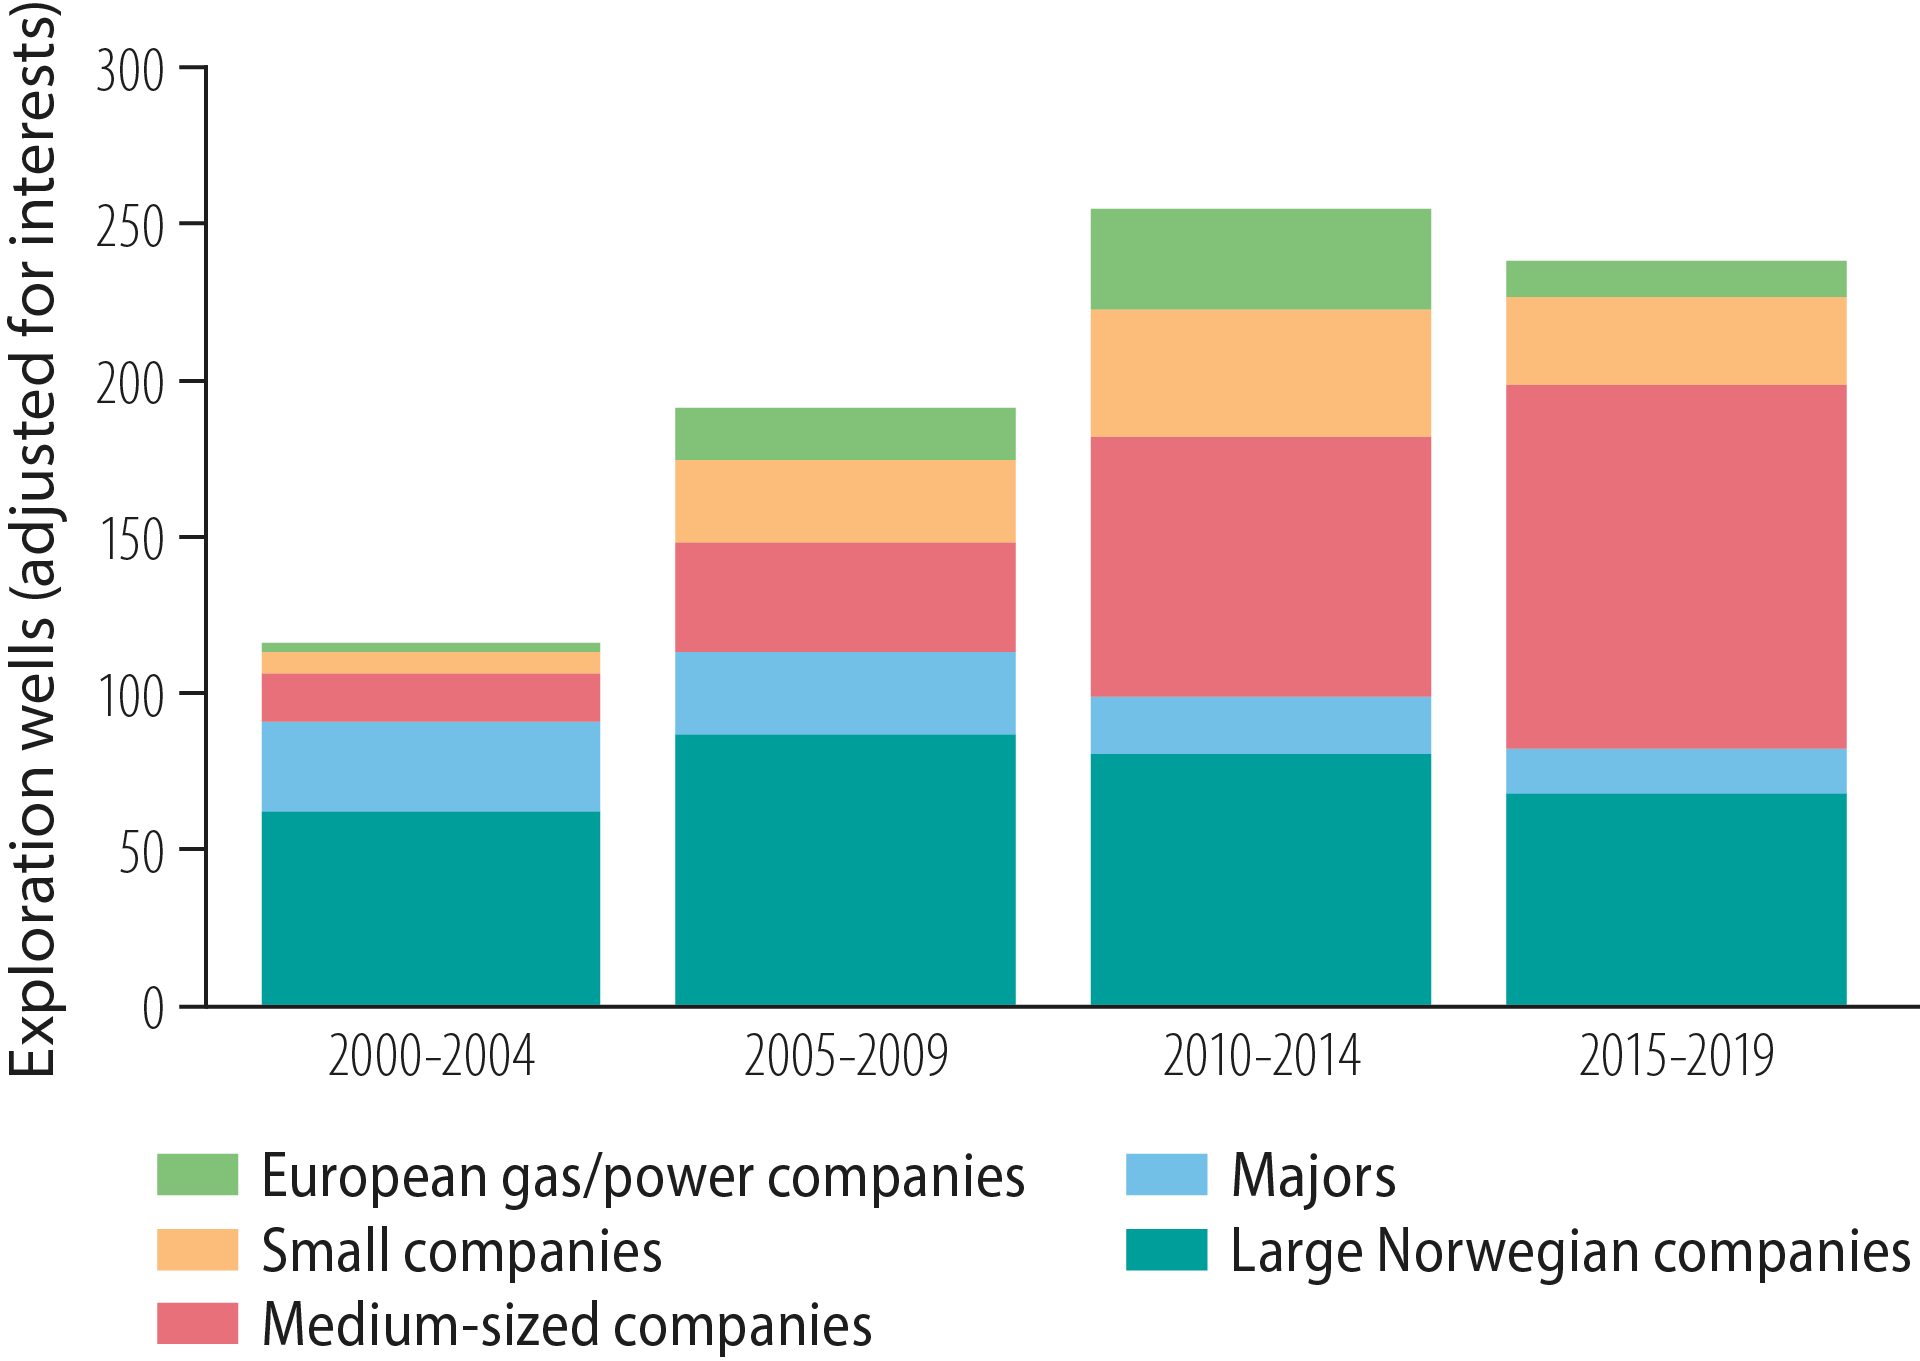
Figure 2.21 Exploration wells by company category, 2000-19 Licensees (adjusted for licence interests)
Political measures aimed at increasing player diversity, including the introduction of the APA rounds and the reimbursement system, led to a marked rise in the number of small participants from the mid-2000s. The recent trend is characterised by mergers and acquisitions, which have resulted in a larger number of medium-sized companies, as well as by majors withdrawing from Norway and energy companies selling out of oil and gas and investing in renewables (figure 2.22).
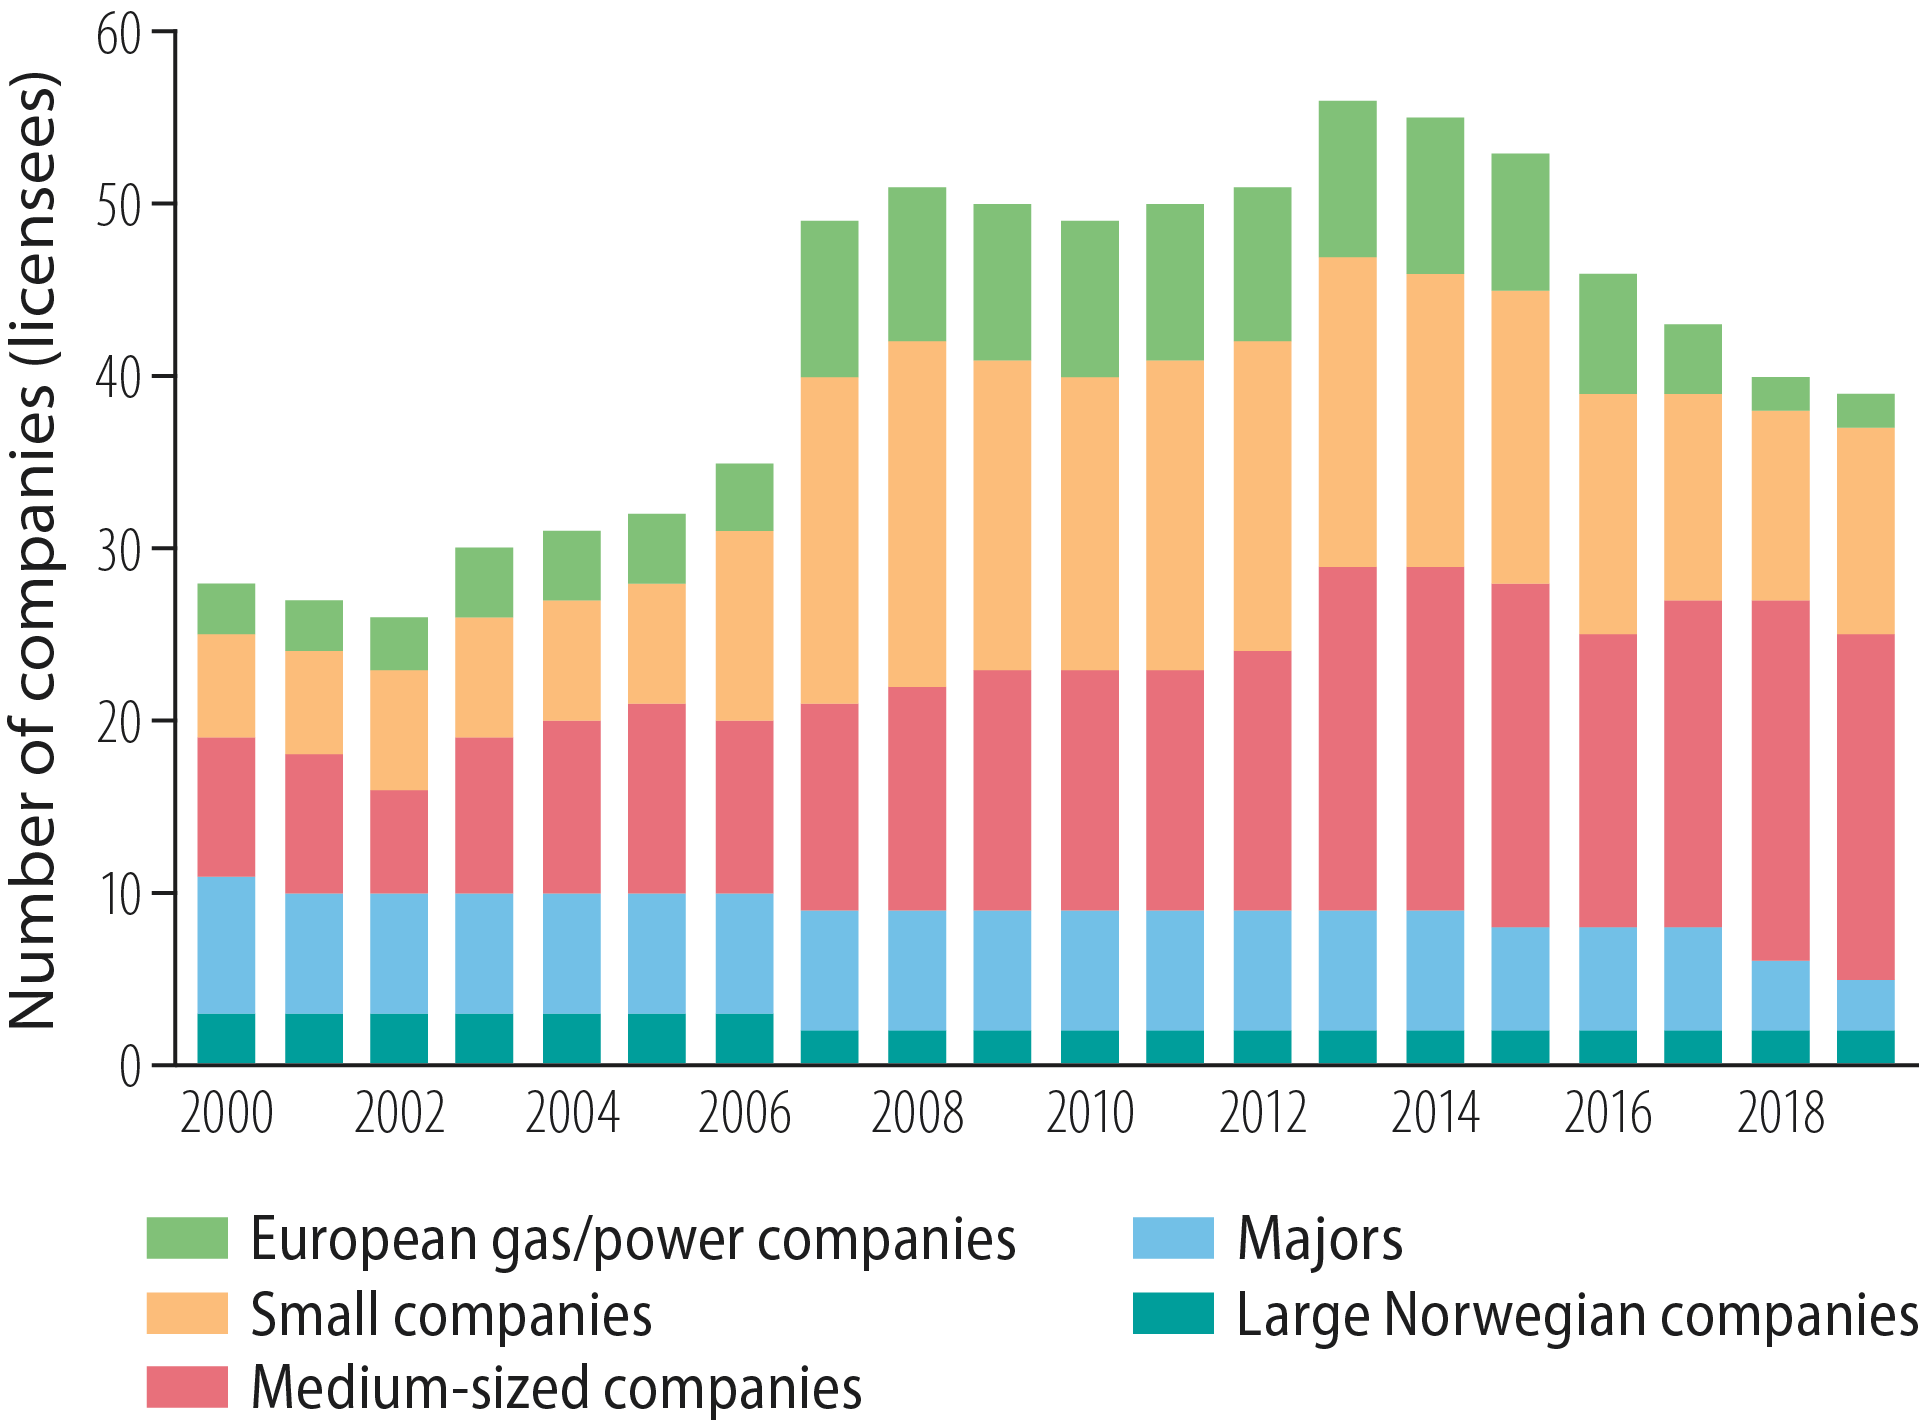
Figure 2.22 Development of the player picture, 2000-19
When the majors withdraw, they open up for other players with different strategies and priorities. ExxonMobil, which recently pulled out of the NCS, had not pursued exploration in the Balder licence (PL 001) during recent decades. Following the licensee change, interest is now being shown in drilling several exploration wells there.
Low resource growth –
demanding to replace production
High discovery rate
With the size of discoveries in decline, a high discovery rate is important for maintaining the competitiveness of the NCS. Figure 2.23 presents the technical and commercial discovery rates. The first of these has been variable but high throughout since 1980. This indicates that learning effects and technological advances have offset the increase in geological maturity, so that the rate remains high.
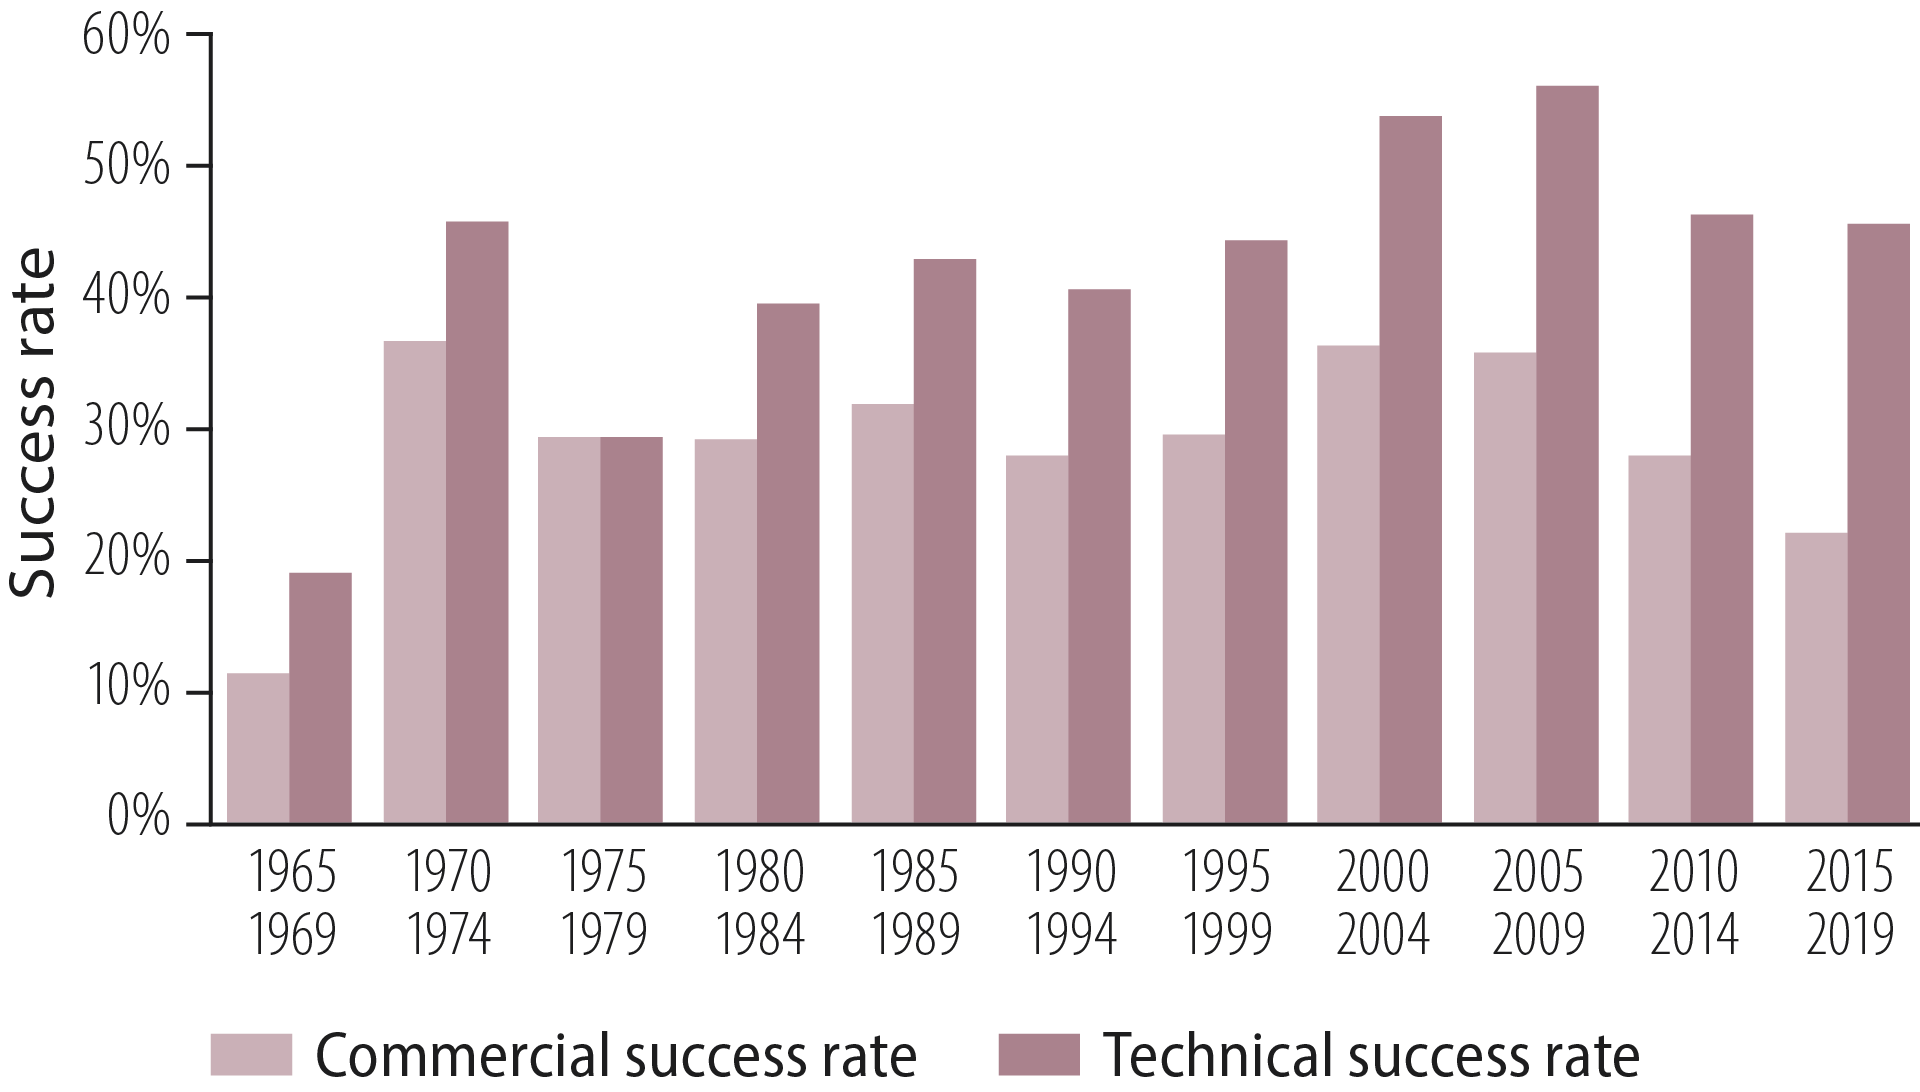
Figure 2.23 Development of the average technical and commercial discovery rates
Although exploration has been profitable in recent decades (see chapter 4), the figure shows a declining trend for the commercial discovery rate over the same period. That creates a growing gap between the technical and commercial rates. One reason for this is declining discovery size. Measures which can improve the profitability of small discoveries could help to increase the commercial discovery rate.
Low resource growth
To maintain production, declining output from the big discoveries must be replaced by a larger number of small discoveries. This development is illustrated in figure 2.24, which shows a growing number of fields on stream and declining production per field. This represents a natural trend in a mature petroleum province.
Resource growth from exploration was clearly at its largest for the first 25 years (figure 2.25). Over the past 25 years, growth – with two substantial exceptions – has been below output on an annual basis. The exceptions are the discoveries of Ormen Lange and Johan Sverdrup in 1997 and 2010 respectively (fact box 2.4).
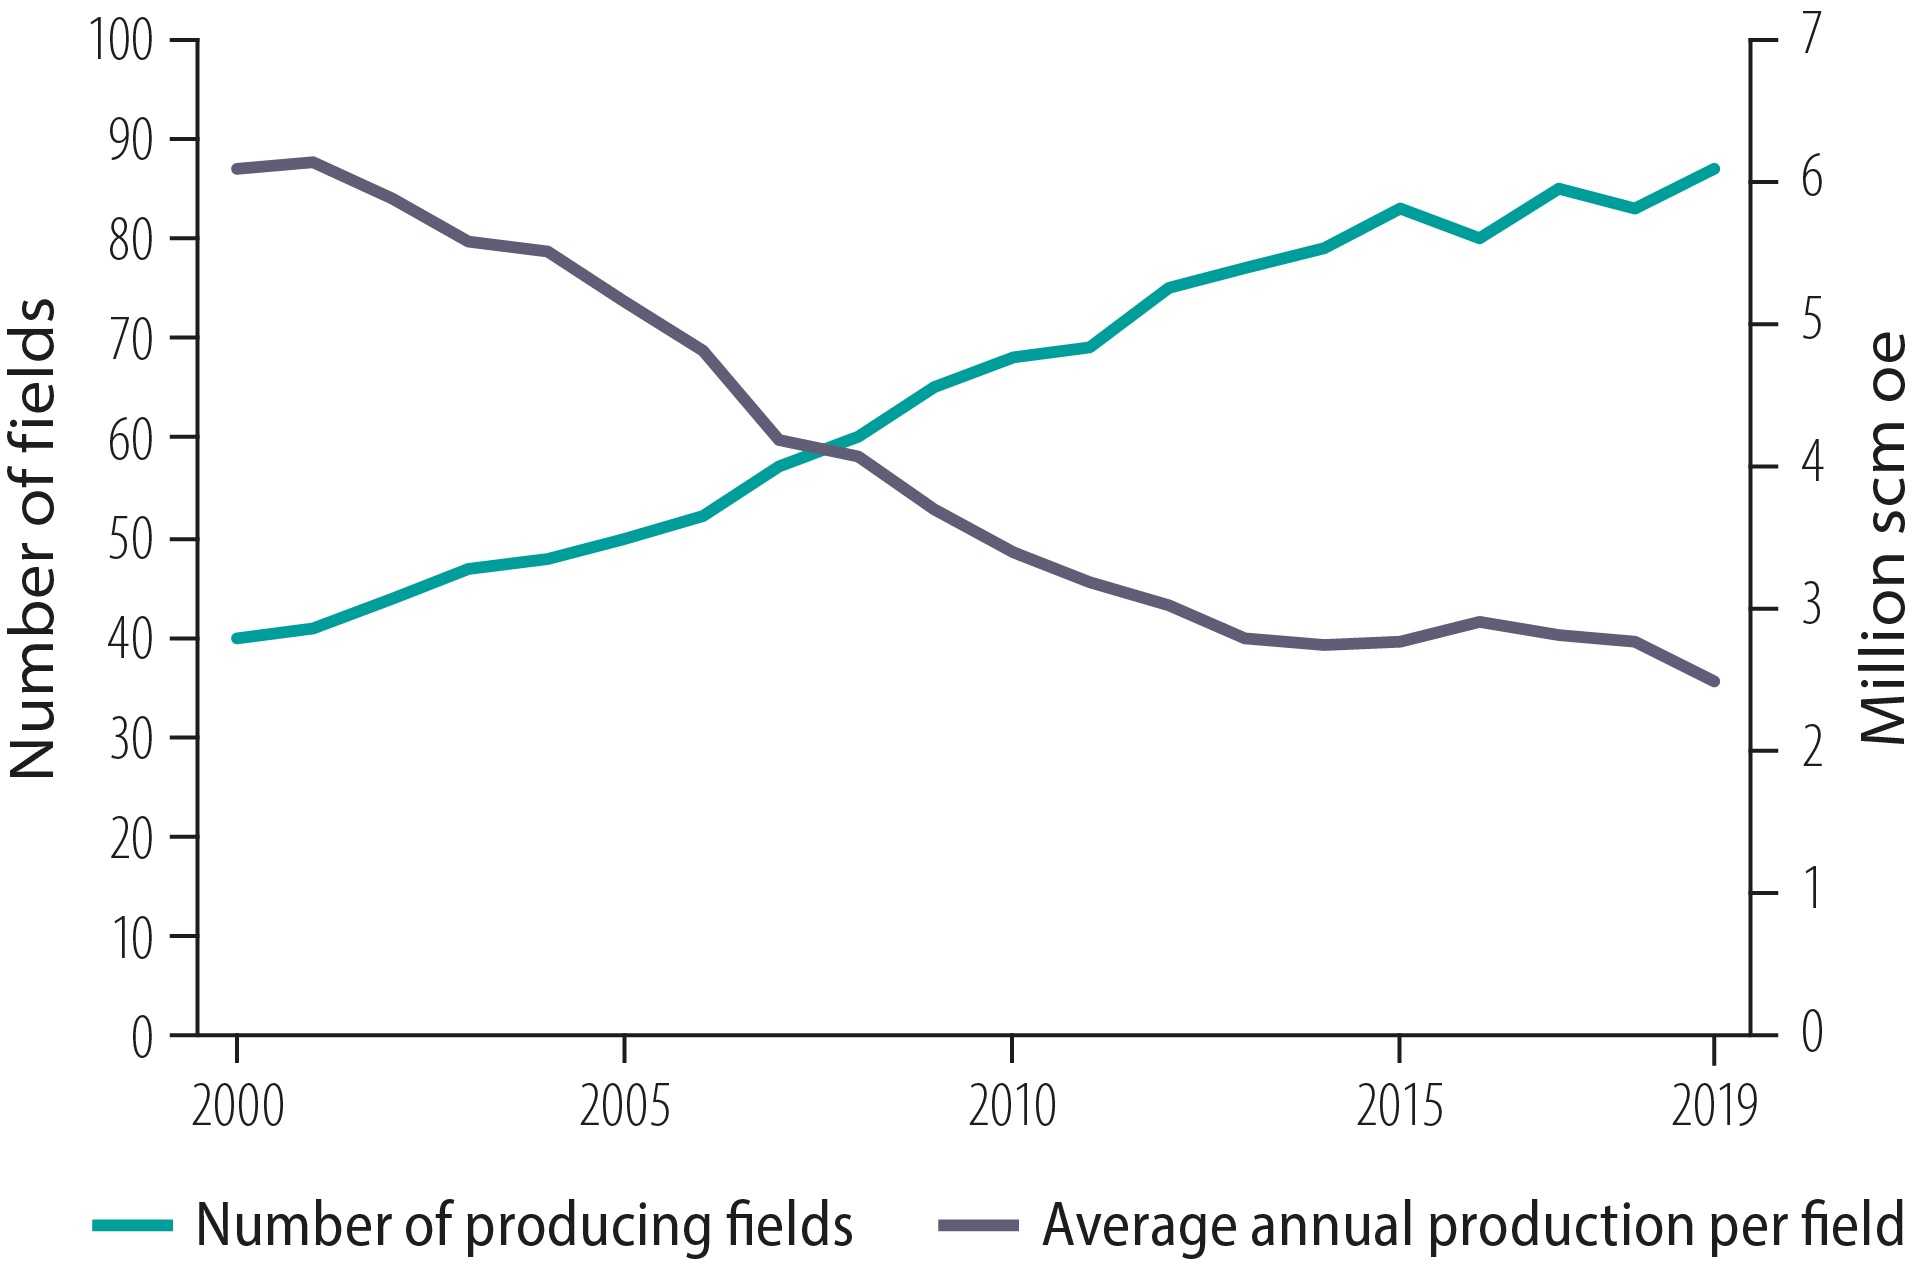
Figure 2.24 Development of producing fields and production per field, 2000-19
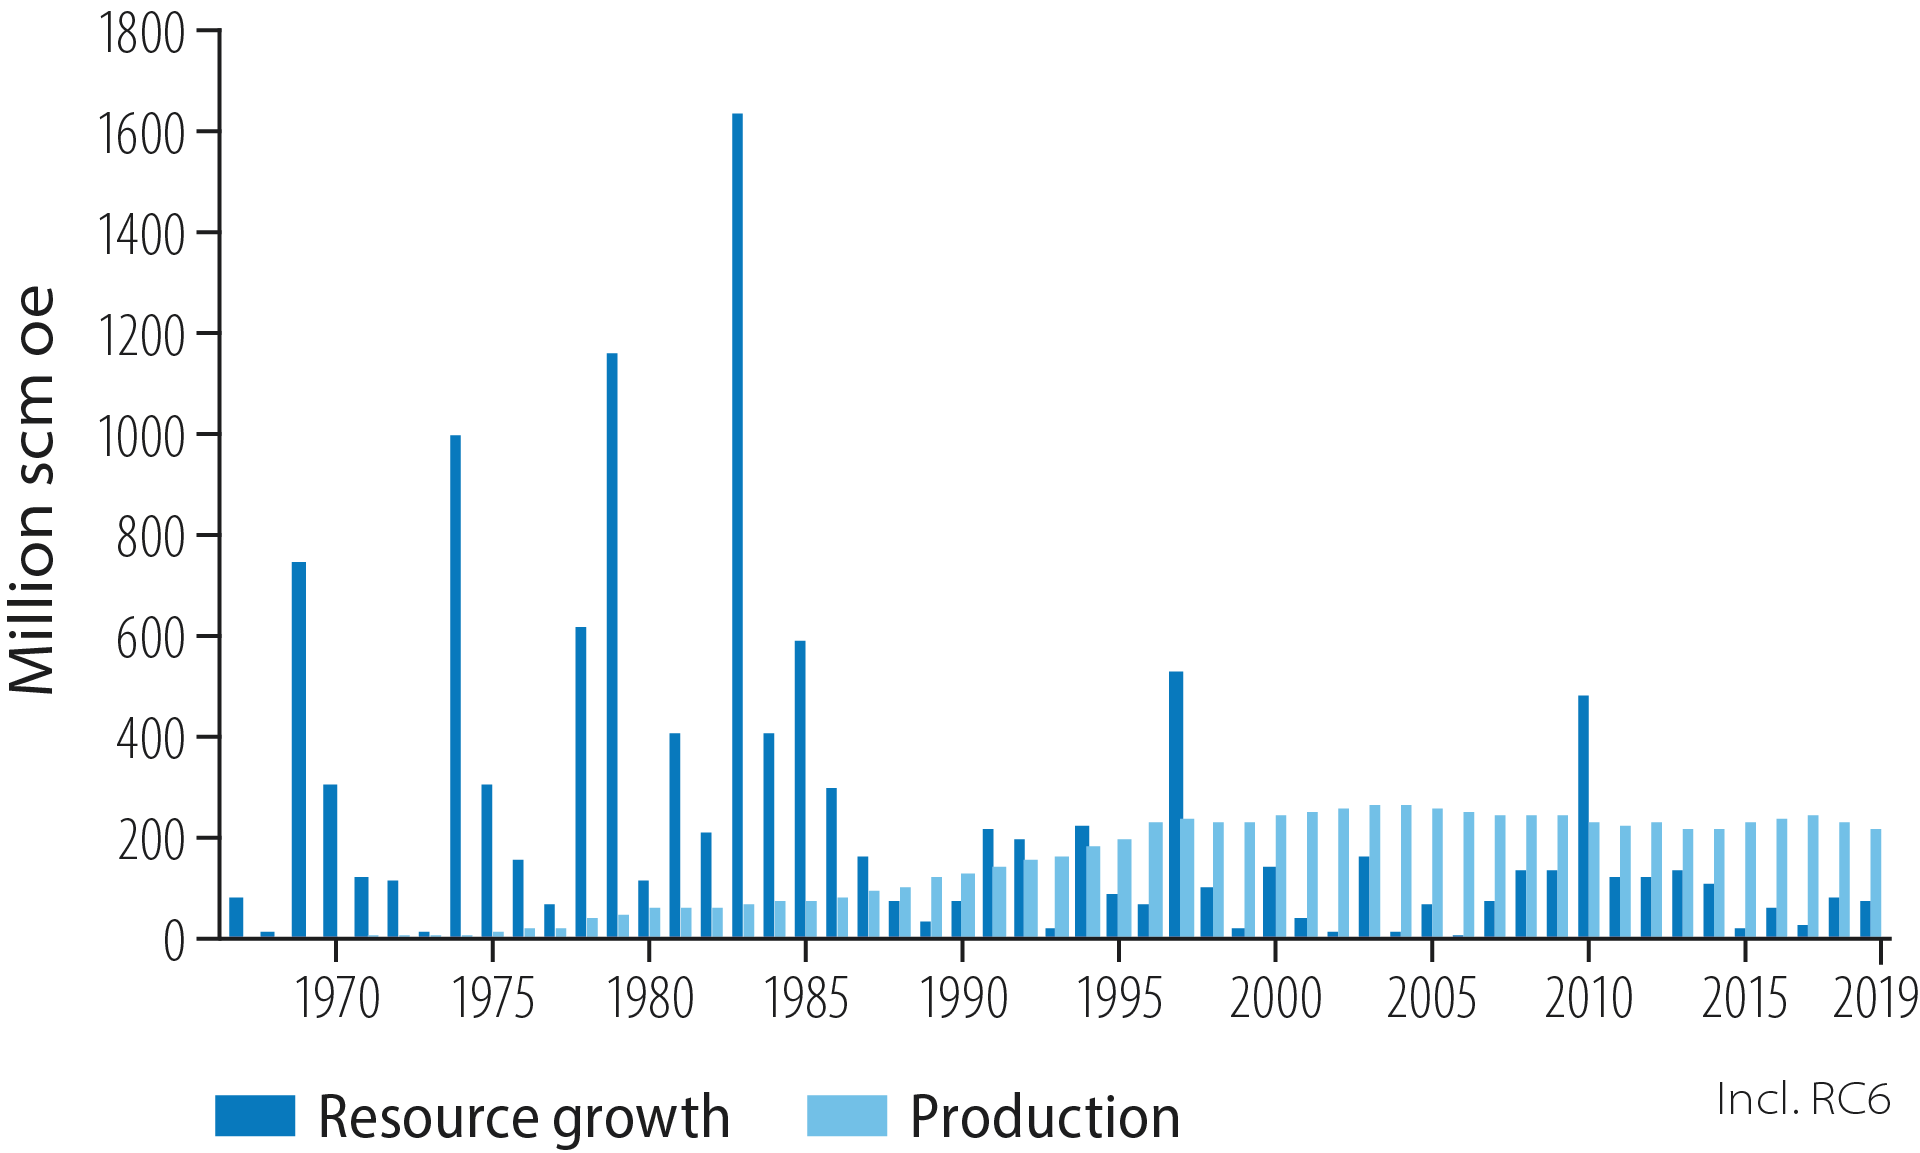
Figure 2.25 Annual resource growth and production
From oil to gas
Total production in 2019 was 214 million scm oe. This represented a slight decline from the year before, primarily because gas output was lower than expected. The companies opted to produce less gas in response to the market position and low prices. While oil accounted for the bulk of production in 2004, more gas than oil has been produced since 2010 (figure 2.28).
Developments in recent years show that output is declining for oil and remains stable for gas. With Johan Sverdrup and other new fields coming on stream, oil production will rise again over the next few years. The NPD estimates that total output of oil and gas in 2023 will be close to the record level set in 2004.
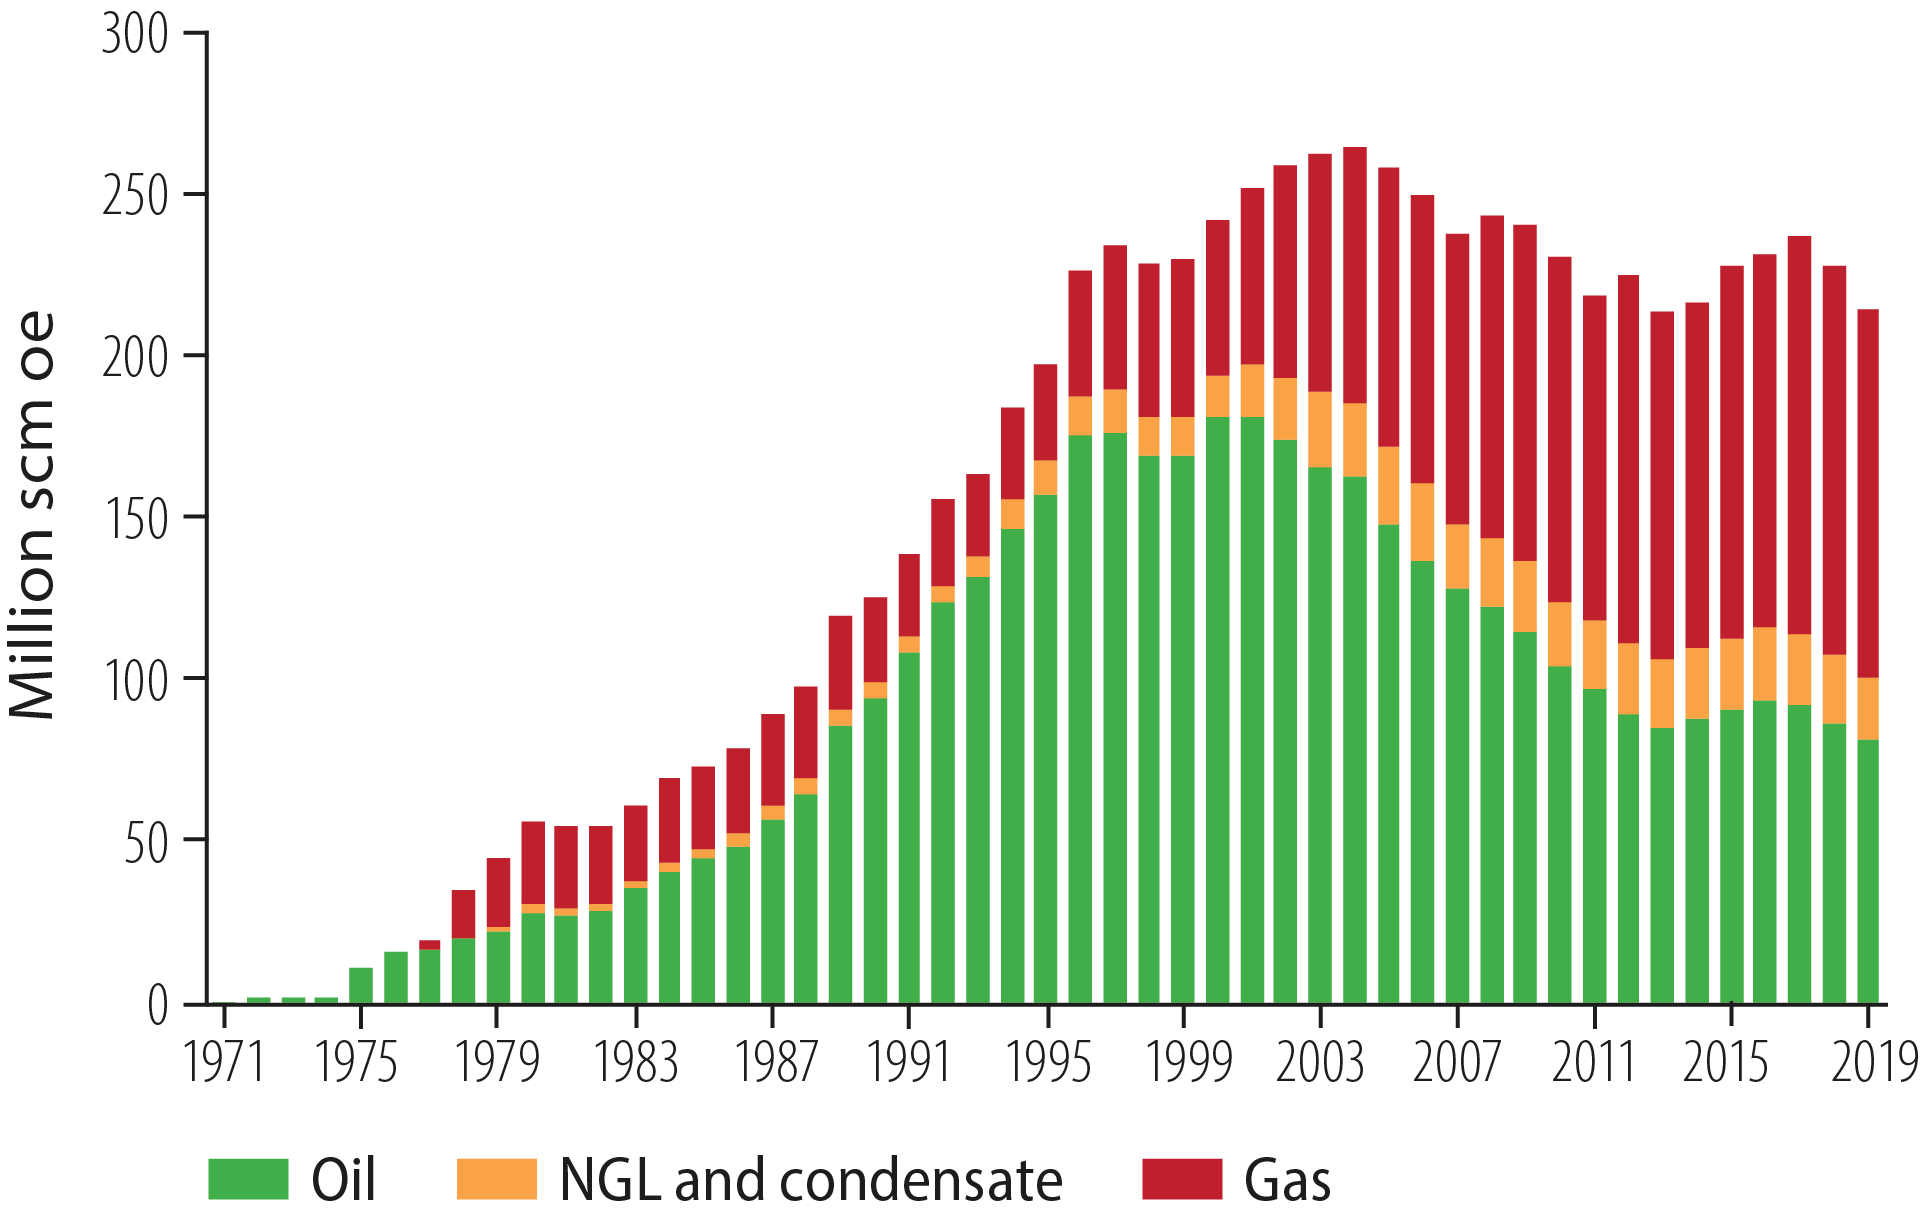
Figure 2.28 Historical production of liquids and gas
The future is undiscovered
Substantial exploration potential
A substantial exploration potential exists in all NCS regions, despite more than 50 years of drilling. Big discoveries are still possible in known and mature areas. In addition comes substantial unexplored acreage. The potential for making large discoveries which can support new infrastructure and contribute to high production is greatest in areas which are underexplored or not open for petroleum activities.
A substantial exploration potential
exists in all regions
Up to 2030, an ever-growing share of production must come from contingent resources in discoveries and fields (already proven) and from undiscovered resources (figure 2.29).
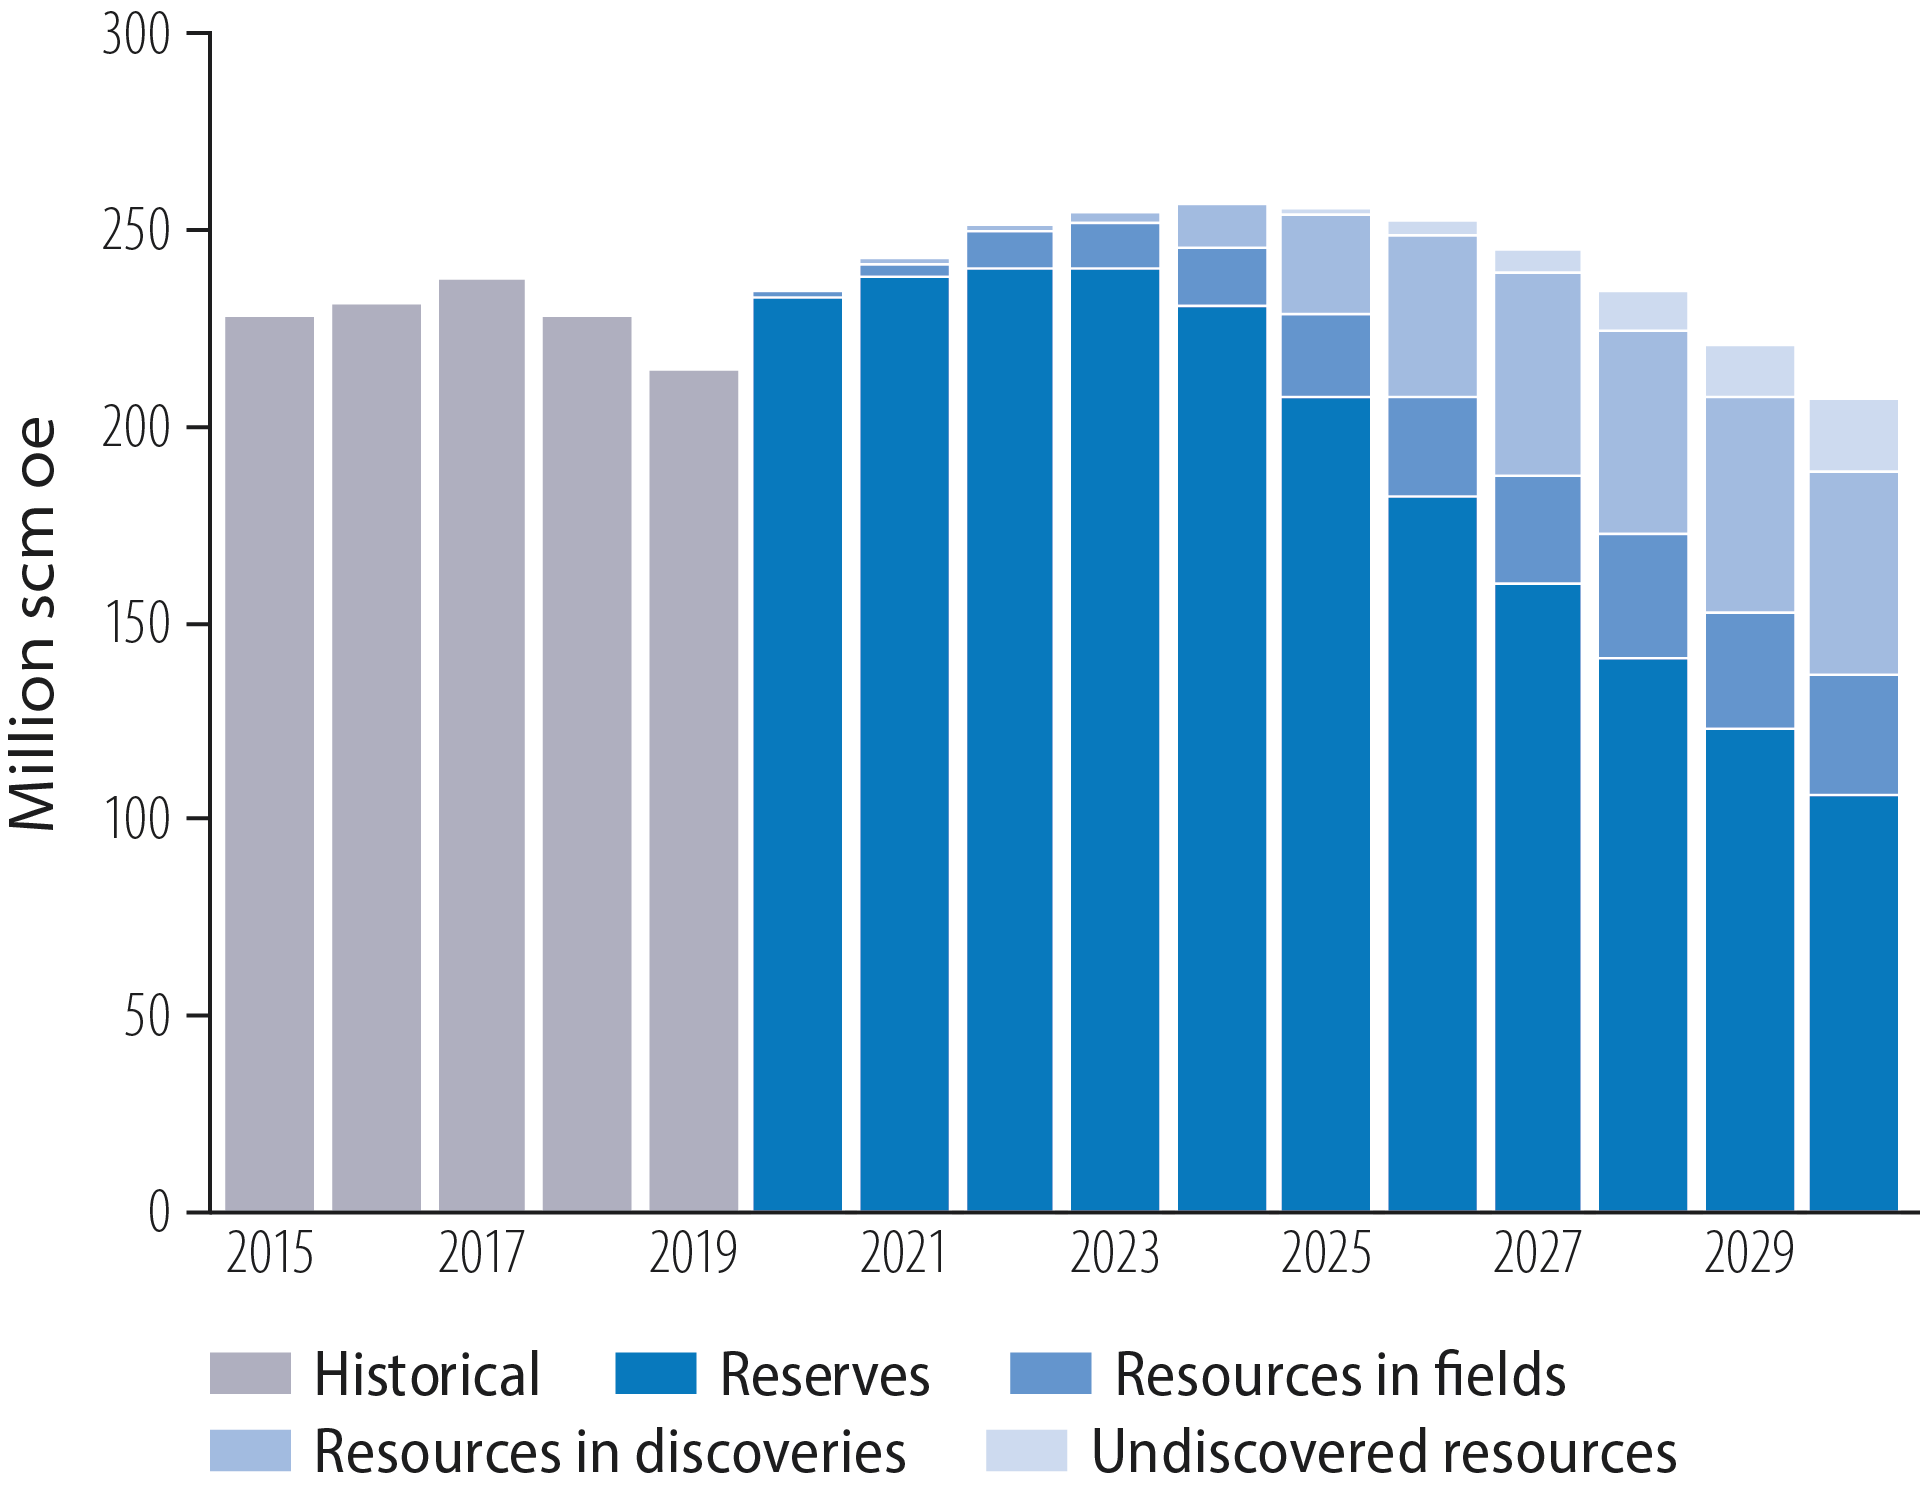
Figure 2.29 Production forecast for the NCS, 2020-30
Regions open for petroleum activities
Undiscovered resources in the areas open for petroleum operations total 685 million scm oe in the North Sea, 470 million in the Norwegian Sea and 1 090 million in the Barents Sea (figure 2.32). One way of illustrating the size of these resources is to compare the potential with the quantities already proven (figure 2.30).
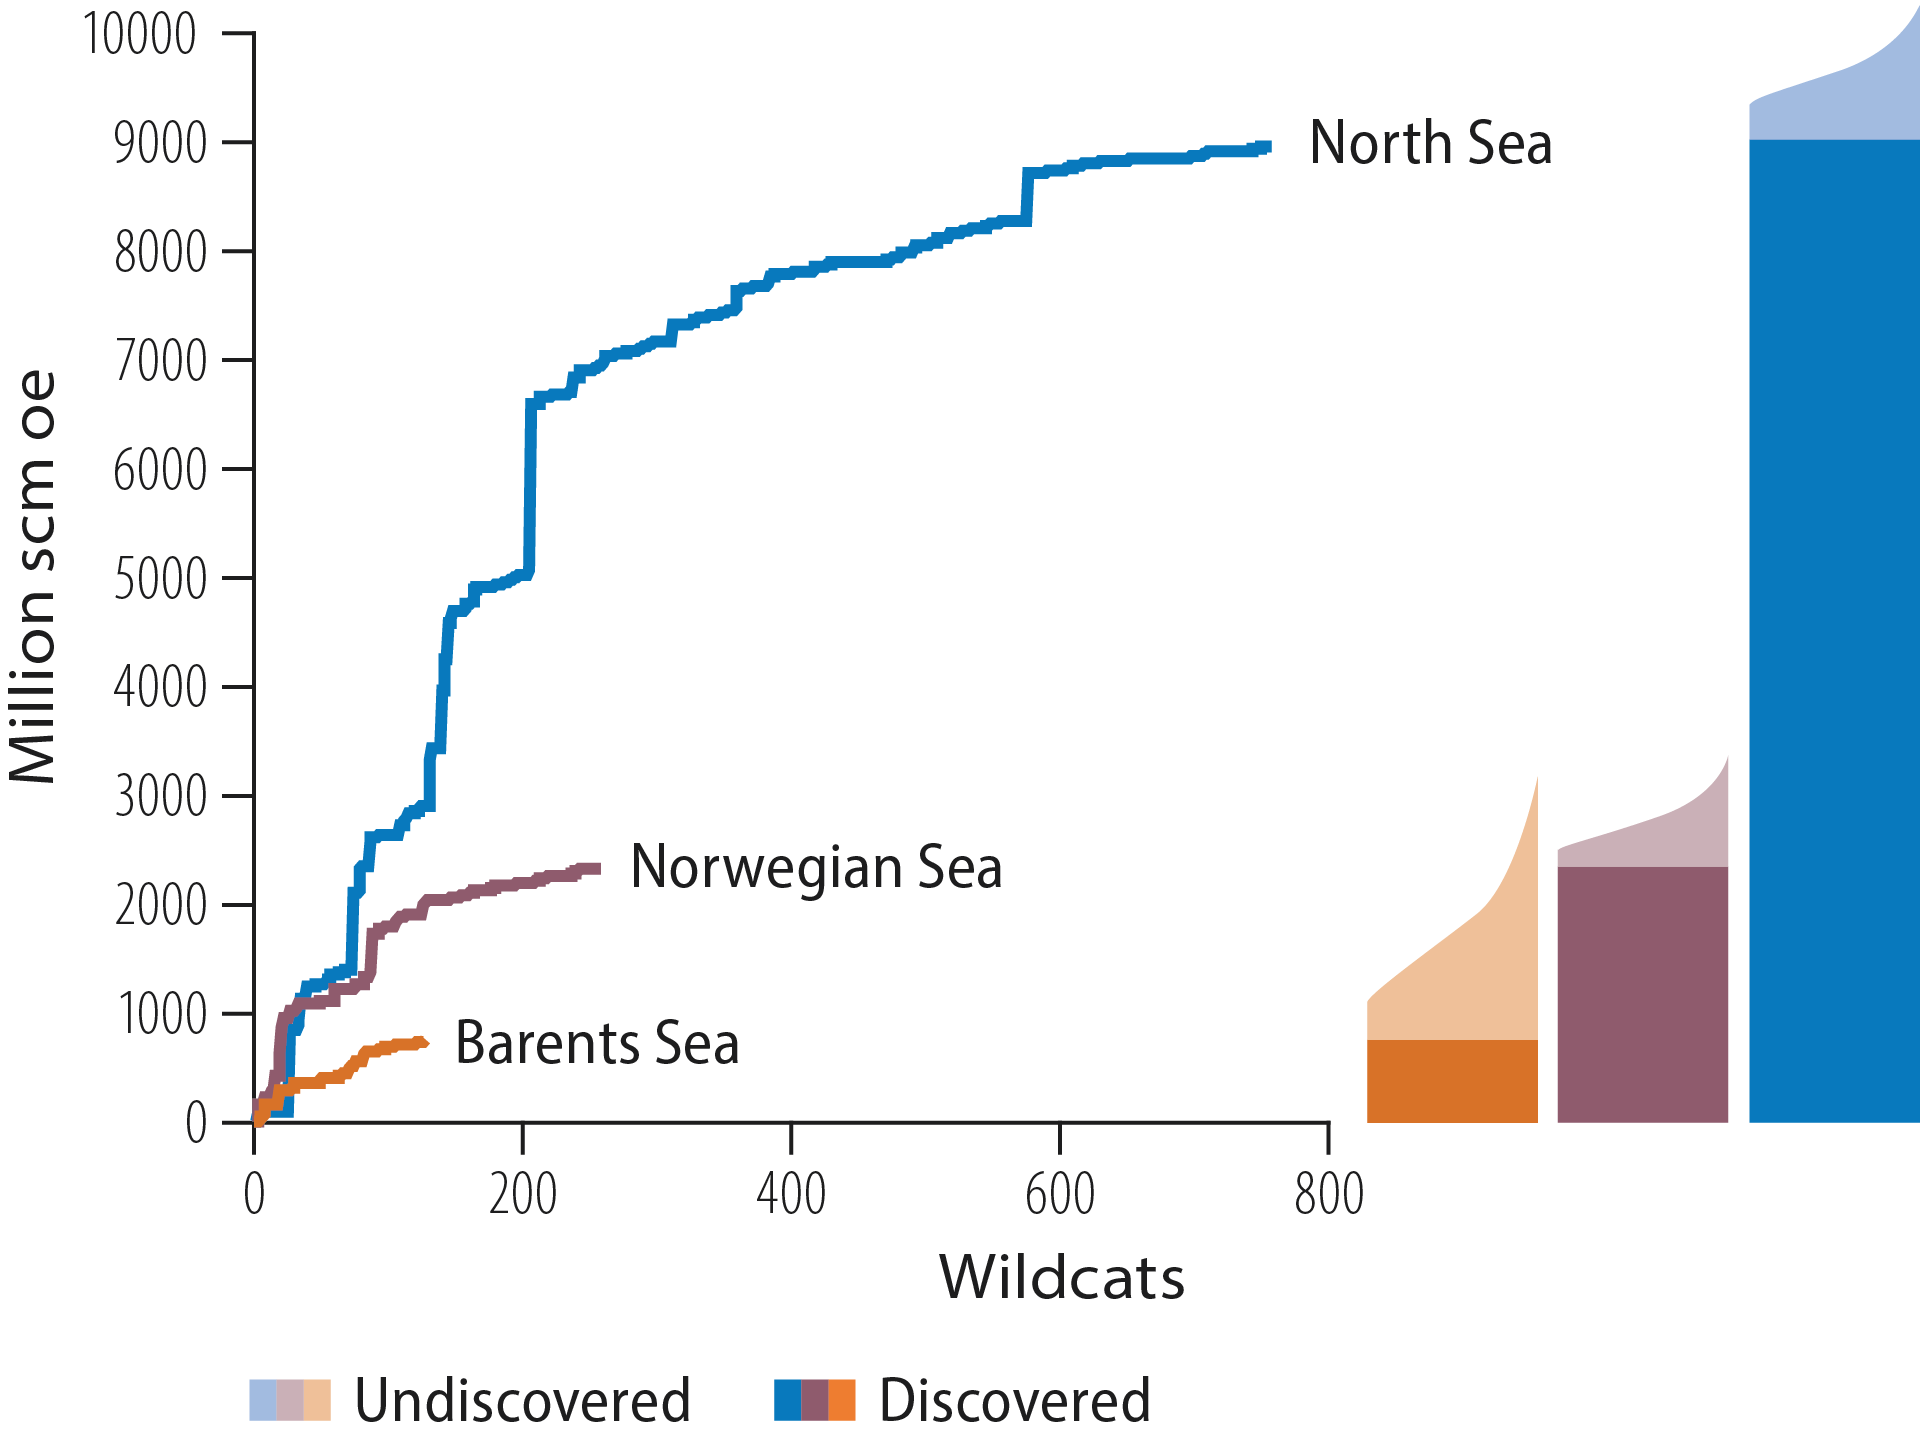
Figure 2.30 Cumulative resources by region. Already proven are shown in dark colours, undiscovered with their uncertainty range in lighter colours.
Less mature areas
Large structures could be concealed beneath the sub-surface basalt on the Vøring and Møre Marginal Highs on the western edge of the Norwegian Sea (figure 2.31). Securing good seismic images beneath basalt has proved difficult, and new technology is important for clarifying this potential.
The less mature parts of Barents Sea South still contain large areas with a substantial potential. During recent years, the NPD has evaluated the potential for gas in several younger plays on the western side of this region.
Several discoveries have been made in recent years on the Bjarmeland Platform north of 7324/8-1 (Wisting). The 7324/6-1 (Sputnik) and 7324/3-1 (Intrepid Eagle) discoveries, of oil and gas respectively, show that the Upper Triassic play could have a substantial potential. This is particularly the case at the northern end of the platform. The play extends into Barents Sea North. The NPD’s mapping in the latter area also reveals the presence of large carbonate build-ups, or reef structures, which could contain petroleum accumulations. These extend into the northern Bjarmeland Platform.
With a diameter of 45 kilometres, the Mjølnir Impact Crater in the central part of the platform was formed by a meteorite impact. One of the largest unexplored structures in this part of the Barents Sea lies here.
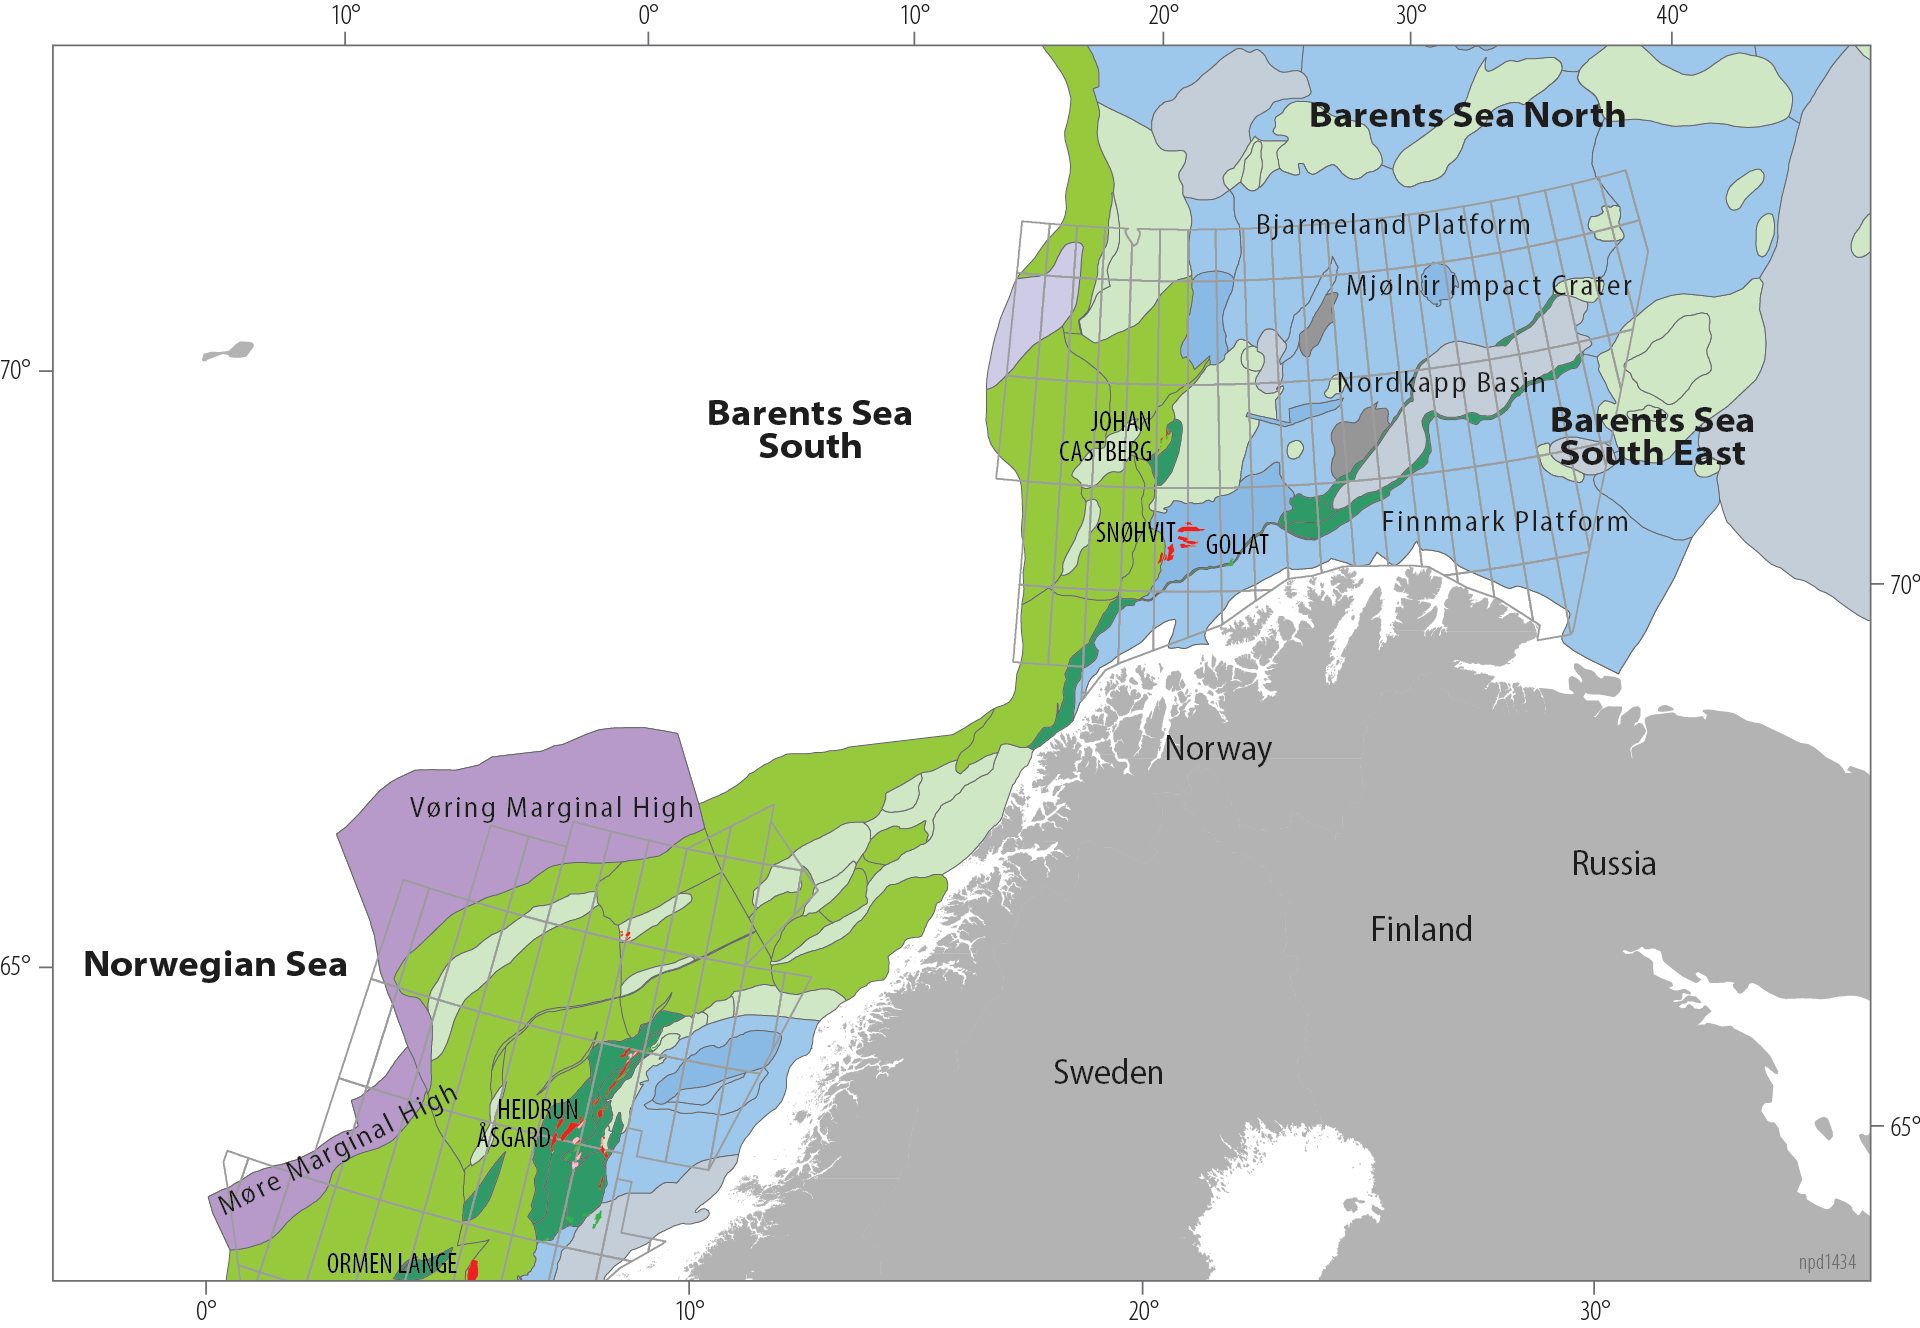
Figure 2.31 Map of the structural elements mentioned
Wells drilled so far in the south-eastern Barents Sea have yielded disappointing results for Jurassic and Triassic plays. The area still has unexplored plays, such as those with carbonate reservoirs.
In addition, a potential could exist along the flanks of and in the actual Nordkapp Basin, which has still not been explored. A potential for oil in Carboniferous and Permian plays could exist in areas close to shore on the Finnmark Platform off eastern Finnmark.
Areas not open for petroleum activities
Large areas still exist with a substantial resource potential which are not open for petroleum activities (figure 2.32). About 40 per cent of the undiscovered resources lie in these areas. Resources yet to be found in the North Sea are primarily located in open areas. Unopened parts of the Norwegian and Barents Seas contain roughly 35 and 55 per cent respectively of their undiscovered resources.
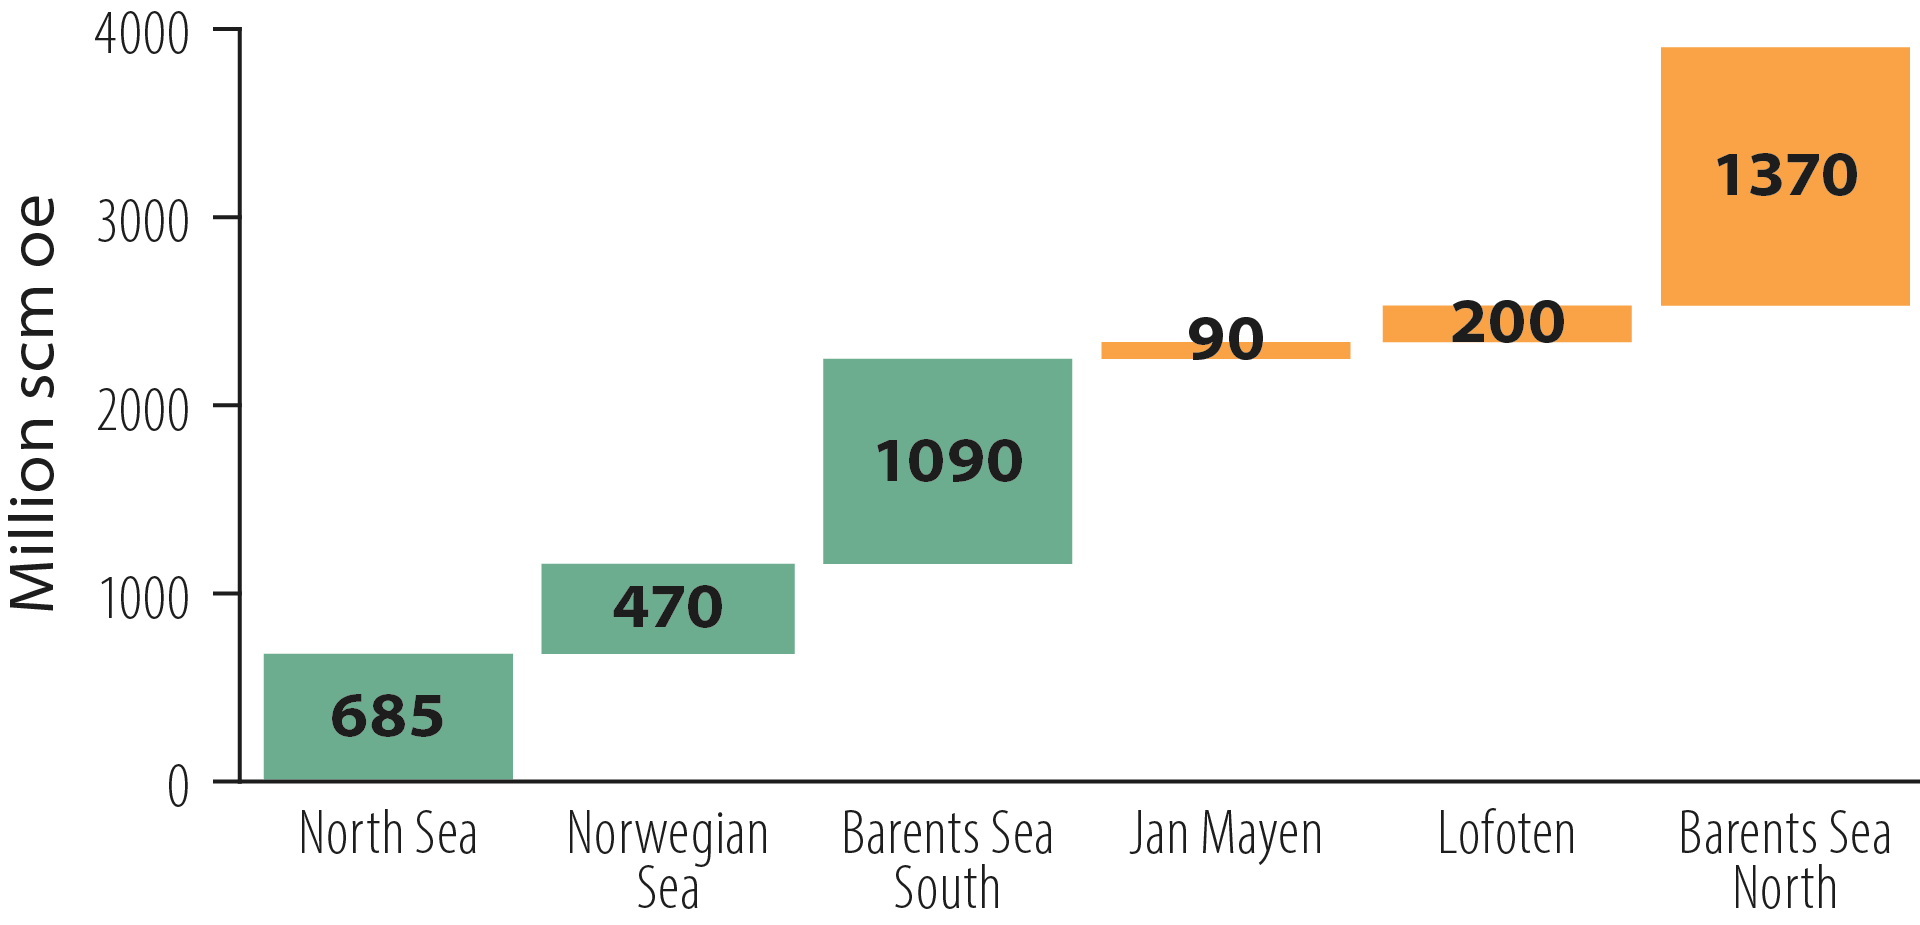
Figure 2.32 Undiscovered resources by open and unopened areas
Large resource potential in areas not
open for petroleum activities
Political decisions are required to open new areas. Only the government is able to acquire information from these parts of the NCS and map them. In 2018-19, the NPD acquired 2D and 3D seismic data and drilled shallow scientific wells in Barents Sea North as part of a systematic multi-year effort to learn more about the northernmost parts of the NCS (figure 2.33).
These data provide important geological information and form a significant part of the basis for estimating resources. Mapping has revealed large structures which may contain oil or gas (figure 2.34). This is the part of the NCS with the biggest potential petroleum accumulations today (see chapter 3).
Estimates of undiscovered resources in areas not open for petroleum activities are very uncertain owing to limited data coverage and the absence of exploration wells. Continued data acquisition is required in coming years to improve understanding of the petroleum potential and to reduce uncertainty in the estimates. This is important both for good resource management and for protecting national economic interests related to potential cross-border accumulations.
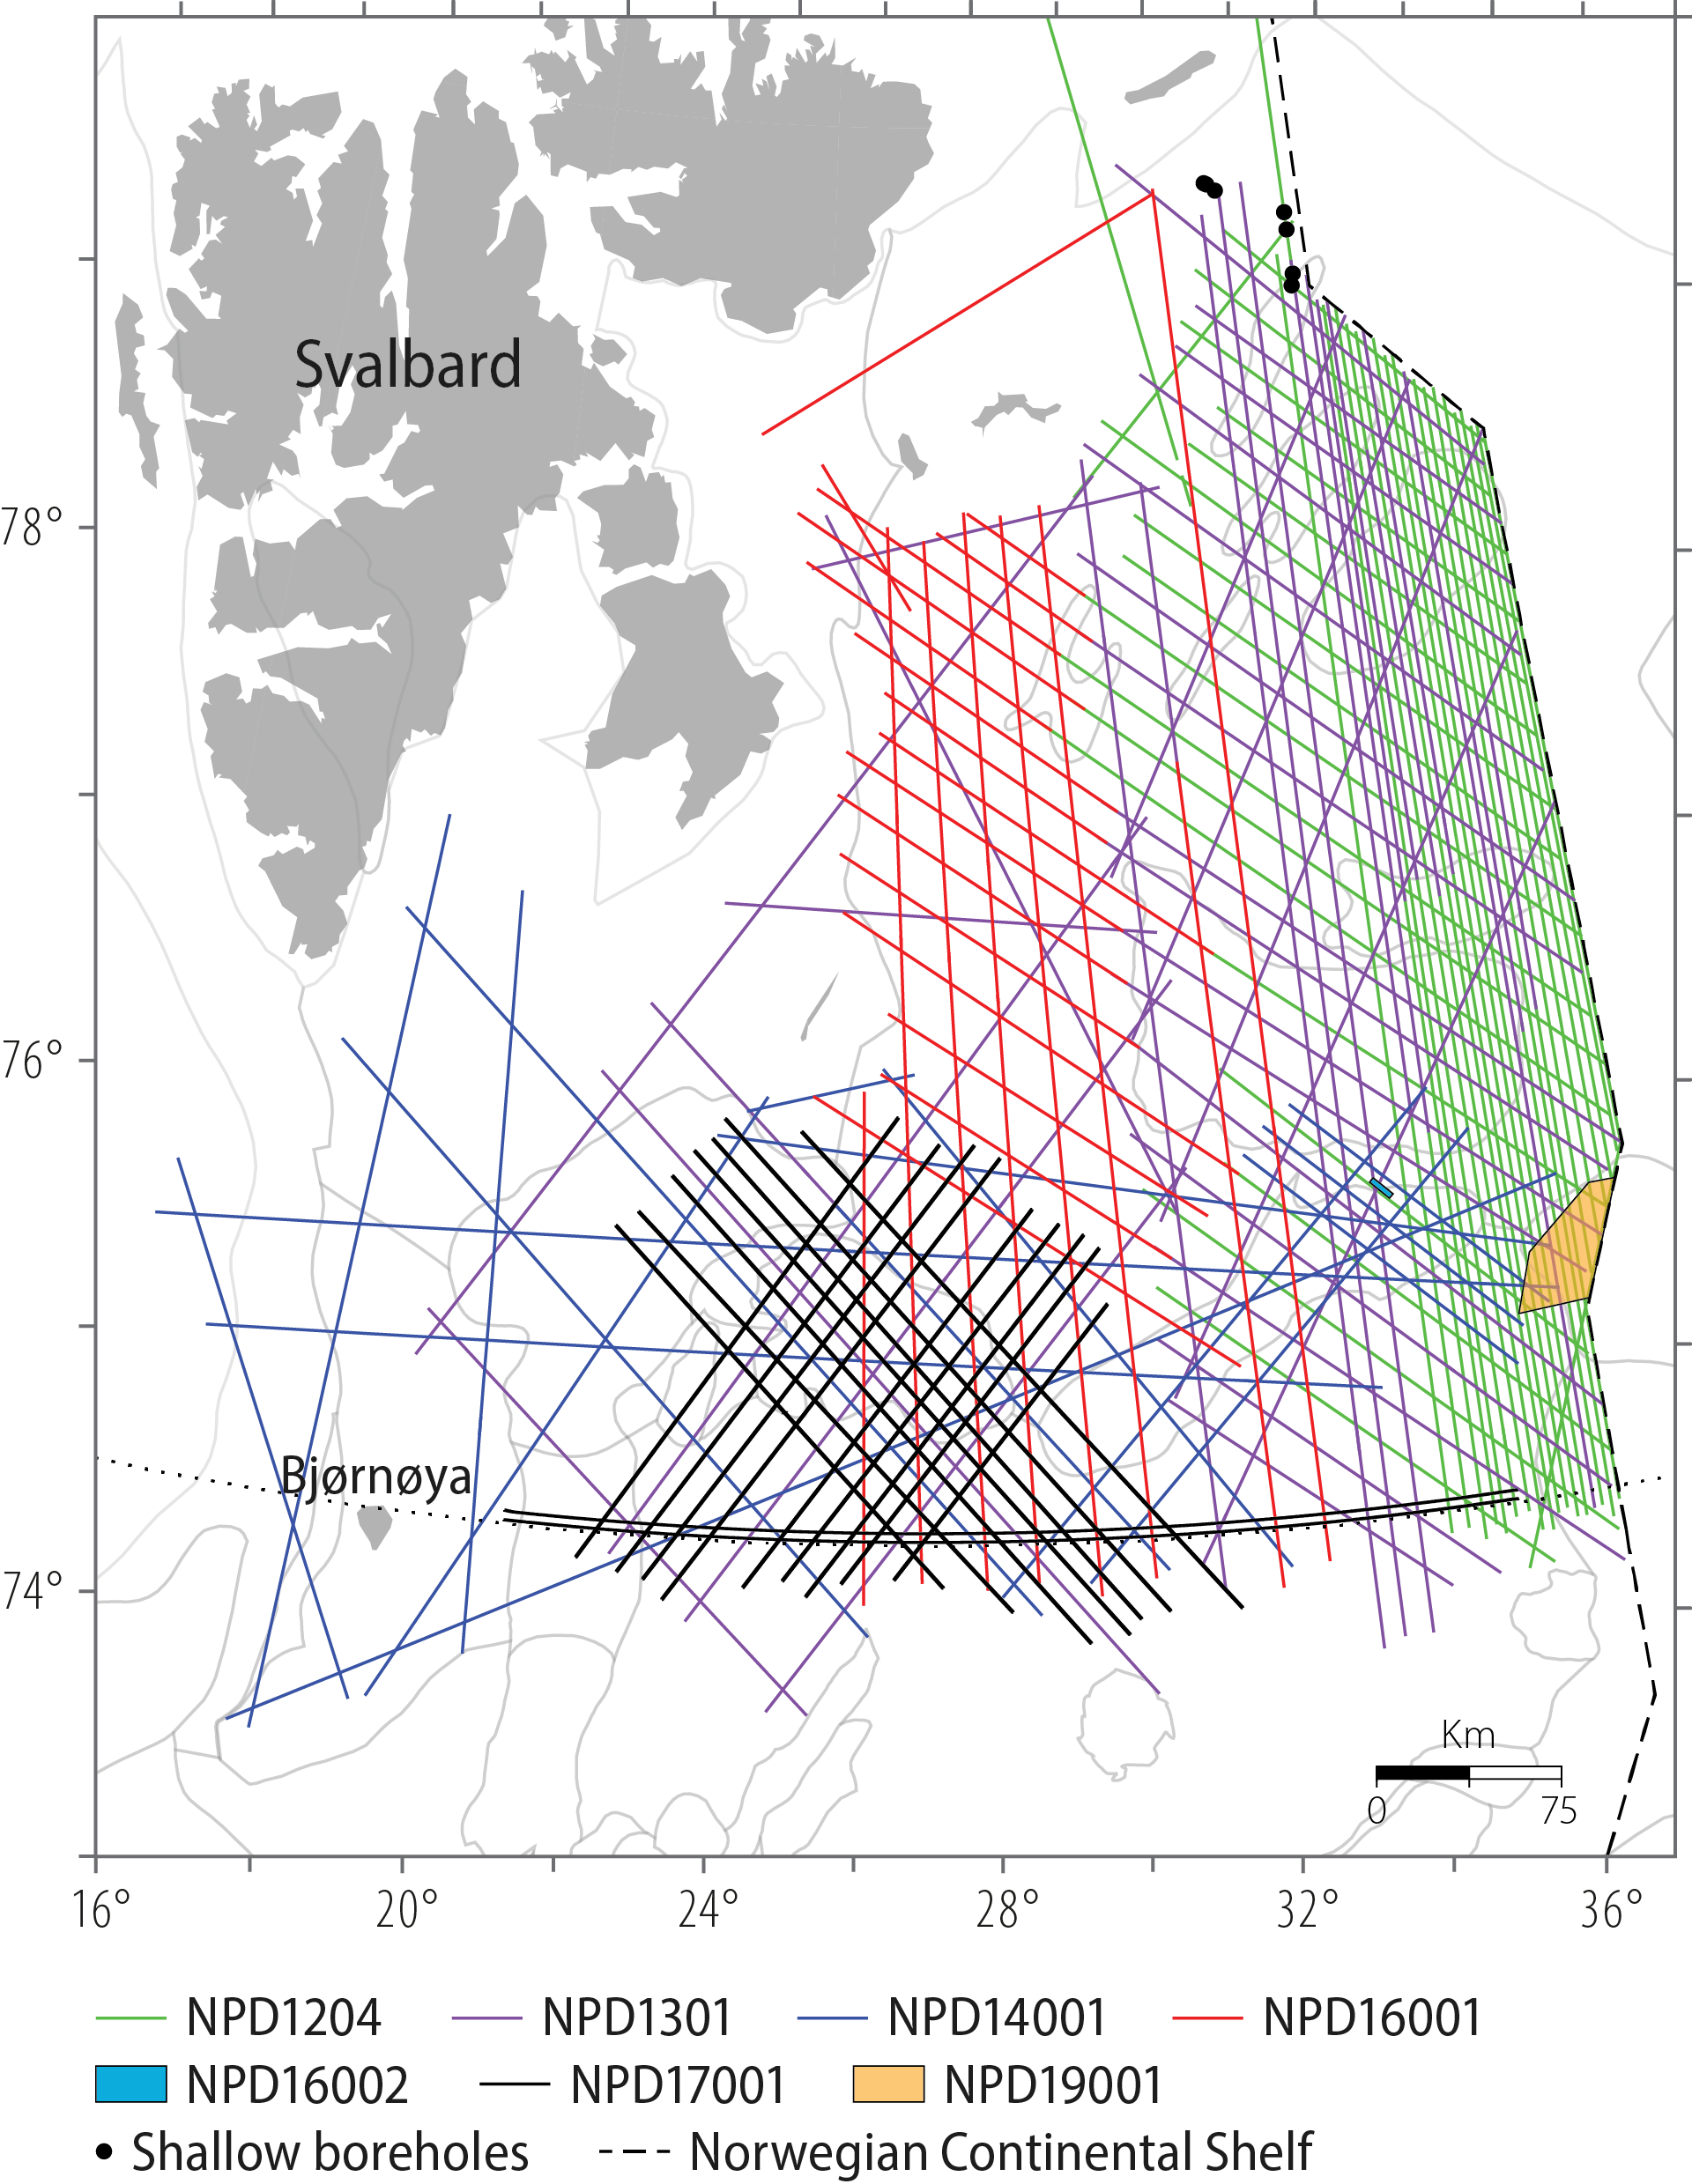
Figure 2.33 NPD data acquisition in Barents Sea North, 2012-19
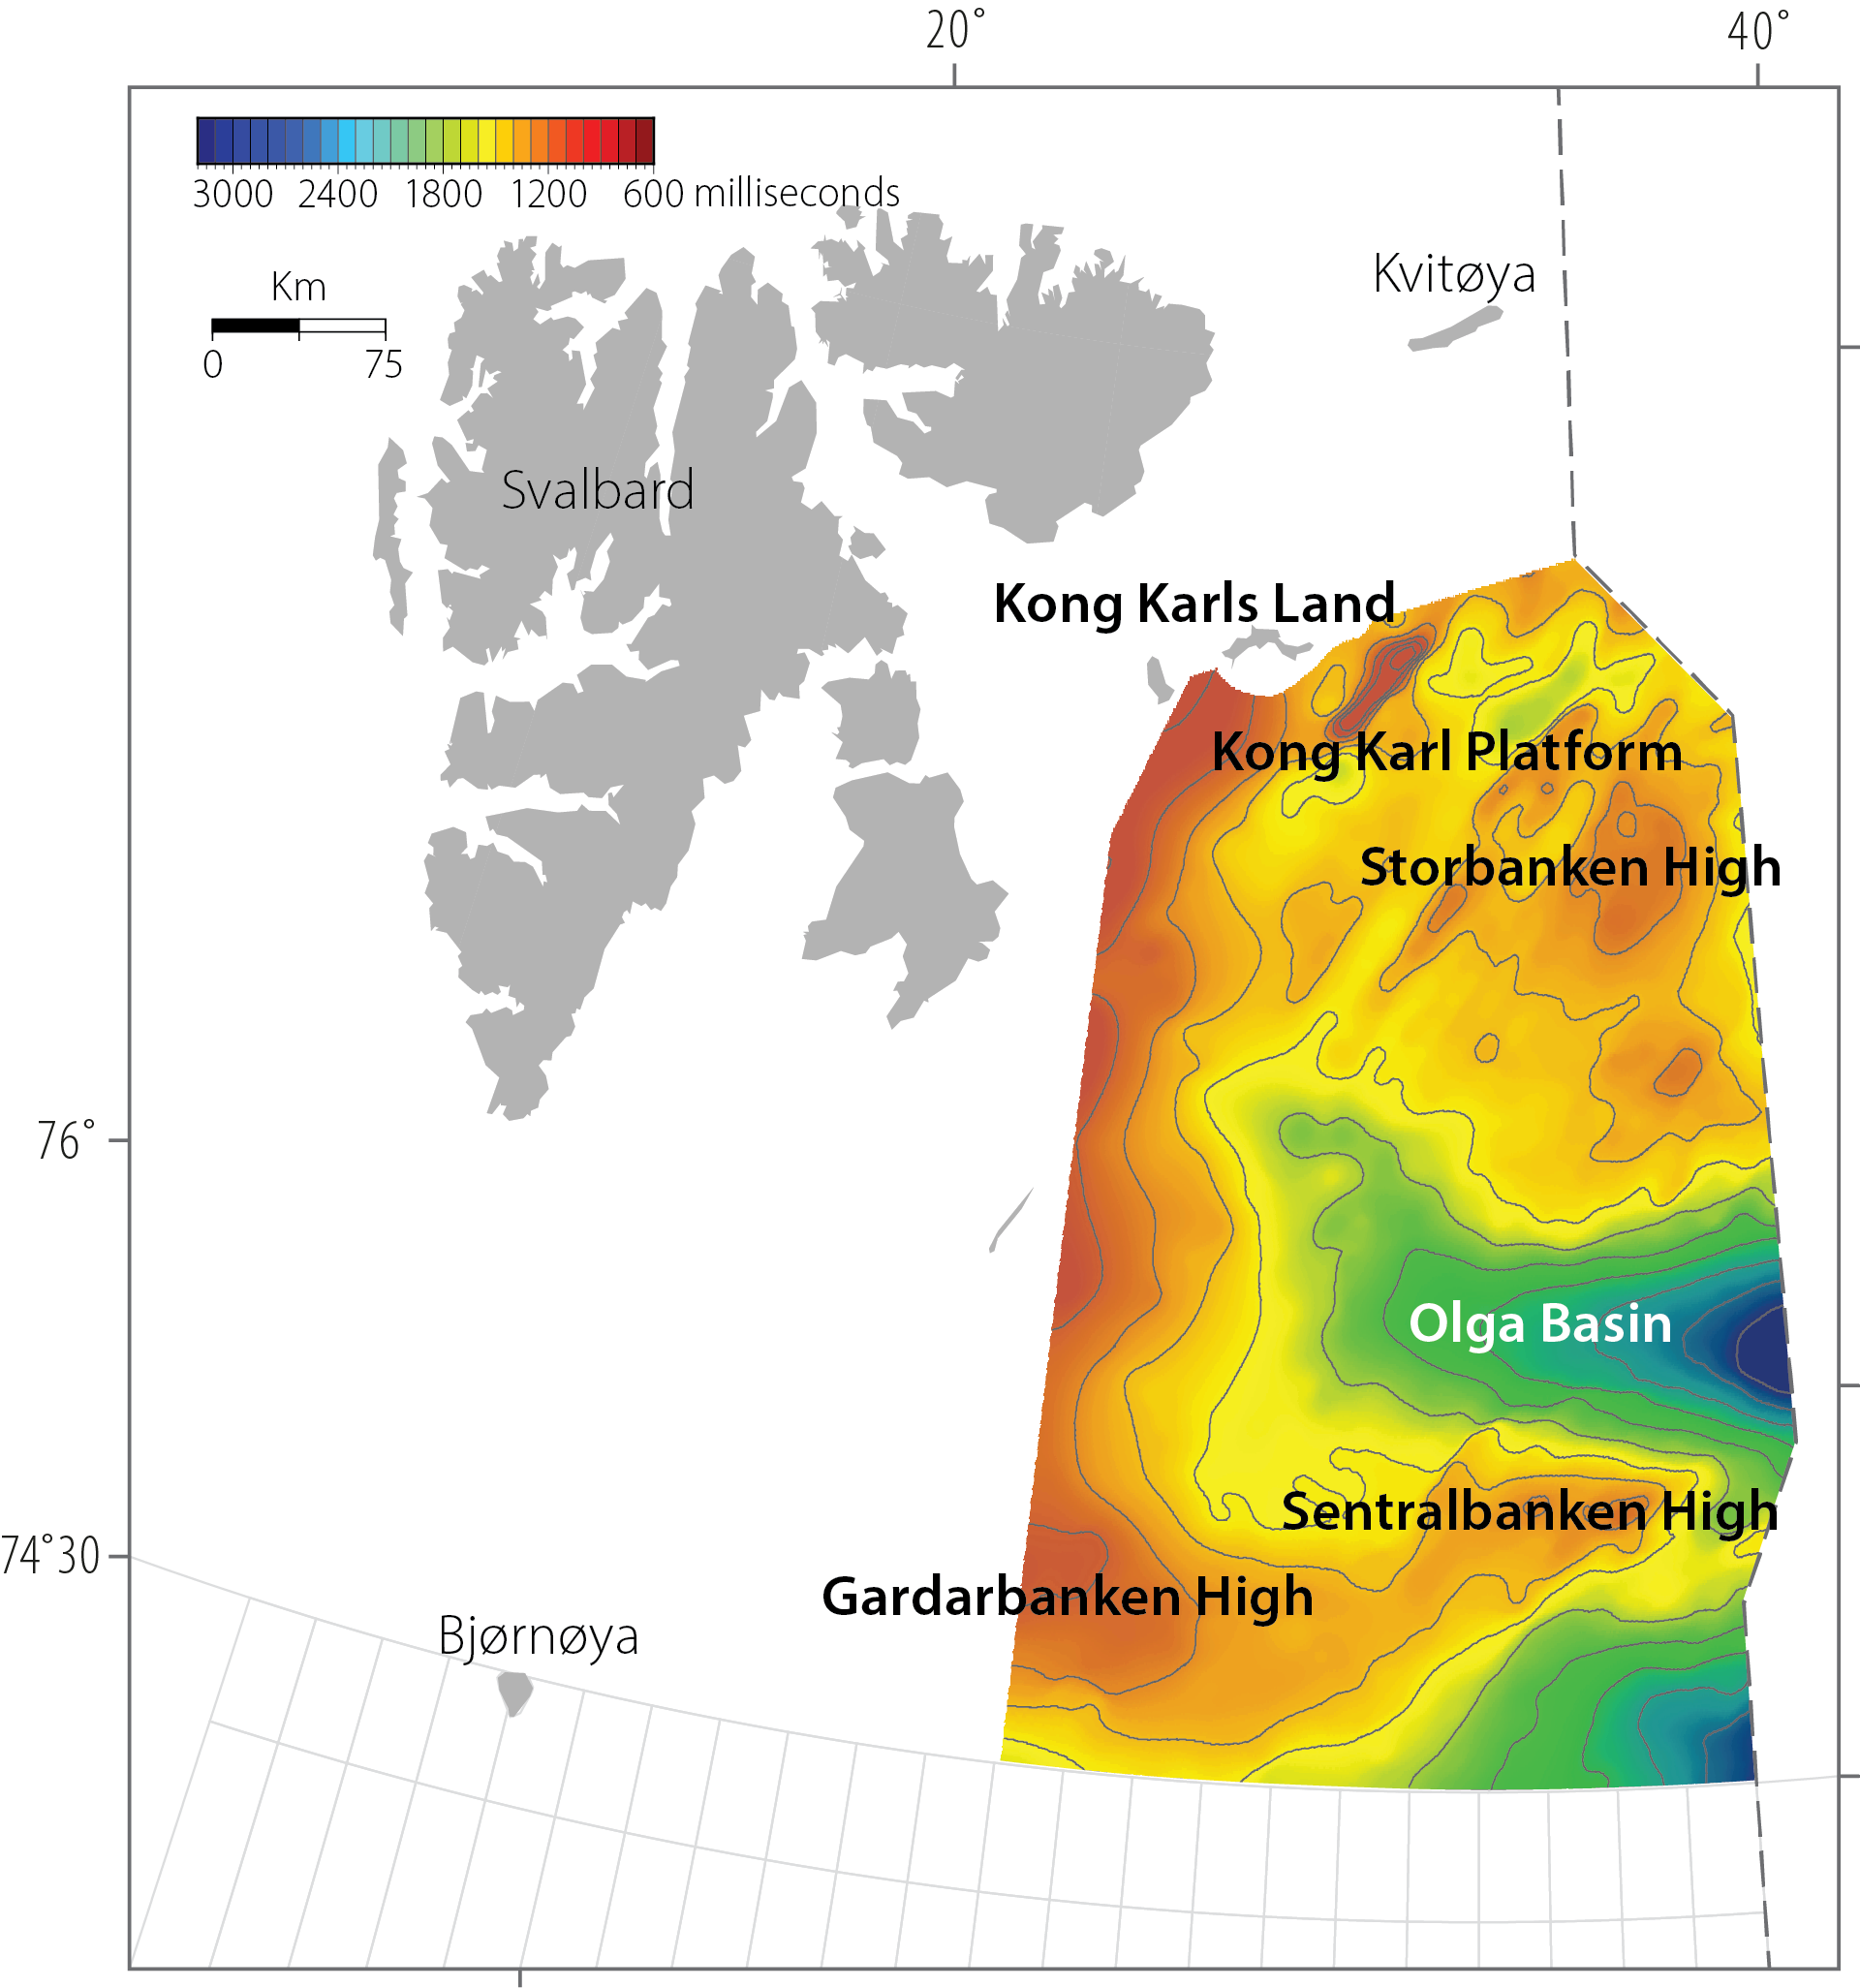
Figure 2.34 Large structures and the extent of mapped areas in Barents Sea North. Time contour map, top Permian