4 – Significance of exploration
Exploration for oil and gas has provided huge value for Norwegian society over the past 20 years. All areas of the NCS make important contributions to overall value creation.
New discoveries provide the basis for continued activity in the petroleum industry, create big spin-offs for the rest of society, and will be extremely important for future value creation.
The basis for discovering and maturing oil and gas resources is laid through technical sub-surface work, primarily in the geosciences. Continuous progress in this discipline is supplemented by new technologies and work processes.
Technical studies include understanding where and how oil and gas form, move, accumulate in traps and become retained in sub-surface reservoirs. A lengthy and exacting process may underlie a decision to drill a wildcat. If that makes and confirms a commercial discovery, this is developed with a production facility. When the field comes on stream, it generates the revenues which will cover the costs incurred, the capital spending made and the further investment required.
The analyses presented in this chapter show that investment in petroleum exploration on the NCS has been highly profitable and provided huge value for Norwegian society. In addition to oil and gas revenues, exploration lays the basis for employment and spin-offs in the rest of the national economy.
Oil and gas exploration
has provided huge value
for the Norwegian society
At the same time, the analyses indicate that exploration over the past 20 years has contributed to keeping production high. New discoveries have helped to ensure that existing fields can remain on stream.
Without new resources, unit costs on fields would rise and profitability decline as output fell. That makes exploration a precondition for field development and petroleum production. Maintaining output and value creation in the long term depends on a high and continuous level of exploration.
Profitability of exploration
The NPD has calculated the profitability of exploring the NCS from 2000 to 2019. These calculations present direct economic value creation from exploration during the period. This activity has been more profitable over the past 10 years than in the previous decade, and all regions of the NCS have made important contributions to overall value creation.
Large discoveries have been important for establishing infrastructure. Exploiting cost-effective existing facilities also permits profitable development of small discoveries. In addition, the NPD’s calculations show that, even if oil prices remain low in coming years, it has been profitable to explore for oil and gas.
Exploration has been more profitable
over the past 10 years
than in the previous decade
Exploration activity and costs in 2000-19
Exploration on the NCS over the past 20 years has been characterised by big fluctuations (figure 4.1). Eight hundred exploration wells were spudded in 2000-19, including 550 wildcats. Over the same period, some NOK 400 billion (2020 value) was invested in exploration (figure 4.2). That gives an annual average of 40 wells and NOK 20 billion in investment. The oil price has averaged about USD 65 per barrel (bbl) over the past 20 years, but with substantial fluctuations.
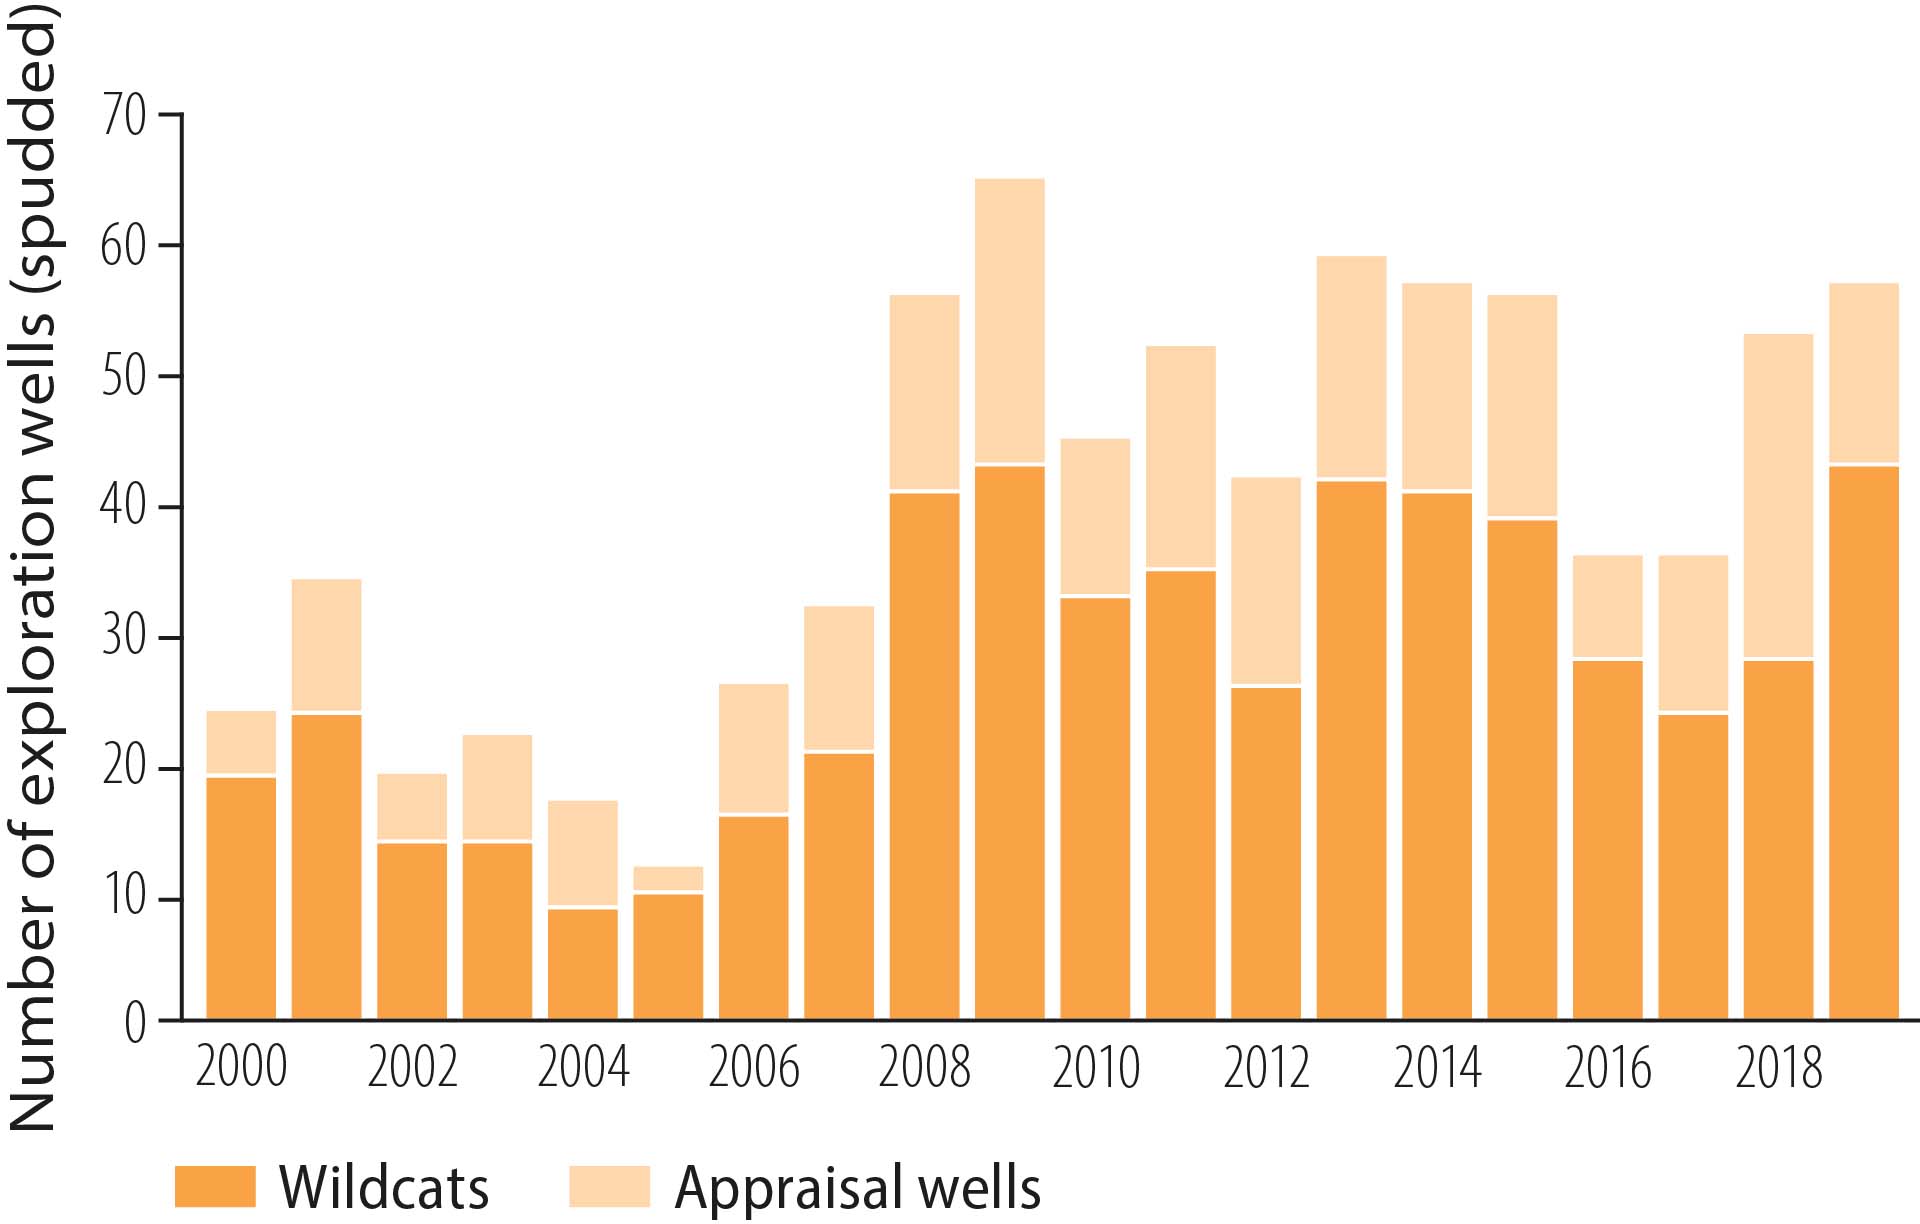
Figure 4.1 Wildcats and appraisal wells, 2000-19
Measured by wells spudded, exploration declined from the end of the 1990s and was at its lowest ebb in 2005 with 12 wells. Targeted government measures and rising oil prices led to a substantial upturn, and 65 exploration wells were drilled in 2009 (figure 4.1). Sustained high oil prices and levels of activity contributed to a considerable rise in costs.
Measures were therefore initiated by the companies to reduce these, enhance operating efficiency and limit capital investment. The oil price slump in 2014 reinforced the need for cost cuts and capital rationalisation, which led to a sharp drop in exploration investment in 2016 and 2017. Activity recovered again in the past two years in line with rising oil prices.
Exploration costs comprise spending incurred from the date a production licence is awarded until a possible discovery is developed, and covers seismic surveying, exploration wells, field evaluation and administration.
Company-related exploration expenditure, primarily in the pre-licence phase, is excluded. Drilling (figure 4.1) represents the most important single element in overall exploration spending. Drilling costs totalled almost NOK 280 billion in 2000-19, comprising about 70 per cent of the total amount spent (figure 4.2).
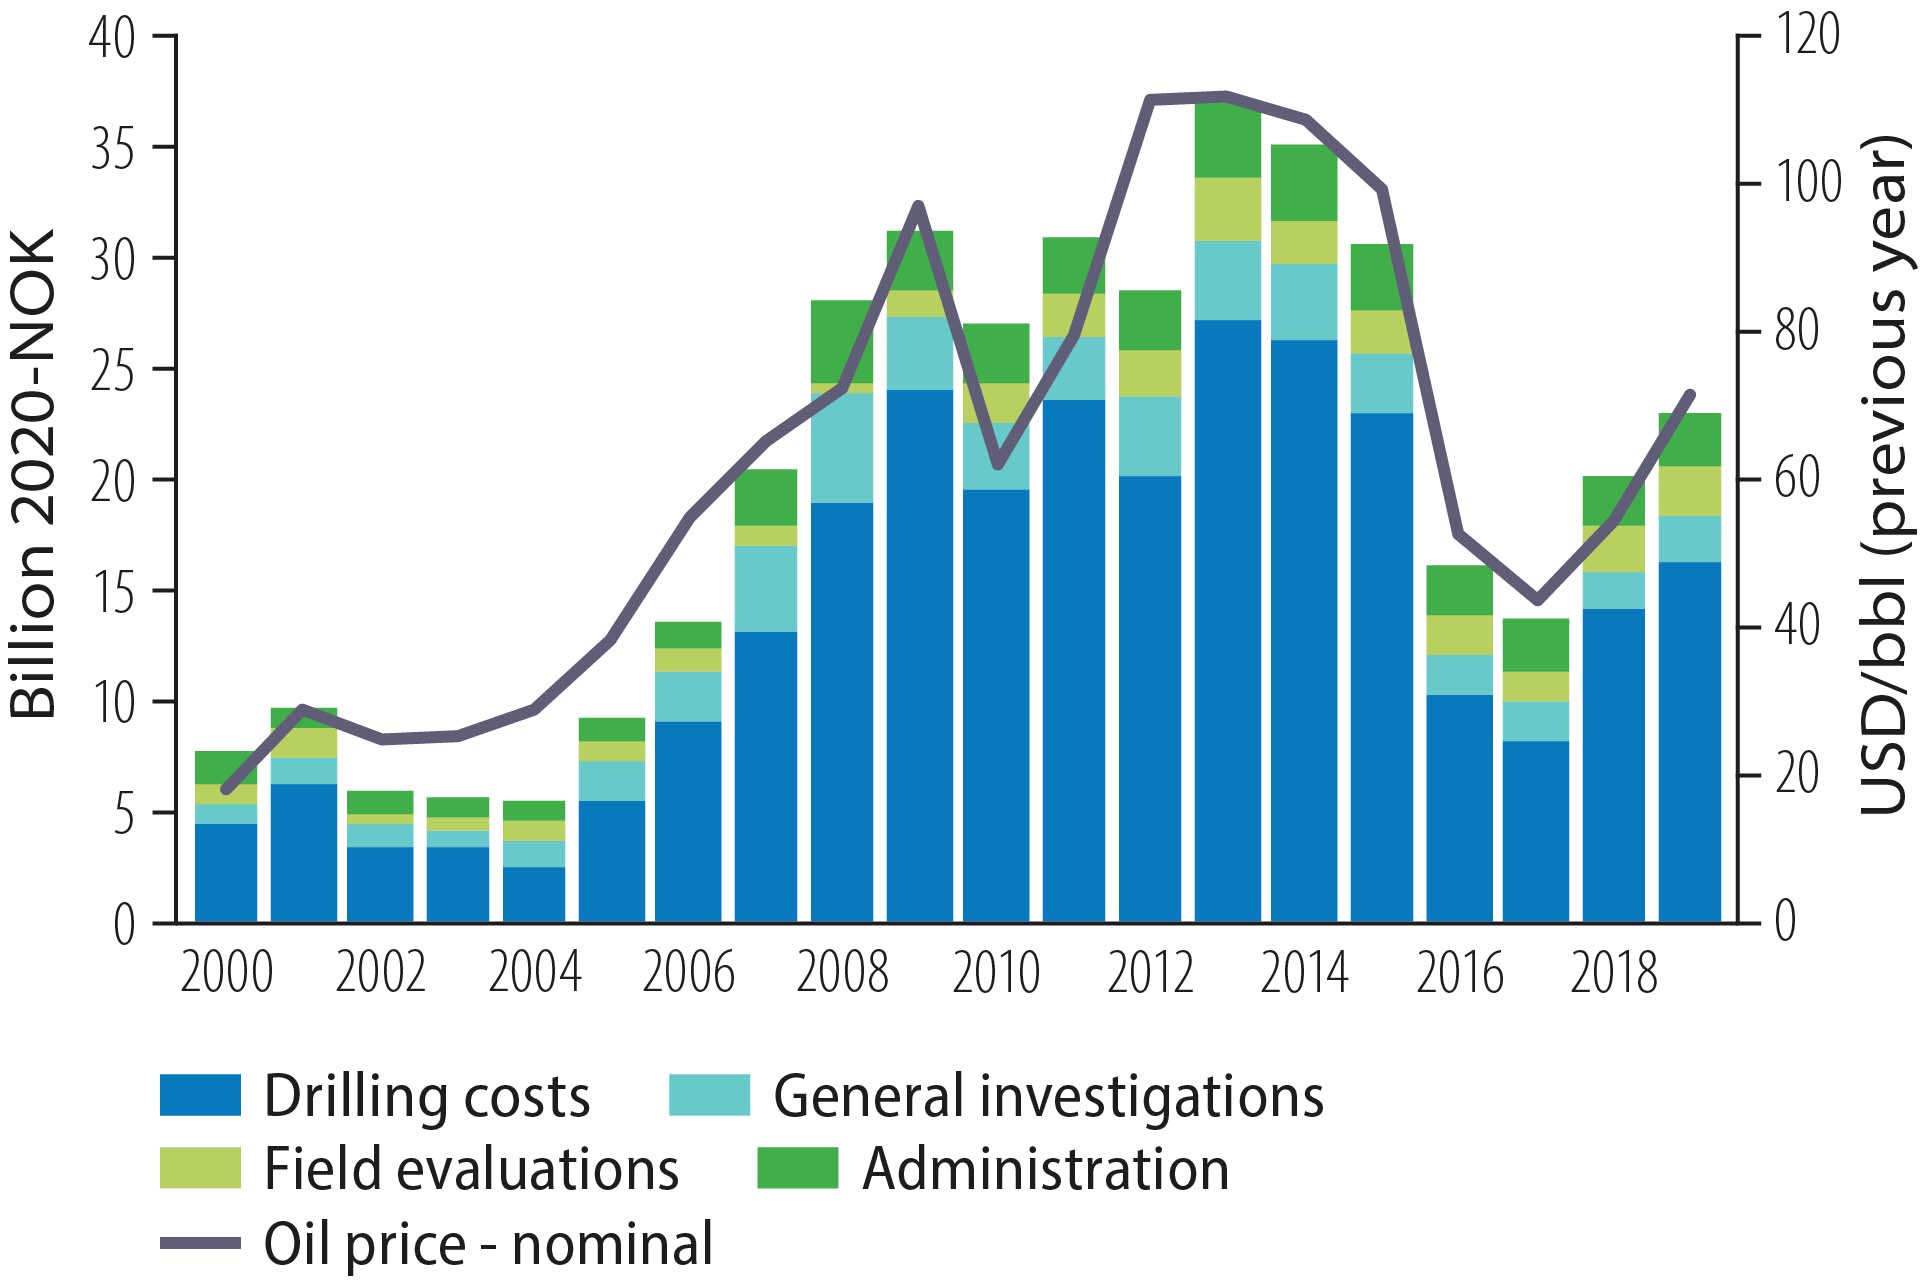
Figure 4.2 Exploration costs and oil price developments, 2000-19
Methodology and assumptions
The profitability of exploration is defined as calculated revenues from discoveries in the period less all expenses, including exploration and cessation costs (figure 4.6). Its costs include both successful wells and those which fail to prove resources. Revenue and cost flows are discounted to the same year. All the profitability analyses utilise pre-tax calculations. Indirect effects on or spin-offs to the rest of the economy are not included.
Future oil prices are assumed to rise gradually to USD 50/bbl in 2030 [9]. This is a low estimate compared with earlier profitability calculations and given the average oil price (about USD 65/bbl) over the past 20 years. NOK 2.70 per scm is assumed for the future gas price [9].
The profitability analysis has also been tested with lower and higher prices and various estimates for cost trends. Historical prices for oil, gas and natural gas liquids (NGL) are used for the pre-2020 period. Real discount rates of four and seven per cent have been applied.
Profitability estimates are uncertain because of uncertainties over price as well as with estimated resources and costs. A number of discoveries in the period are still awaiting a development decision (fact box 4.2).
How far plans for these discoveries have progressed varies, which means the estimates for resources, production and costs are of varying maturity. Uncertainty will be greatest for the less mature projects. When production will start is another uncertainty which affects the net present value (NPV) of projects.
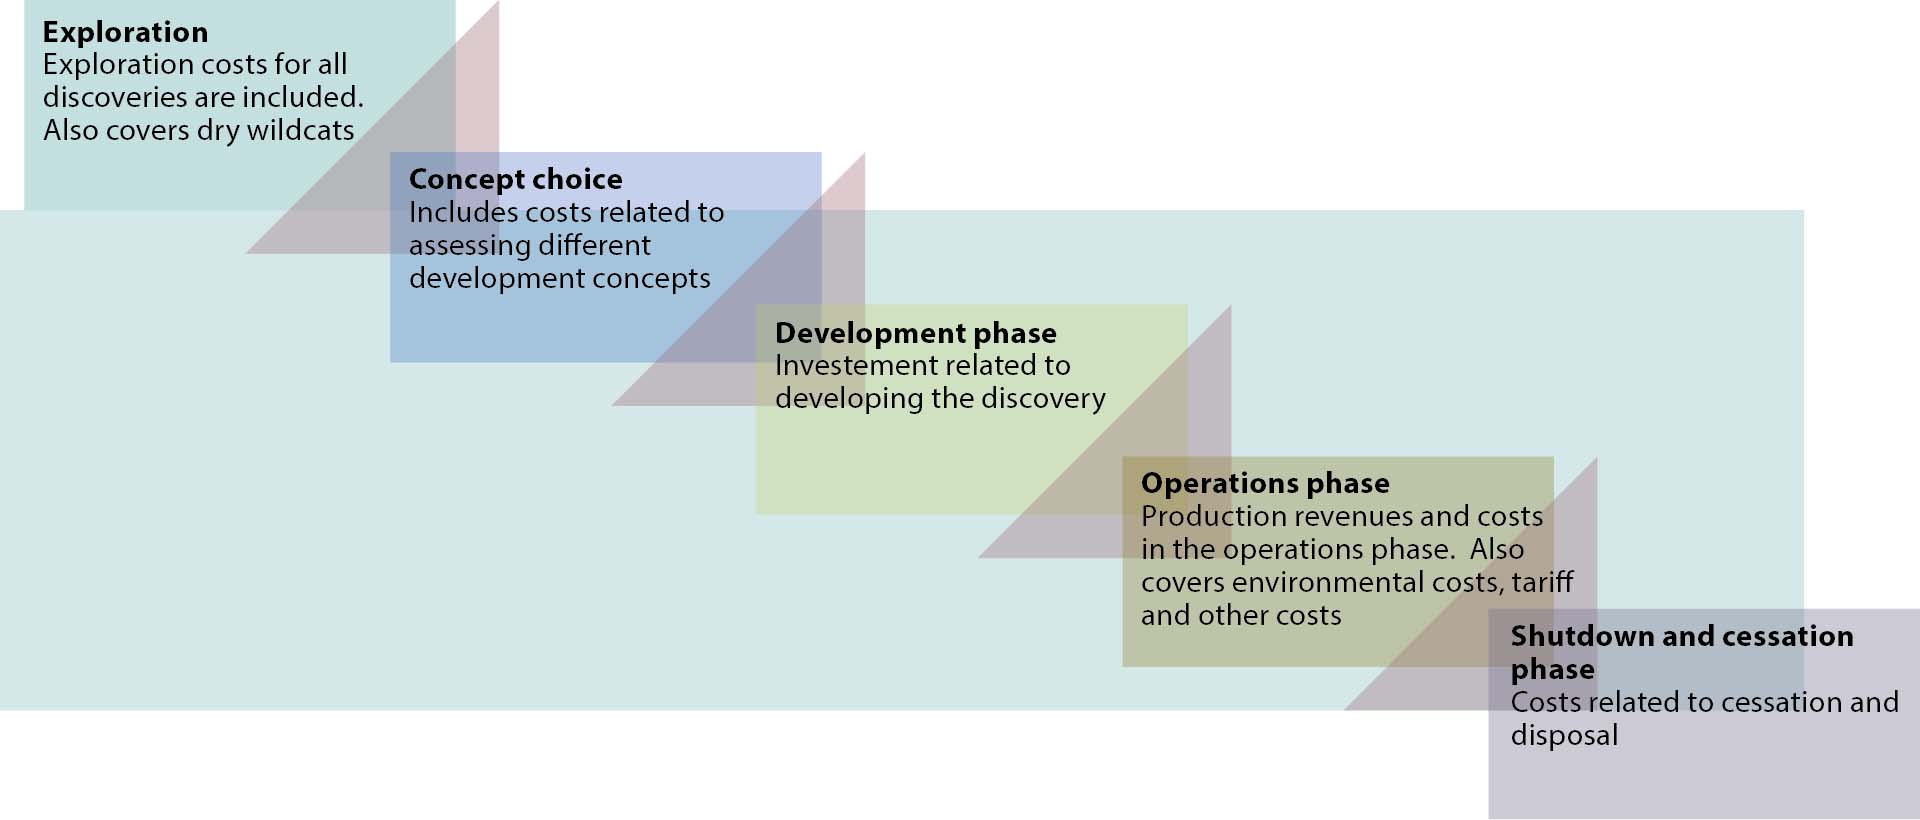
Figure 4.6 The various elements included in the analysis
Fact box 4.2 Discoveries included in the analysis
Profitability of exploration over the past 20 years
The profitability of exploration in 2000-19 has been calculated with real discount rates of four and seven per cent. The NPV is estimated to be more than NOK 1 700 billion at a four per cent discount rate (figure 4.7). The corresponding number at a seven per cent discount rate is NOK 1 200 billion. Total net cash flow is estimated at almost NOK 2 700 billion.
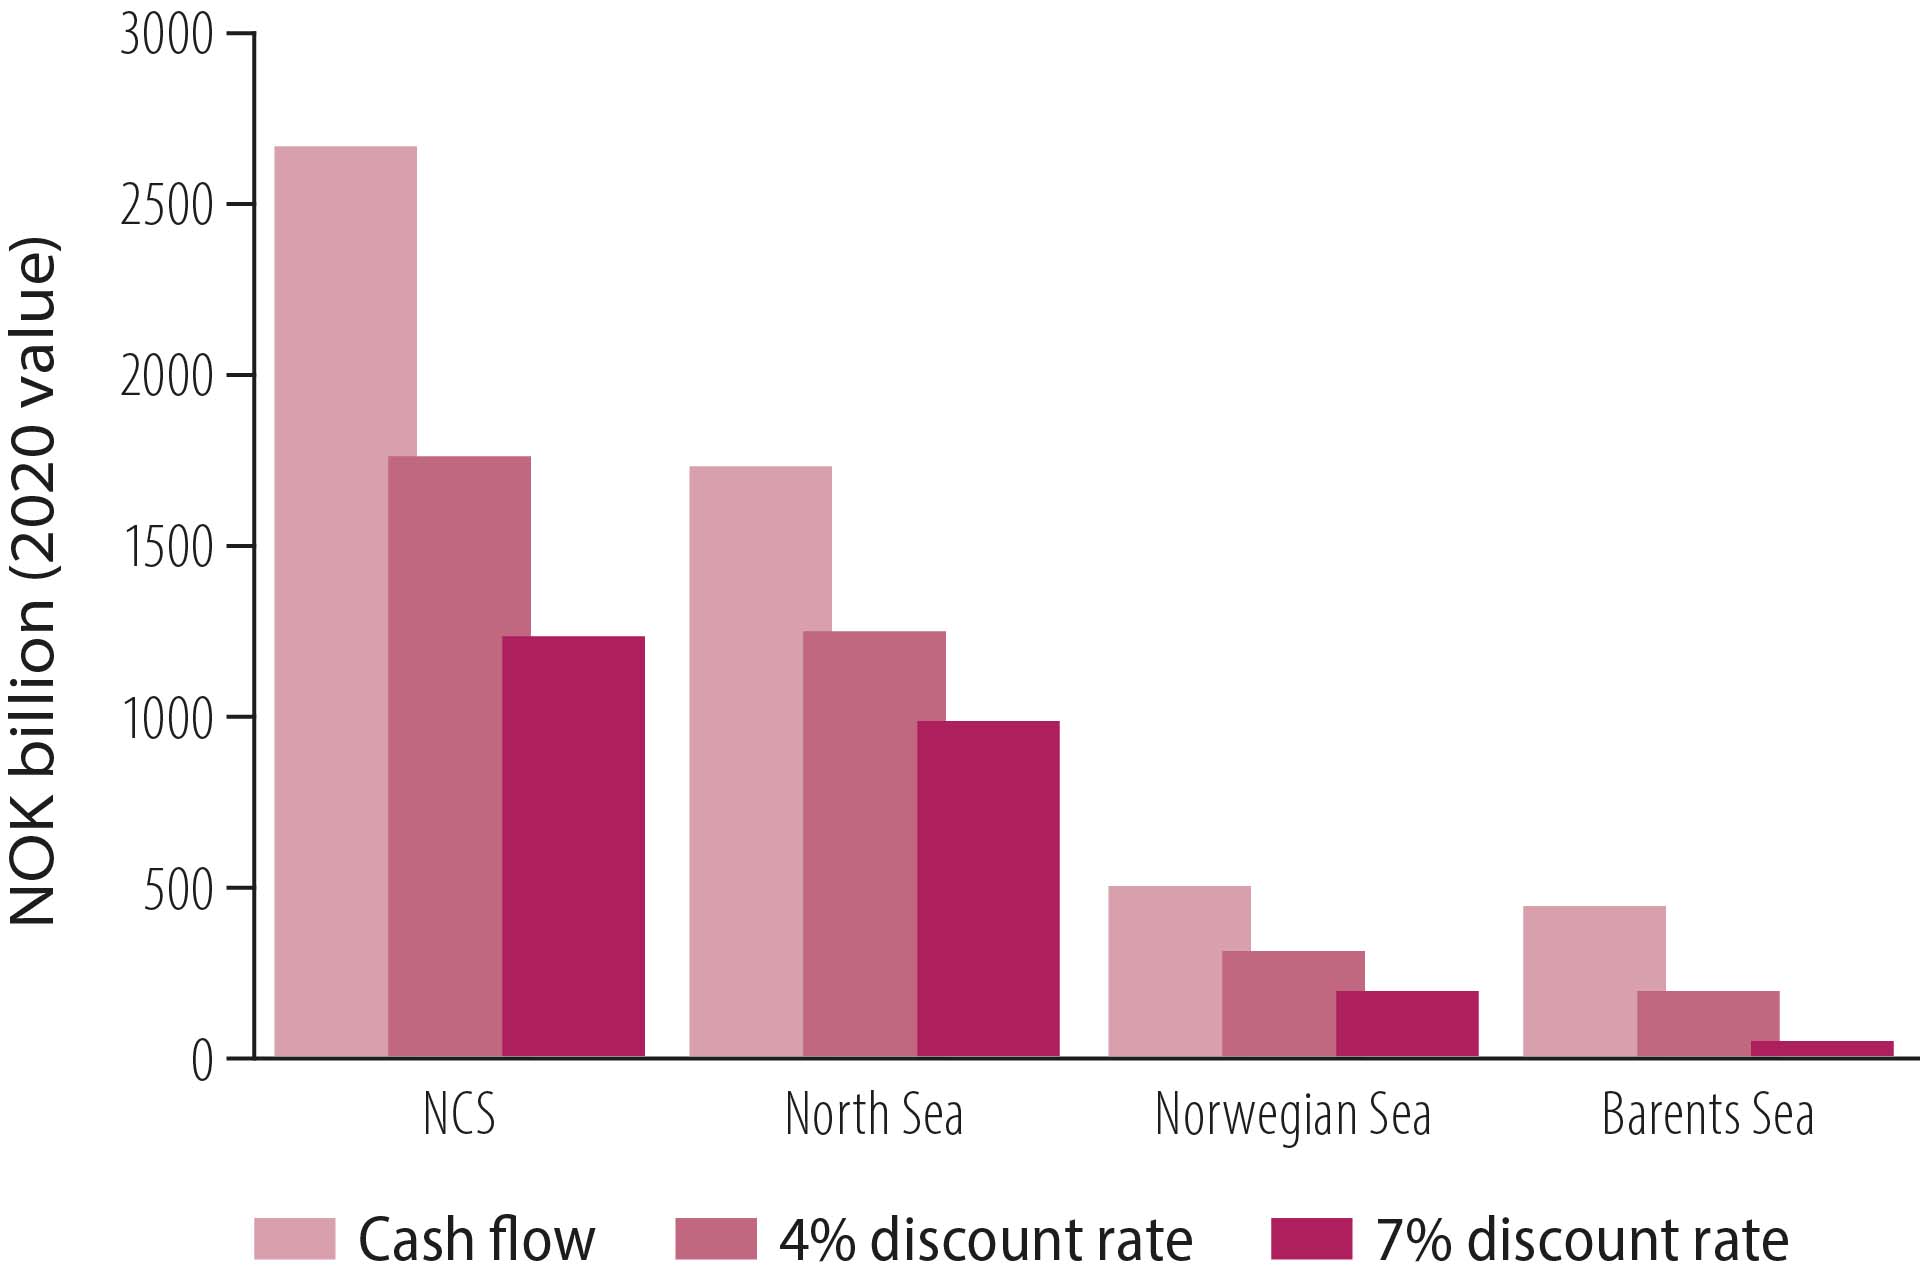
Figure 4.7 NPV from exploration by region, 2000-19
All NCS regions make
an important contribution
to overall value creation
Exploration over the past 20 years has been profitable in all regions. At a seven per cent discount rate, the North, Norwegian and Barents Seas contributed a positive NPV of NOK 990, 190 and 50 billion respectively.
The North Sea made clearly the biggest contribution to value creation, with well-established infrastructure and several substantial discoveries in the period. The Norwegian Sea also contributed positively, with gas revenues playing an important role. Value creation in the Barents Sea has also been positive, but lower than in the other regions. The analysis shows that profitability in the Barents Sea improved substantially over the period in line with rising activity (fact box 4.3 and figure 4.9).
Fact box 4.3 Infrastructure development and increased profitability in the Barents Sea
Profitability of exploration over the past decade
NPD analyses show that exploration over the past 10 years has been more profitable than in the previous decade. About two-thirds of total revenues from discoveries made in 2000-19 derive from discoveries in the most recent decade (figure 4.8).
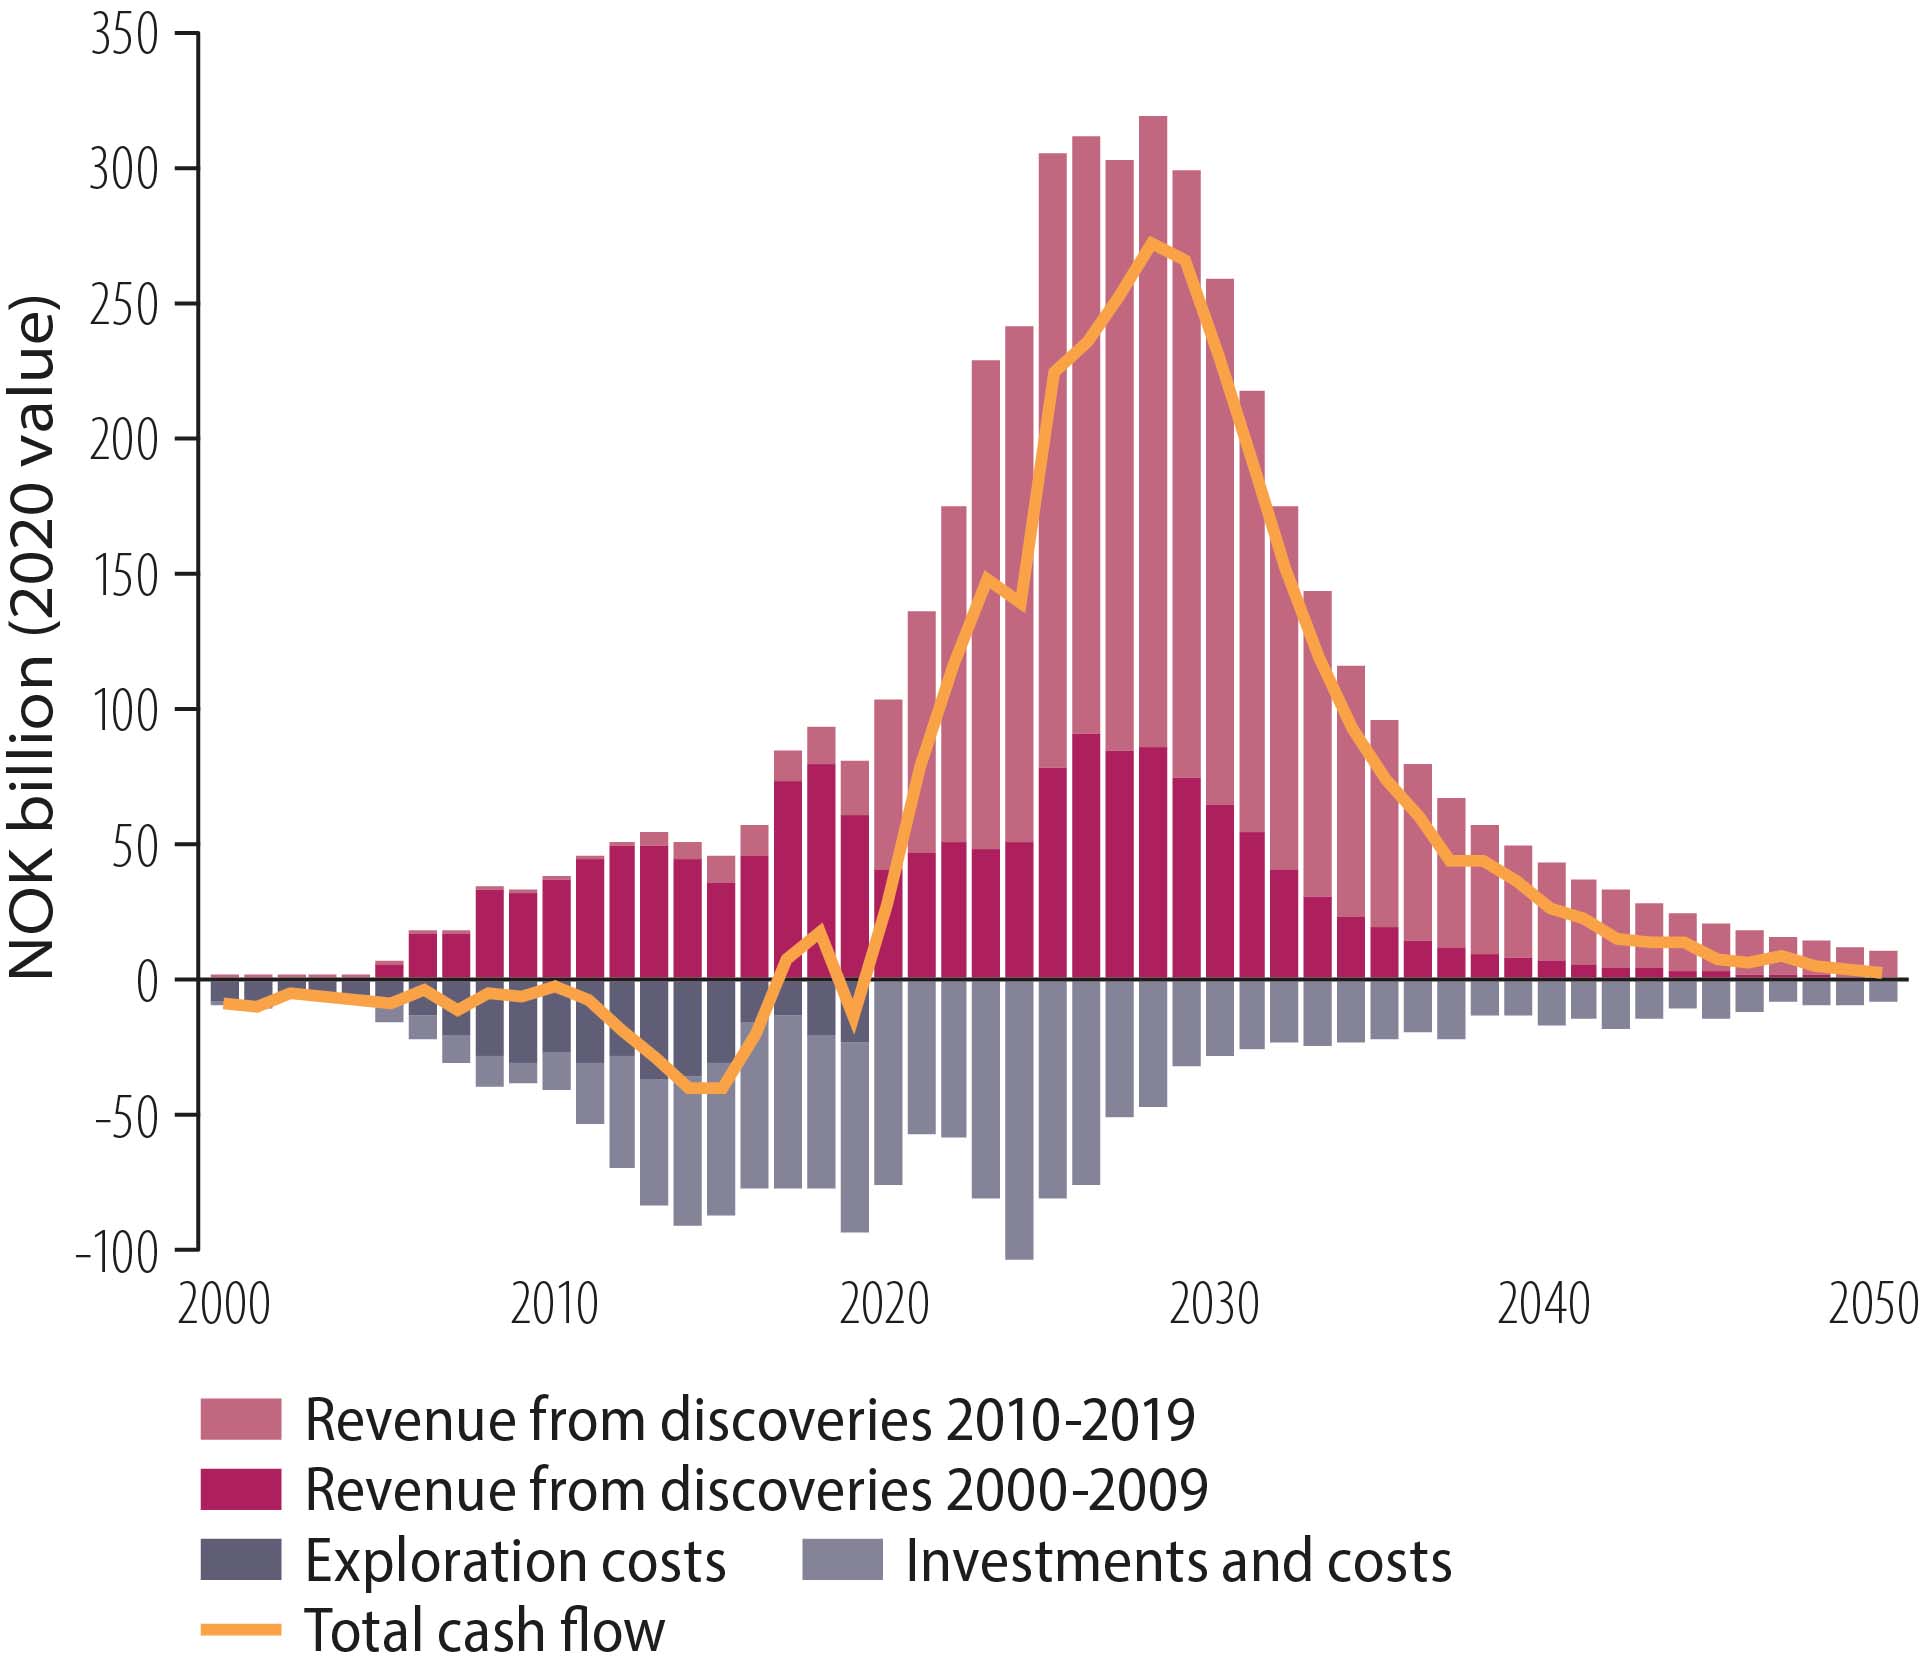
Figure 4.8 Cash flow from exploration, 2000-19
A higher level of exploration activity from 2010-19 resulted in a number of profitable discoveries, and exploration spend over the period yielded a good return to Norwegian society. Figure 4.9 shows that NOK 1 000 invested in North Sea exploration over the past decade has returned more than NOK 3 400.
The corresponding figures for the Norwegian and Barents Sea were over NOK 1 500 and almost NOK 2 500 respectively. These numbers represent the NPV per NOK 1000 at a seven per cent discount rate.
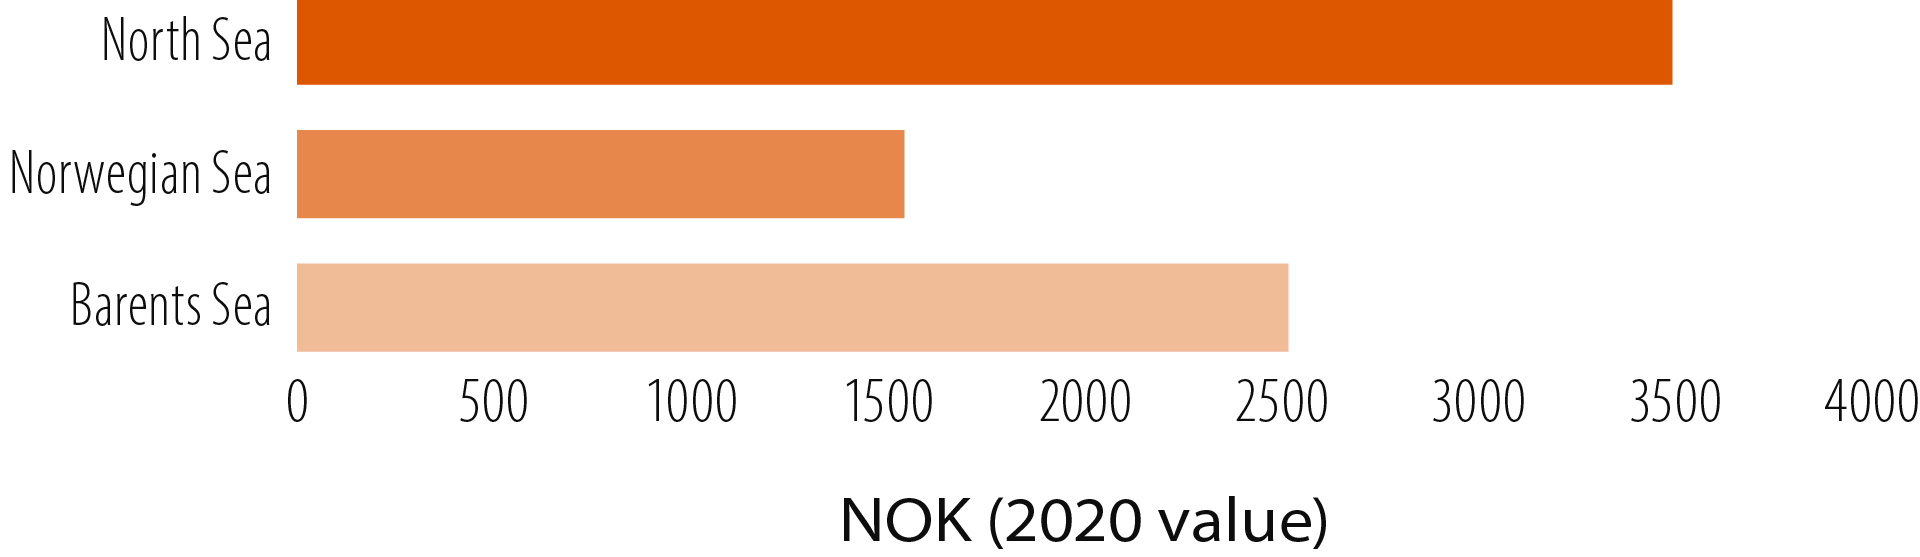
Figure 4.9 NPV (at seven per cent discount rate) per NOK 1 000 invested in NCS exploration, 2010-19
NPV contribution from various discovery types
The 179 discoveries included in the NPD’s profitability analysis represent a total resource growth of about 1 650 million scm oe. This portfolio provides an average discovery size of just over nine million scm oe and a median figure slightly above three million scm oe. That the average size is so much higher than the median indicates that the biggest discoveries are significantly larger than the typical ones.
About 25 per cent of the resources included in the analysis are provided by 16/2-6 Johan Sverdrup, far and away the most sizeable discovery of the period, which also contributes more than a quarter of total value creation from exploration on the NCS over the past 20 years (figure 4.10).
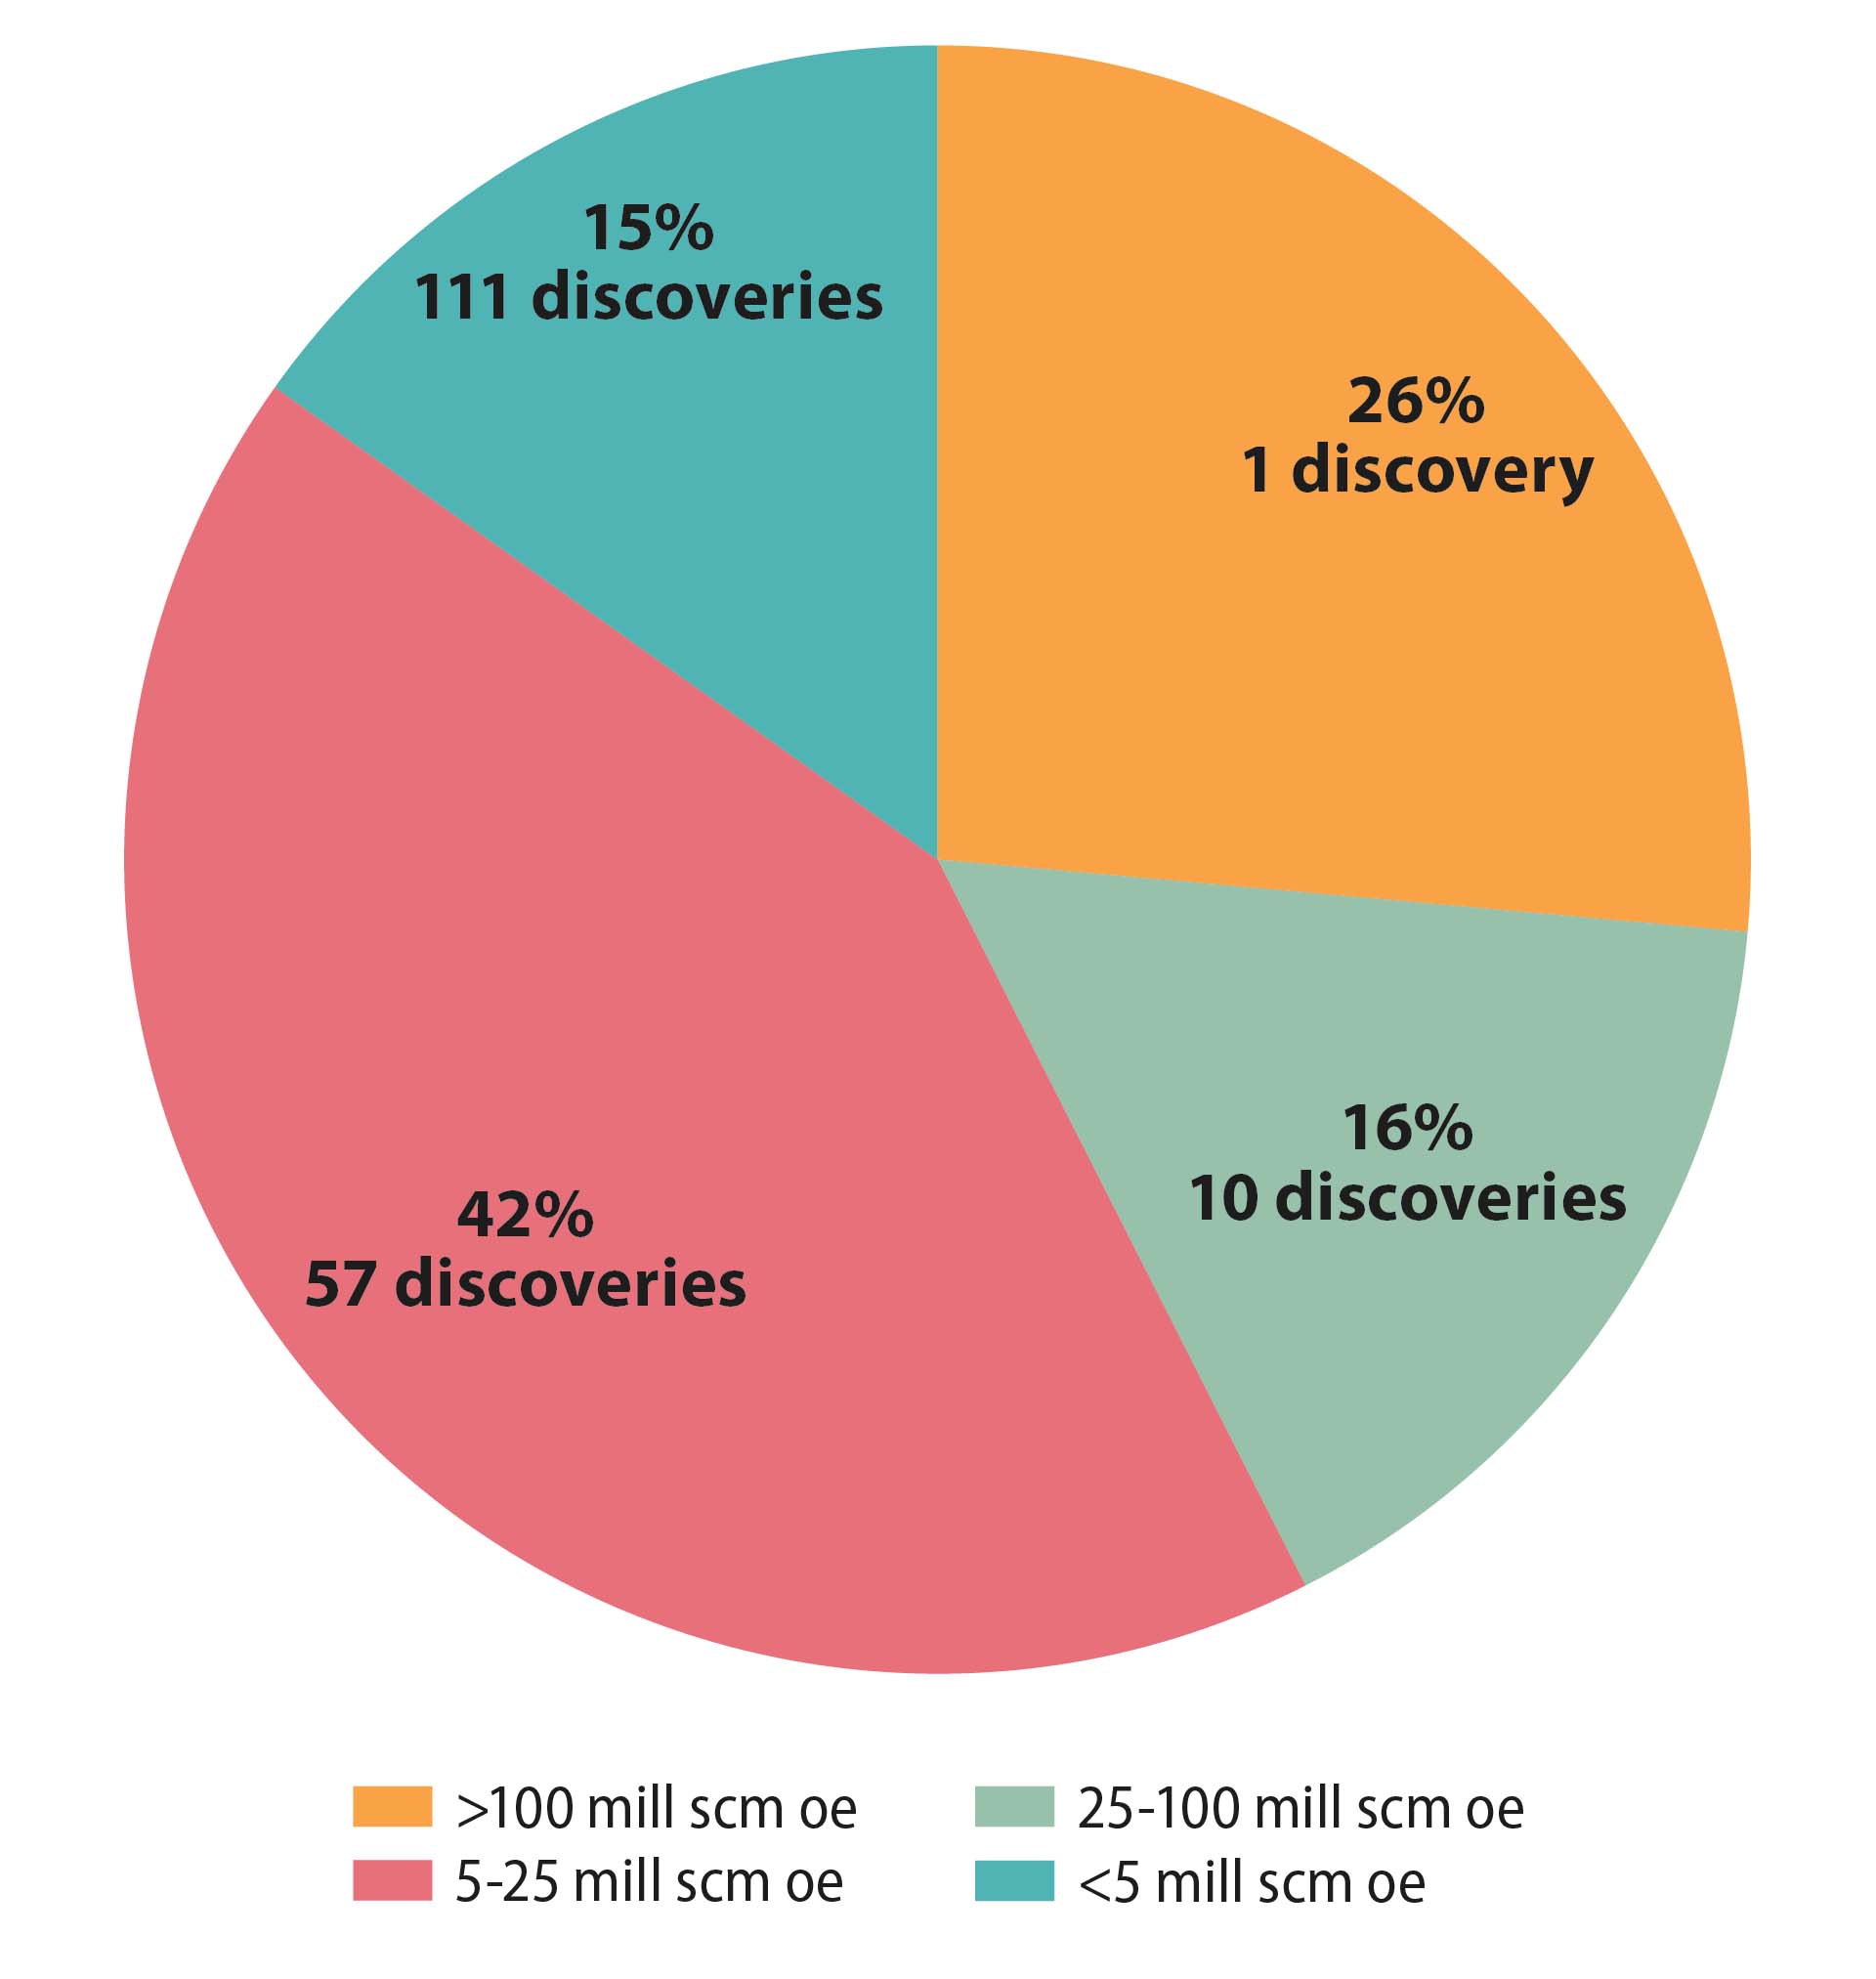
Figure 4.10 NPV contribution from various discovery sizes in 2000-19 (seven per cent discount rate, excluding exploration costs)
In addition to 16/2-6 Johan Sverdrup, 10 discoveries larger than 25 million scm oe were made in the analysis period. These have contributed about 16 per cent of total NPV from exploration over the past 20 years and, like 16/2-6 Johan Sverdrup, provided substantial value creation per discovery.
These discoveries are or will be important for developing infrastructure and other discoveries around new or existing field centres. More than 40 per cent of the value creation comes from 57 discoveries in the size range from five to 25 million scm oe, which contribute roughly as much as 16/2-6 Johan Sverdrup and the 10 other largest discoveries combined.
The smallest discoveries also contribute a substantial share of total value creation, since even very small discoveries can show good profitability when developed in a cost-effective way towards existing infrastructure. They are also important for utilising capacity already in place and for enhancing the profitability of fields approaching cessation. Over the past 20 years, discoveries smaller than five million scm oe have accounted for roughly 15 per cent of overall value creation on the NCS.
Small discoveries have made
a substantial contribution
to overall value creation
Development of unit costs in 2000-19
Unit costs are defined as the total cost per oe produced. All expenses are included (figure 4.6), including exploration spend which did not result in discoveries. The average unit cost for discoveries over the past 20 years is about USD 22/bbl. This declined from some USD 25/bbl for discoveries in 2000-09 to roughly USD 21/bbl for 2010-19 (figure 4.11).
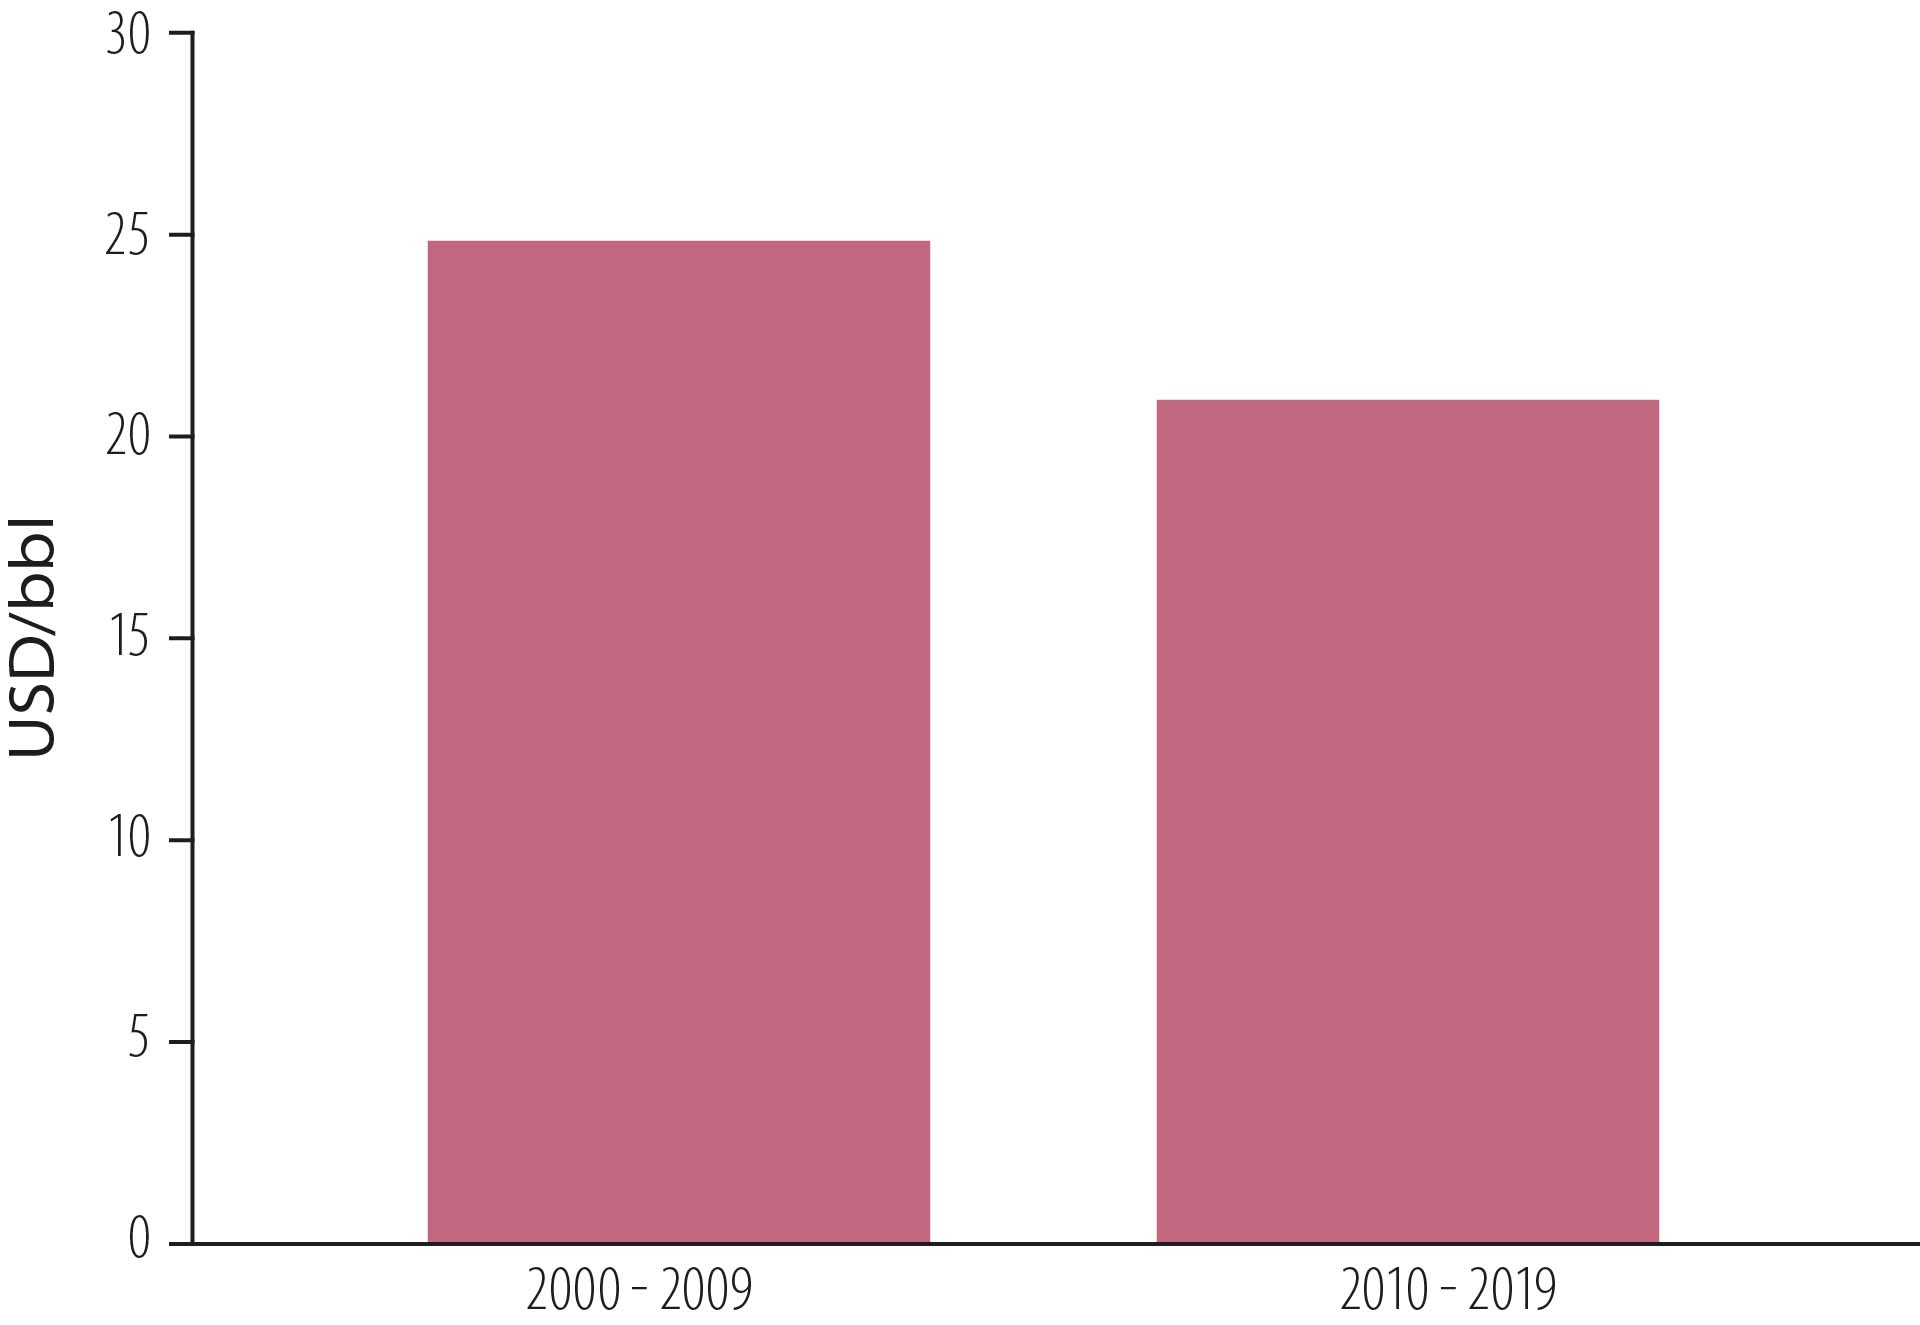
Figure 4.11 Unit costs for discoveries in 2000-09 and 2010-19
Unit costs vary from project to project and depend on several factors, such as discovery size, type of phasing-in, reservoir quality and distance from infrastructure. Figure 4.12 presents average unit costs by region.
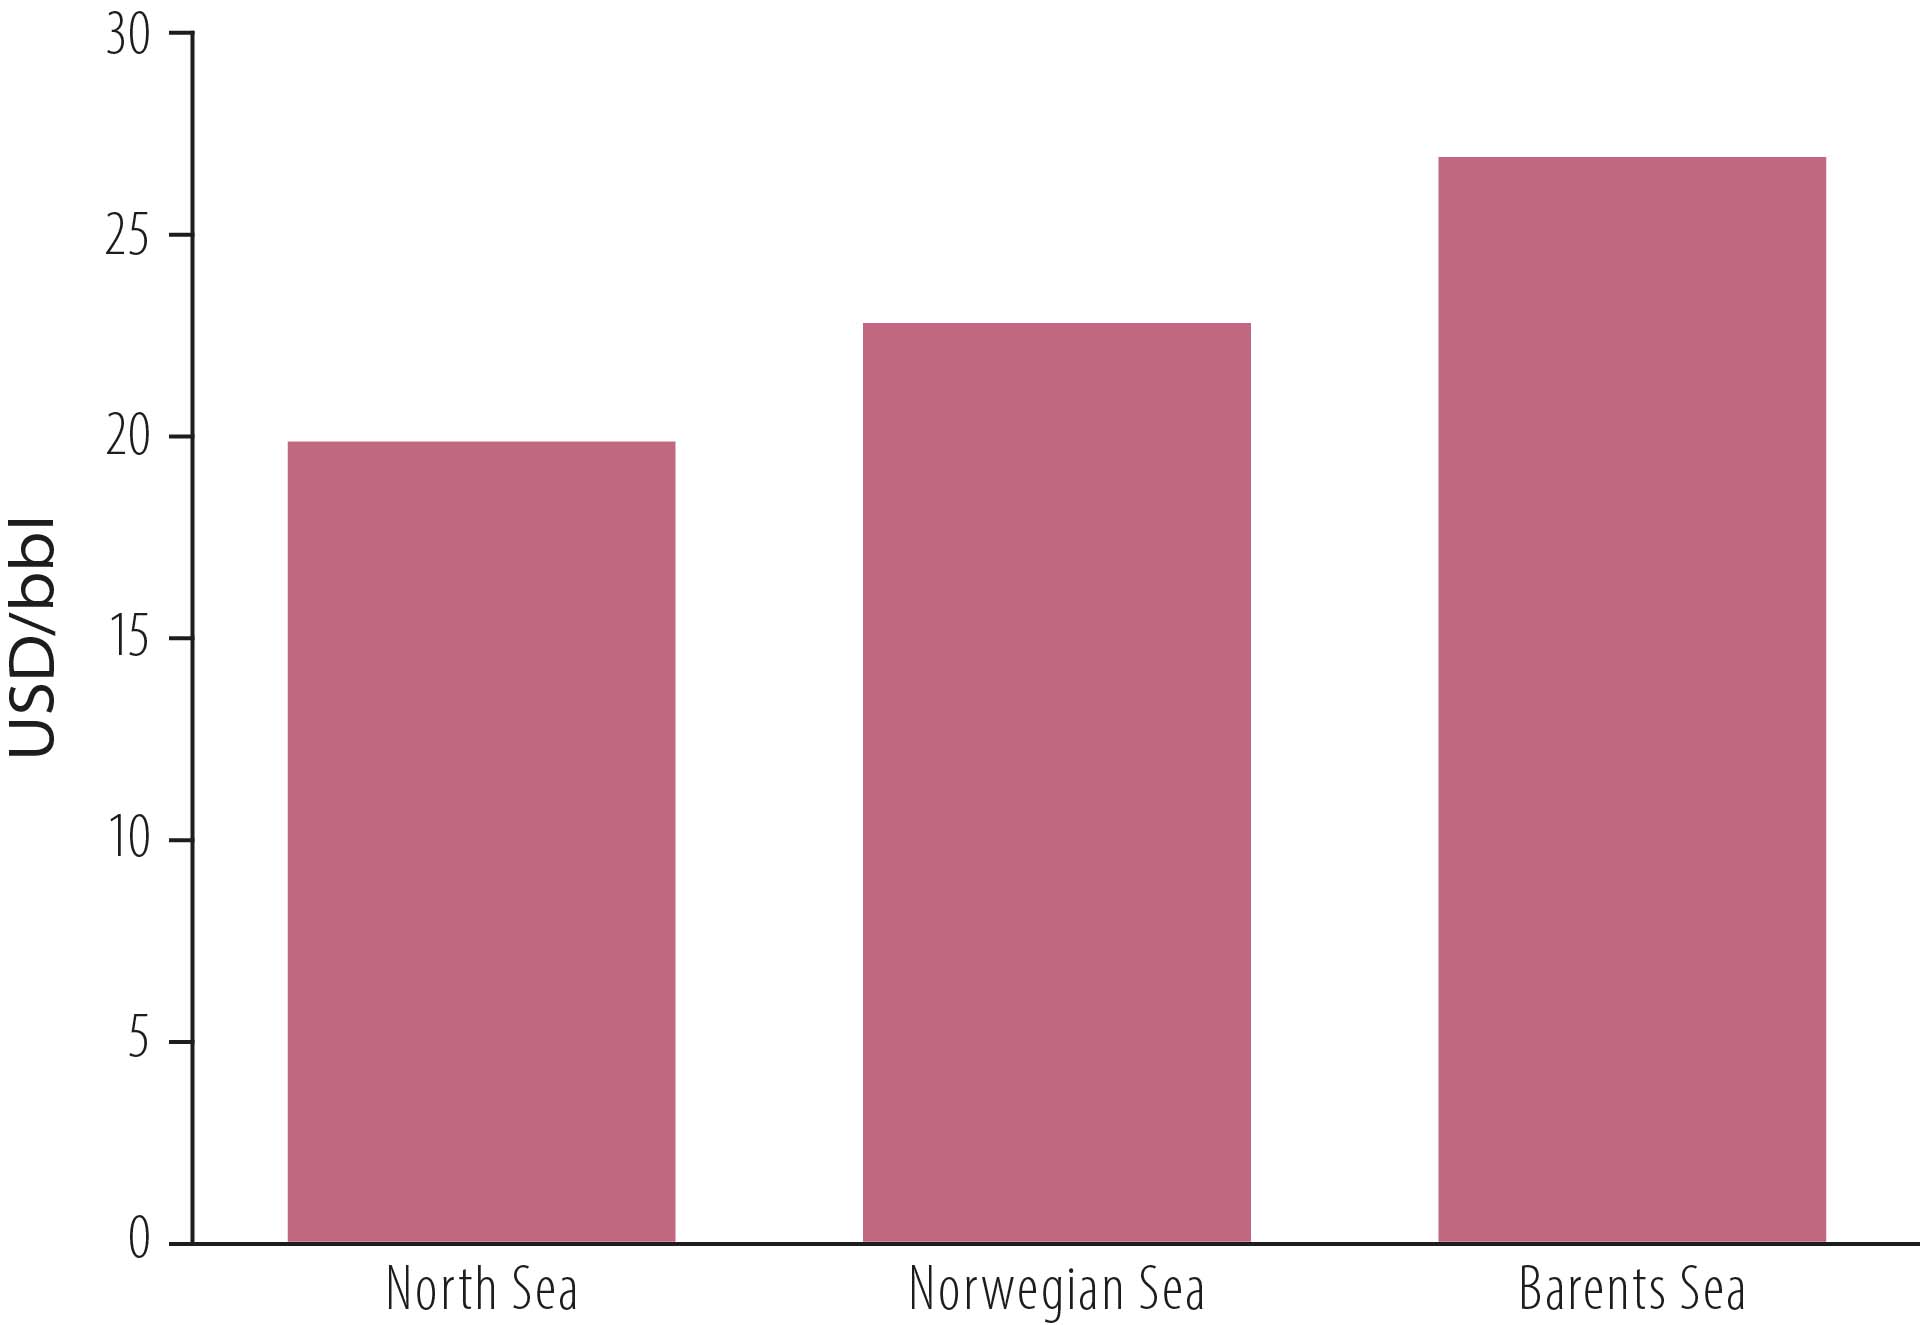
Figure 4.12 Unit costs for discoveries in 2000-2019 by region
The North and Norwegian Seas have the lowest unit costs, in part because of their well-established infrastructure. Large investments which have already been depreciated allow new resources to be phased in with good profitability. Although infrastructure in the Barents Sea is less developed, unit costs in this area are also below USD 30/bbl.
Robust profitability at different price and cost estimates
The profitability analysis has been tested for various price and cost estimates. With a 20 per cent reduction in the price assumptions, oil prices will gradually move towards USD 40/bbl in 2030. A 20 per cent increase in assumptions would mean a gradual rise towards USD 60/bbl over the same period. Gas prices would change correspondingly. At the low or high price estimates, future costs are also expected to show a gradual fall or rise respectively [11].
Figure 4.13 shows that a 20 per cent price rise would give a NPV of about NOK 1 600 billion at a seven per cent discount rate. A similar percentage decline would mean about NOK 800 billion in NPV.
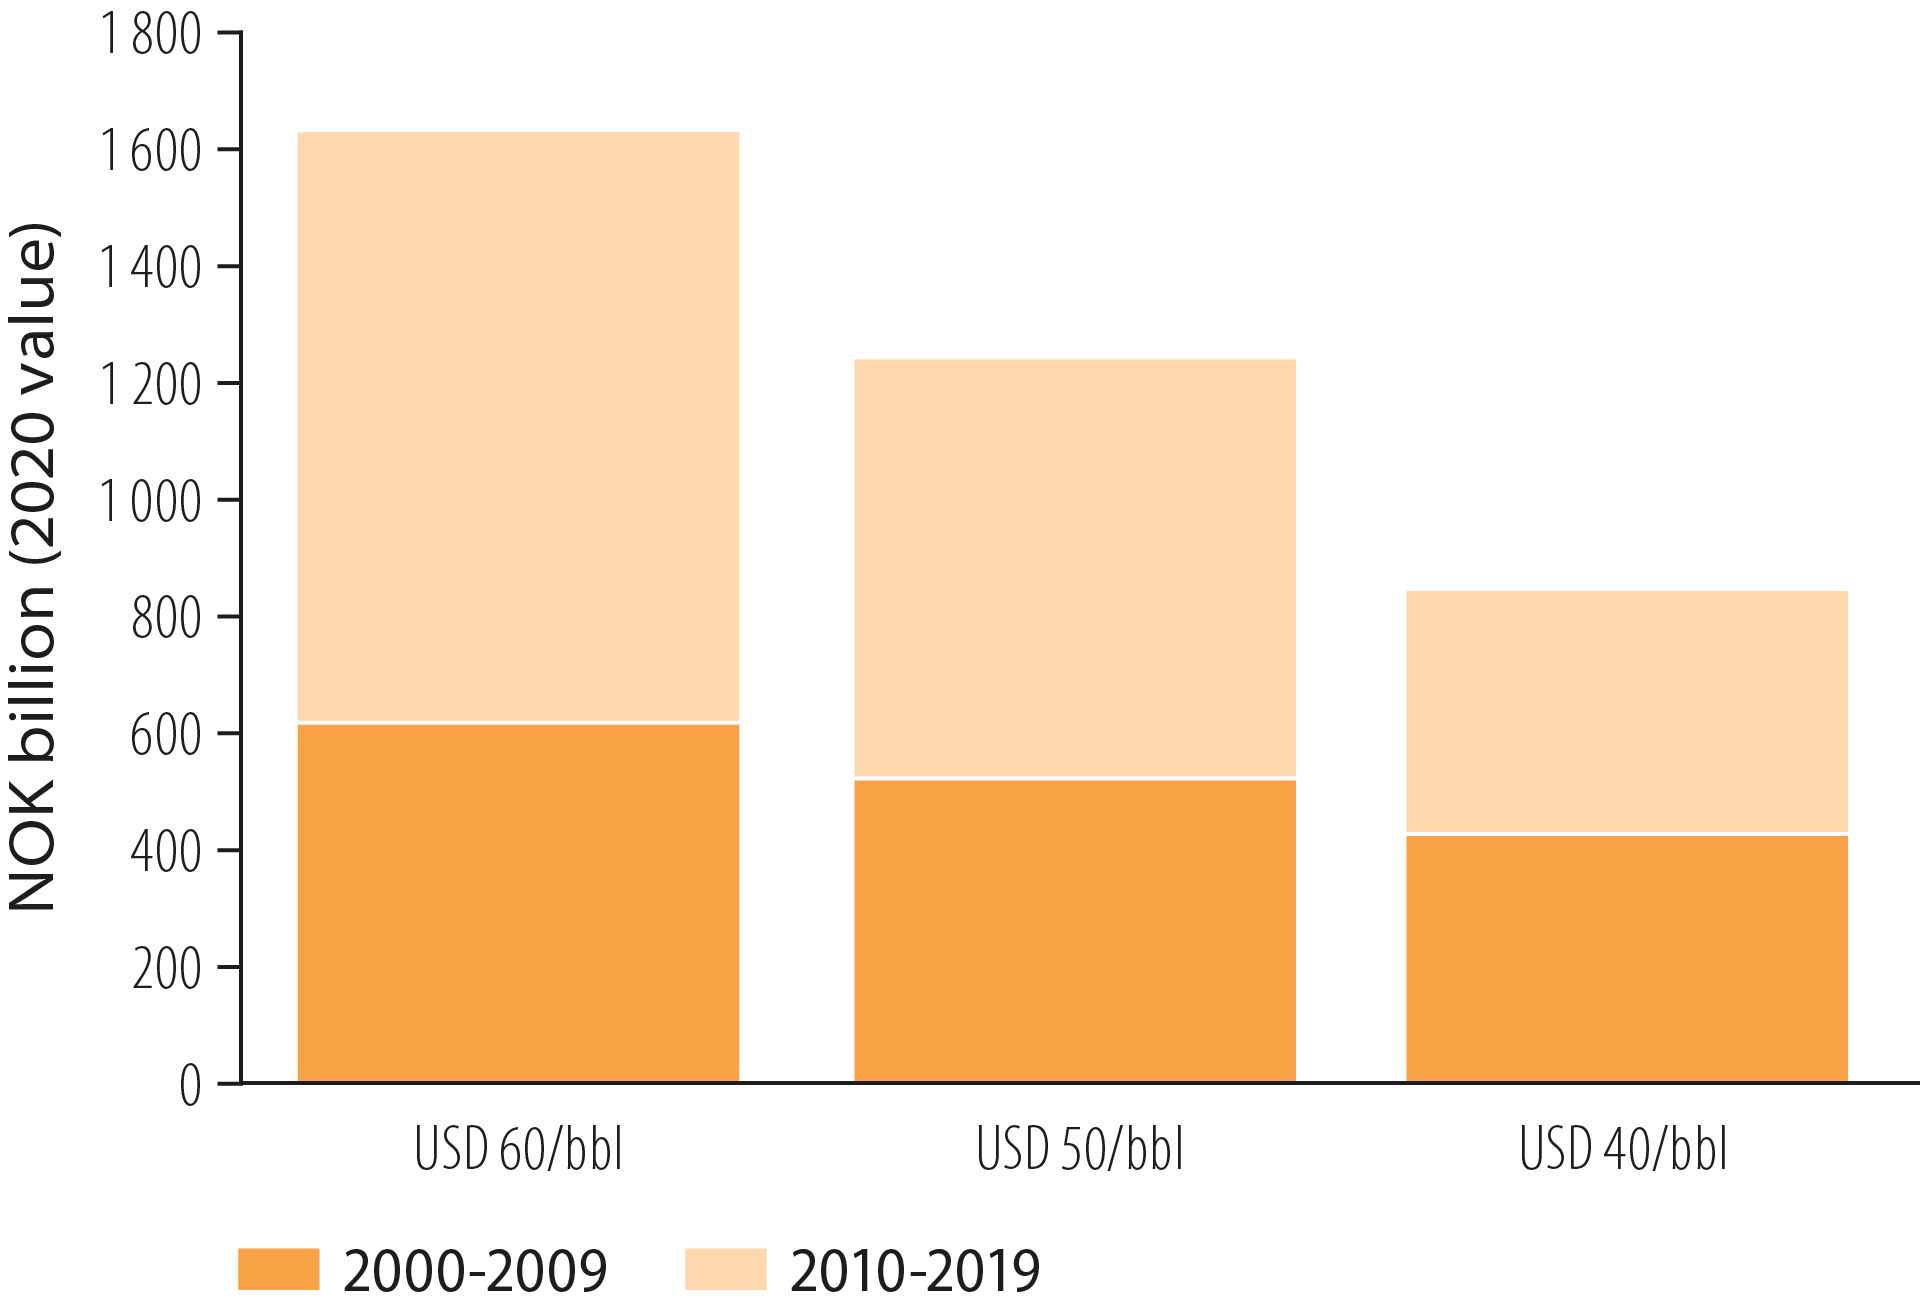
Figure 4.13 NPV from exploration at different prices and seven per cent discount rate, 2000-19
At the same time, the figure shows that the NPV from exploration in 2000-09 is less sensitive to future price changes than in the most recent decade. That is because a larger proportion of discoveries in the earlier period have already been produced and are less affected by future prices (figure 4.8).
Discoveries in the past 10 years will primarily be produced in the time to come, and are therefore more sensitive to future price trends. At a seven per cent discount rate, the NPV from exploration in 2010-19 is about NOK 700 billion with the mid-range price estimate and NOK 400 and 1 000 billion respectively with the lower and upper estimates.
Direct, indirect and external effects
Direct effects
The profitability analysis for exploration over the past 20 years shows direct economic effects of the activity. Direct revenues cover earnings from the recovery and sale of petroleum in the discoveries, which will be determined in turn by the production volume and prices for oil, gas and NGL. Similarly, direct costs cover investment in as well as use of equipment, labour and energy for exploration, development and operation of the projects.
Indirect effects
Indirect economic effects come in addition and, in this context, comprise revenues and costs which are not reflected in the basis for the investment decision, but appear in the budget and accounts for adjacent enterprises and industries. They are popularly referred to as spin-offs.
In socioeconomic profitability assessments, the significant consideration in possible socioeconomic analyses of the activity is the sum of all positive and negative indirect effects. Blomgren et al [12] have illustrated the difference between direct (yellow and red circles) and indirect (green circles) effects in figure 4.14.
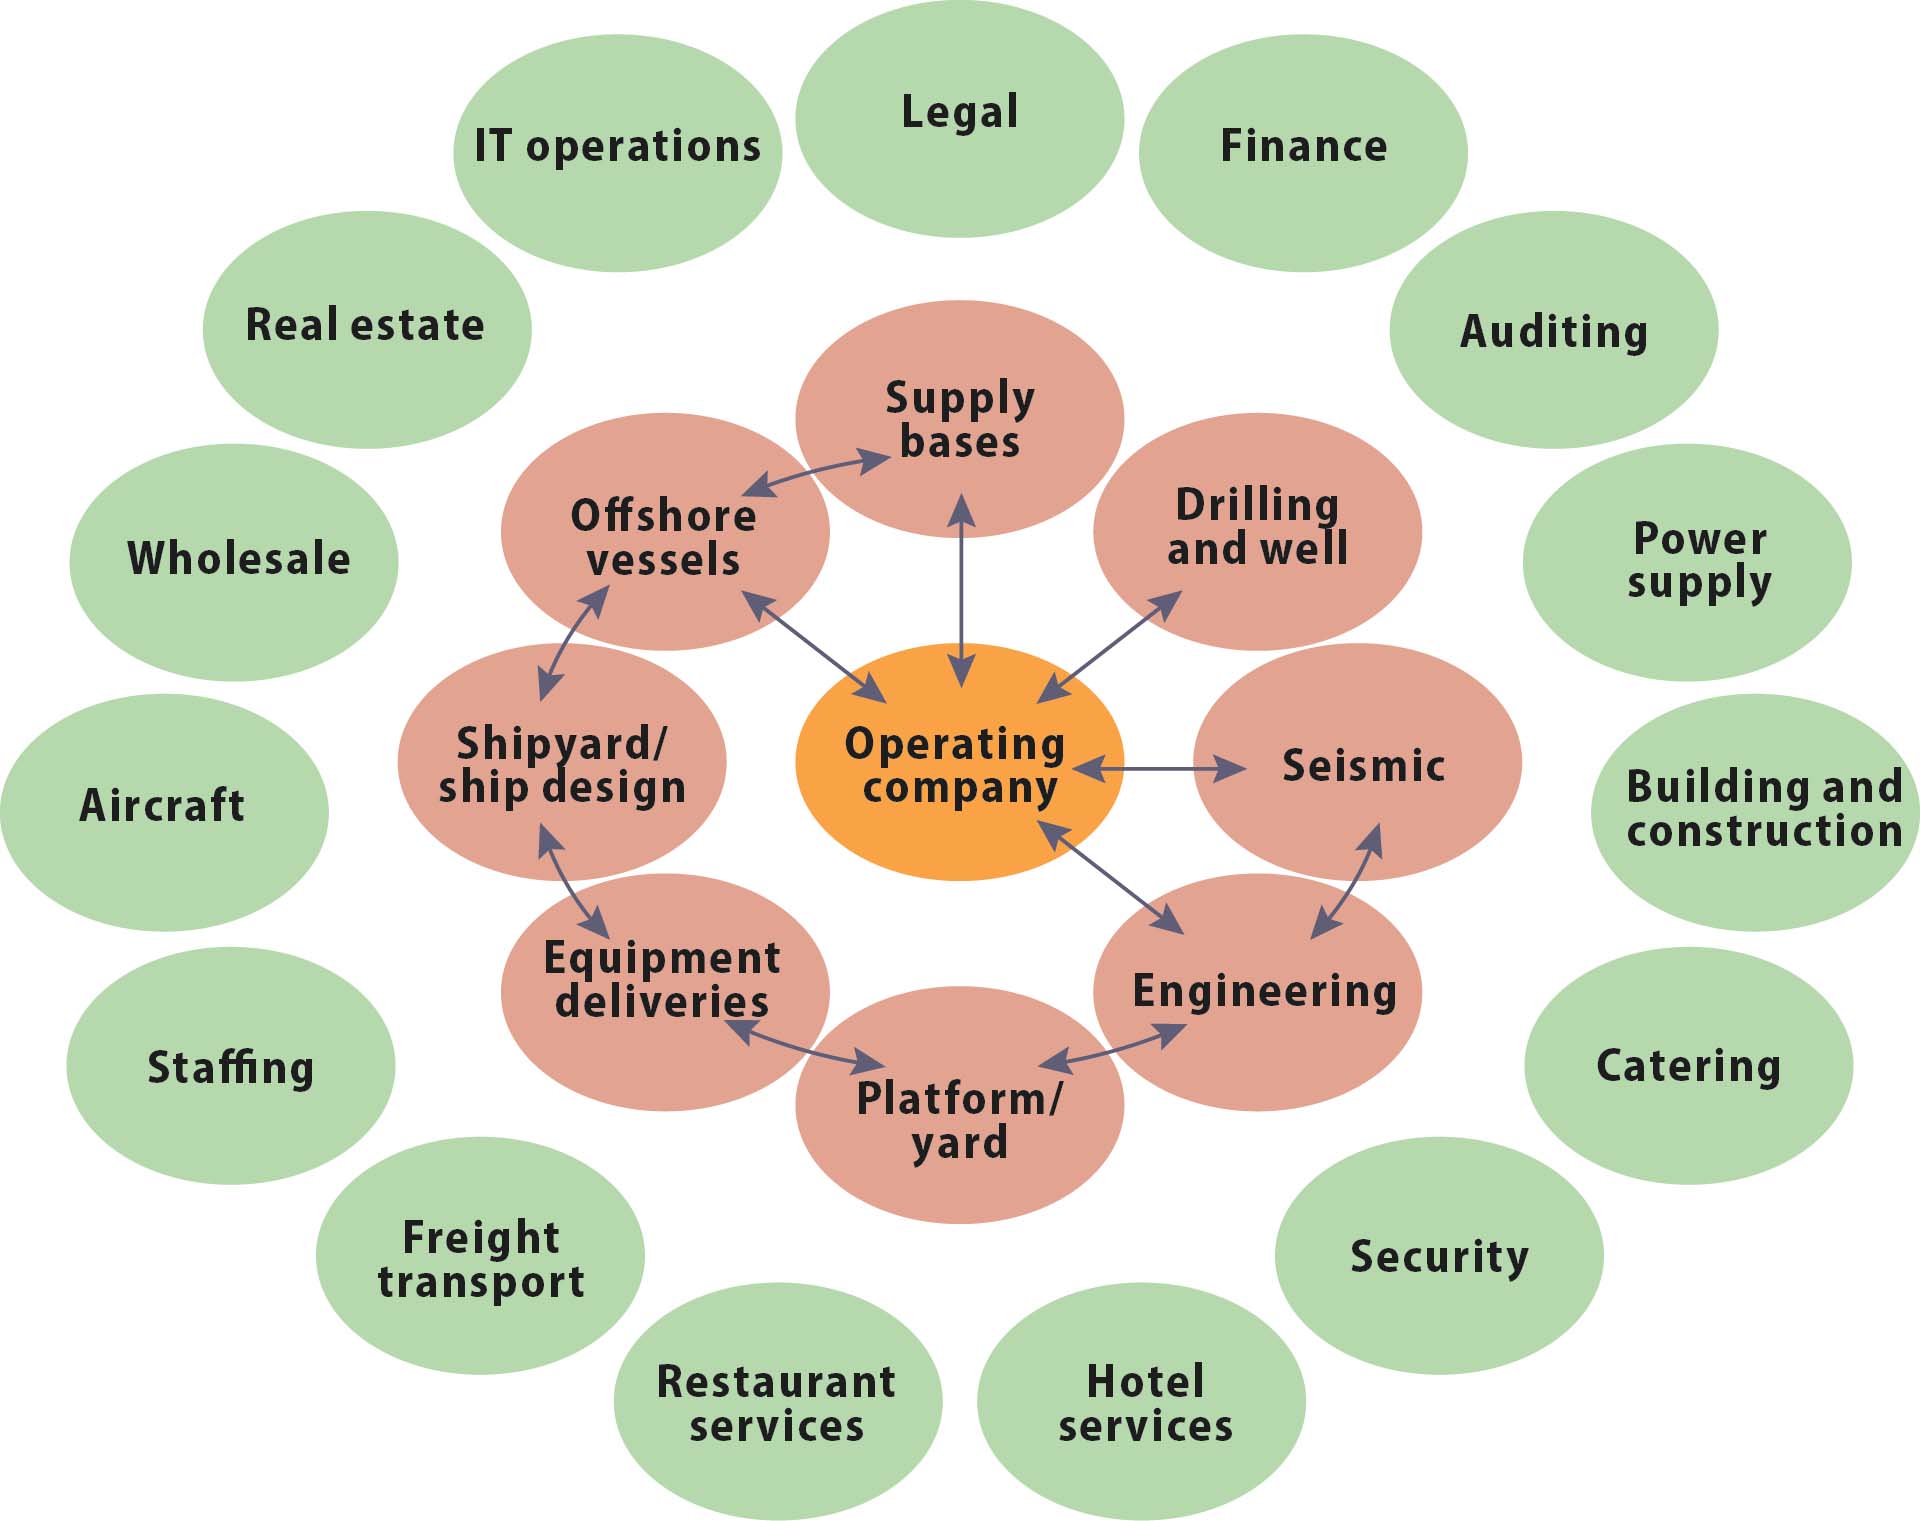
Figure 4.14 Direct and indirect effects. Source: Blomgren et al (2015)
The exploration profitability analysis does not include these indirect economic effects – in other words, spins-offs in the form of growth impulses to the rest of the economy from exploring for, developing and operating new discoveries during the period.
External effects
In addition to its direct and indirect economic effects, the industry will have external effects in the form of benefits and drawbacks from exploration and production projects which are not reflected in a company’s decision base. These are usually split into positive and negative effects.
Exploration and production can have negative effects for other marine activities and impose costs for mitigating the risk of accidents and damage. These effects are regulated through sectoral legislation and are taken into account in part through management plans. In some cases, both coexistence issues and regulation increase costs. Drilling close to coral reefs, for example, will involve the expense of collecting drill cuttings. This spending is implicitly taken into account in the profitability calculations through increased drilling costs.
Despite strict regulations, the industry involves a residual risk of acute oil discharges and gas emissions. The possible cost of these is not included in the calculations.
Climate change resulting from CO2 emissions is another external effect. The most important climate policy instruments for reducing production emissions on the NCS are emission allowances and CO2 tax (see chapter 6). These costs are included in the calculations.
Exploration also has positive external effects. One example is increased emergency preparedness which benefits other marine sectors, such as fishing. Another is that information from an exploration well in a frontier area could have a high information value for surrounding production licences. That helps to reduce both risk and costs for further exploration of an area and gives a financial benefit.
Provision has been made for realising such gains through the licensing and awards policy and through follow-up of exploration activities. These benefits have not been directly quantified when analysing exploration profitability.
The profitability of small discoveries will often depend on the availability of existing infrastructure. This increases the value of small discoveries and makes their development commercial. In that way, production facilities which are already depreciated and have finished their original function can be reused – an important principle in a circular economy.
Exploring near fields and existing infrastructure may also help to extend their producing life. New discoveries can thereby enhance the value of fields and facilities. Development of the Norne area (fact box 4.4) provides an example of increased value for existing fields and facilities. This possible value creation from extended production is not included in the analysis.
Fact box 4.4 Exploring near infrastructure and extended production – the Norne area
Tying new discoveries back to existing fields and infrastructure can help to keep down unit costs and incentivise continued exploration in the surrounding area. It is therefore important that phasing in future discoveries occurs early in the tail phase before unit costs get too high (fact box 4.5).
Fact box 4.5 Rising unit costs and timely exploration
Petroleum operations also contribute to considerable positive external effects for adjacent industries through productivity improvements. Analyses by Bjørnland and Torvik [13] show that the petroleum sector has substantial external effects on the rest of the economy in terms of both knowledge and technology development.
This industry does not necessarily cause “Dutch disease” by displacing other productive activities. Instead, “infection” from the sector helps to make the wider economy more productive (fact box 4.6). Such productivity effects on the rest of the economy are also excluded from the exploration profitability analysis.
Fact box 4.6 Productivity effects on the wider economy
Exploration for future value creation
The NPD’s analyses show that investment in exploration for oil and gas on the NCS has been extremely profitable. This activity also has spin-offs beyond the petroleum sector and contributes to increased productivity in other sectors. To prevent output and value creation declining rapidly, maintaining a high level of exploration for a long time to come will be important.
Declining production without new resources
Overall output from the NCS is expected to fall rapidly and significantly unless new resources are continuously added. Figure 4.17 shows that a large share of production over the next few years will derive from exploration in the previous decade.
More than 40 per cent of resources expected to be produced in 2030 come from discoveries made after 2010. These discoveries will also help to postpone cessation and increase tail output from existing fields.
Production and value creation
fall rapidly without
new discoveries
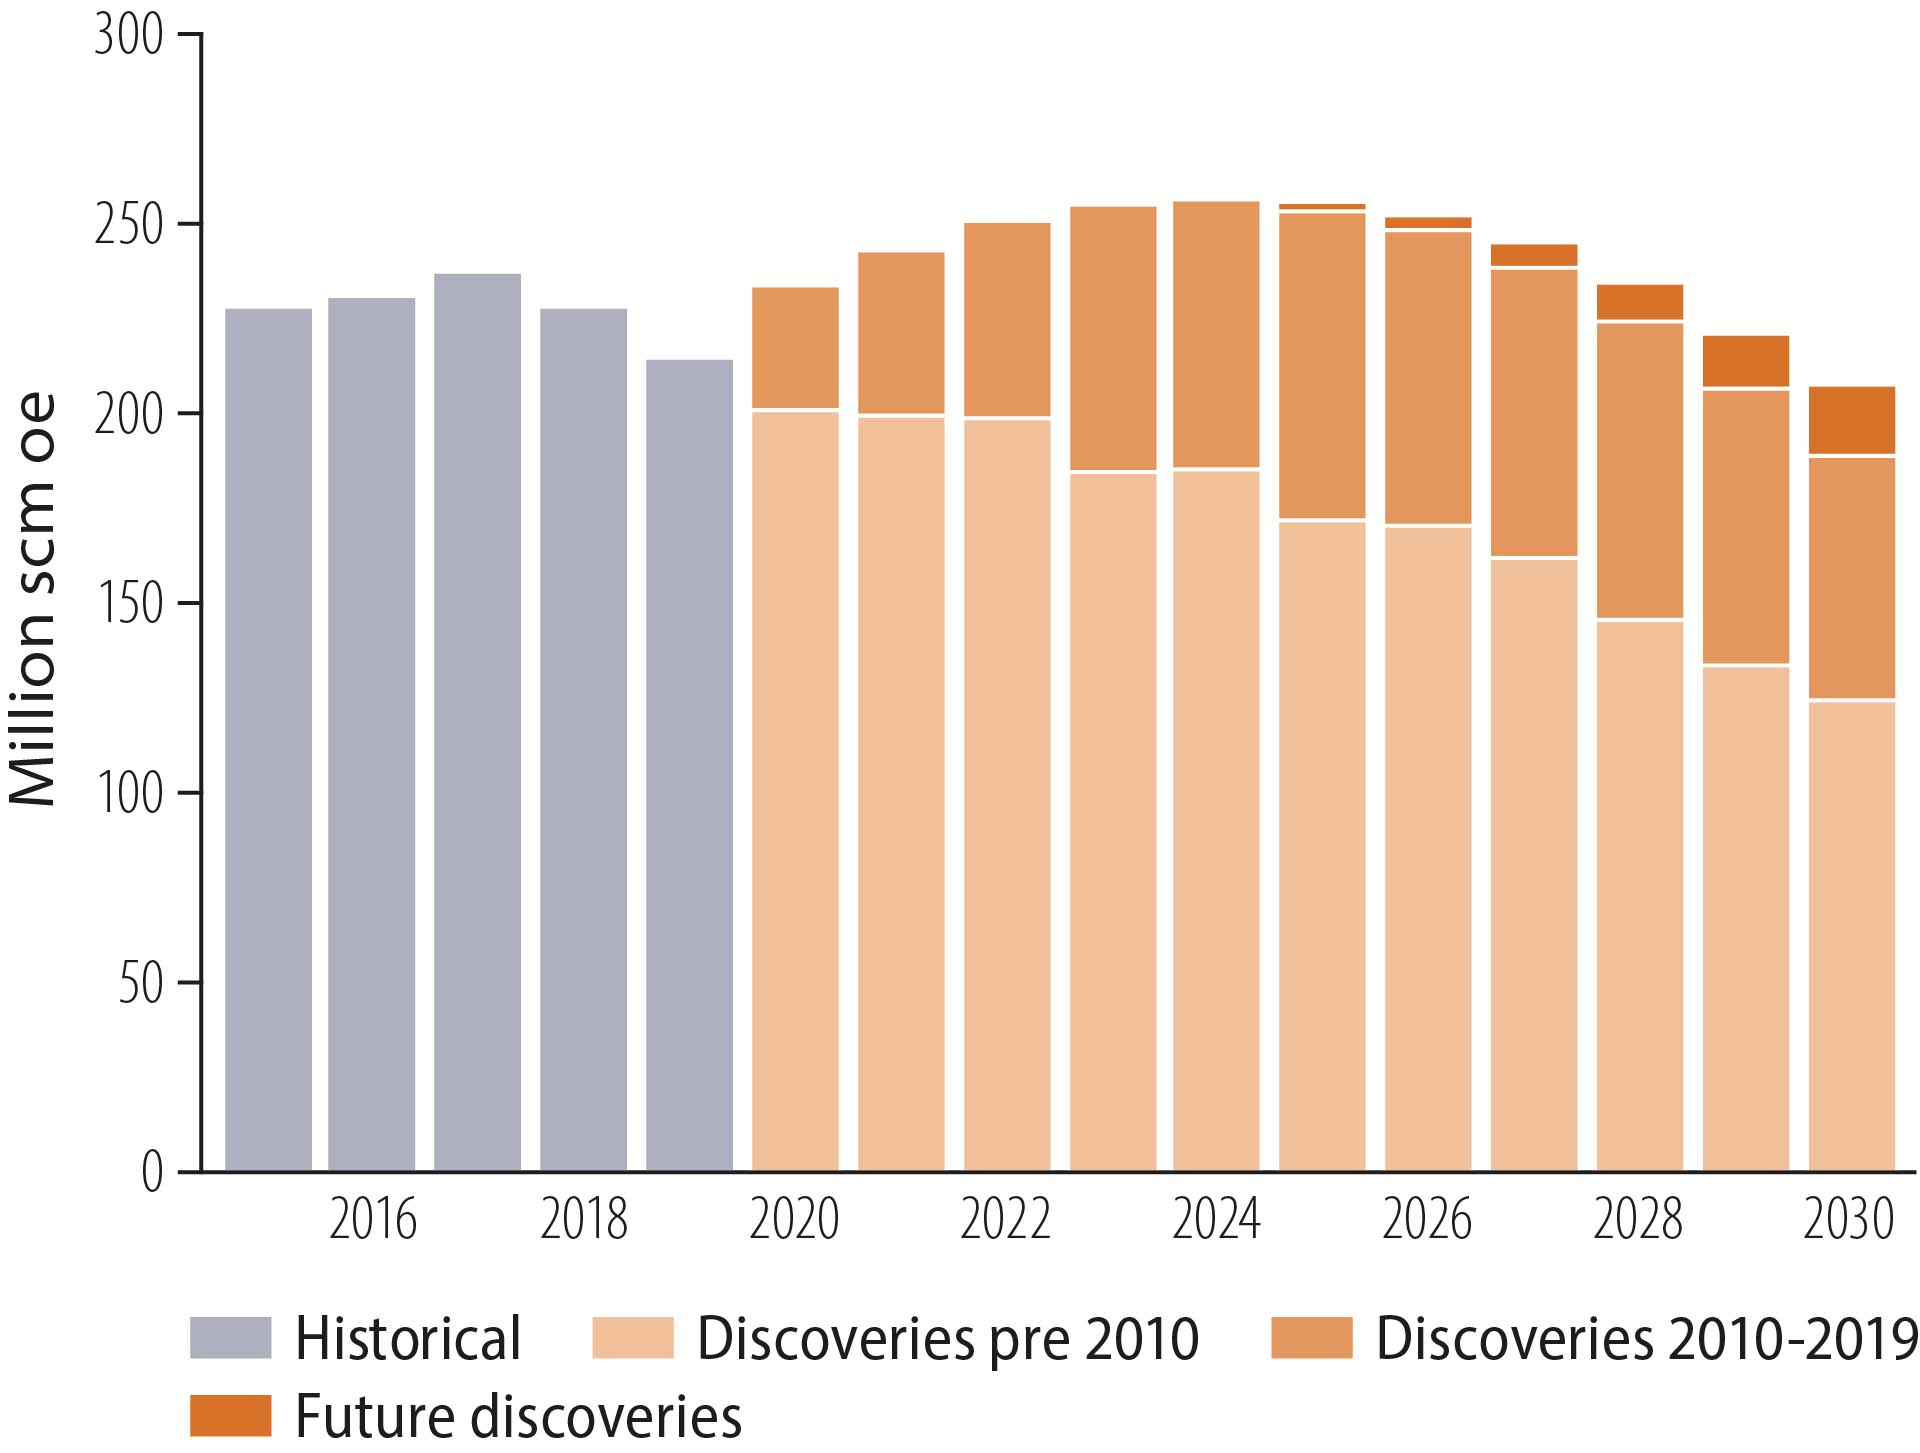
Figure 4.17 Historical and future production
Production will decline substantially after 2030. Forecasts for fields and discoveries reported by the companies for the 2021 national budget show that overall output by 2040 will be about a third of today’s level without new resources (figure 4.18).
This will weaken the economics of producing fields, and overall unit costs could rise substantially. Exploration over the next decade will therefore be very significant for the development of production and value creation after 2030.
If expected resource growth develops in the same way as in the past 10 years, total output could be about two-thirds of the present level in 2040. Lacking a big discovery, comparable with Johan Sverdrup, expected production in that year would be about half today’s figure.

Figure 4.18 Extrapolated production
Future profitability of exploration
Profitability calculations for exploration over the past 20 years show that the return has been very good (figure 4.7). While the average oil price over this period was about USD 65/bbl, unit costs for discoveries were roughly USD 22/bbl – including exploration costs (figure 4.11).
If average unit costs for discoveries remain low, future exploration will be profitable even with low oil prices (figure 4.19). By comparison, the sustainable development scenario in the 2020 World Energy Outlook from the International Energy Agency (IEA) estimates that oil prices will be USD 53/bbl in 2040. The IEA’s stated policies scenario puts the price at USD 76/bbl in 2030 and USD 85/bbl in 2040 [14].
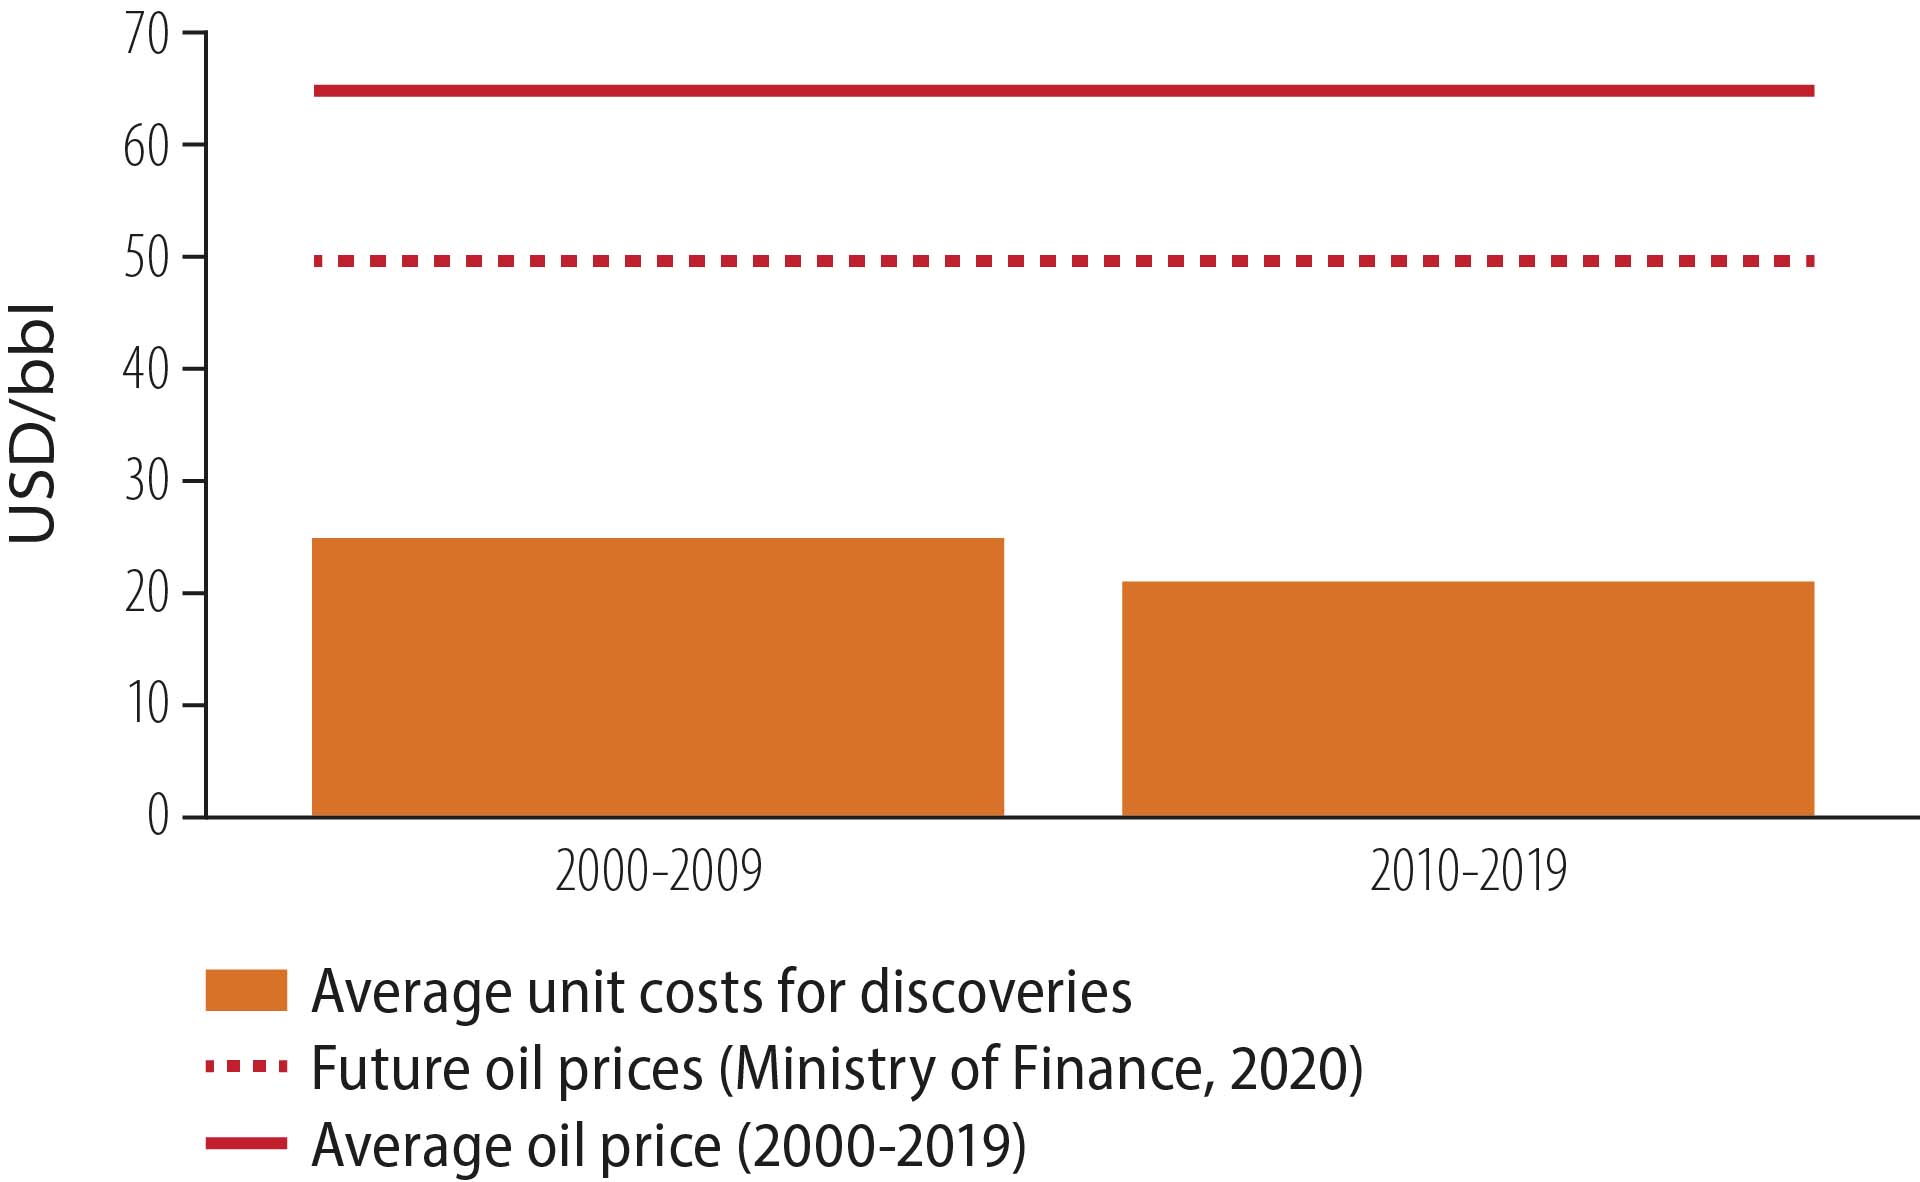
Figure 4.19 Average unit costs for discoveries and oil prices
Exploration will be profitable
even with low
future oil prices
Greater attention is paid to improving efficiency and reducing unit costs when oil prices are expected to fall. At the same time, it is important to phase in new resources before production declines so much that unit costs become too high (fact box 4.5).
Maintaining diversity, competition and expertise
Exploration is an integrated and important part of operations at most companies with interests in production licences on the NCS. Of the 39 players with such interests at 31 December 2019, 36 had licences in the exploration phase (figure 4.20). Thirty-three companies applied for new production licences in the 2020 APA round.
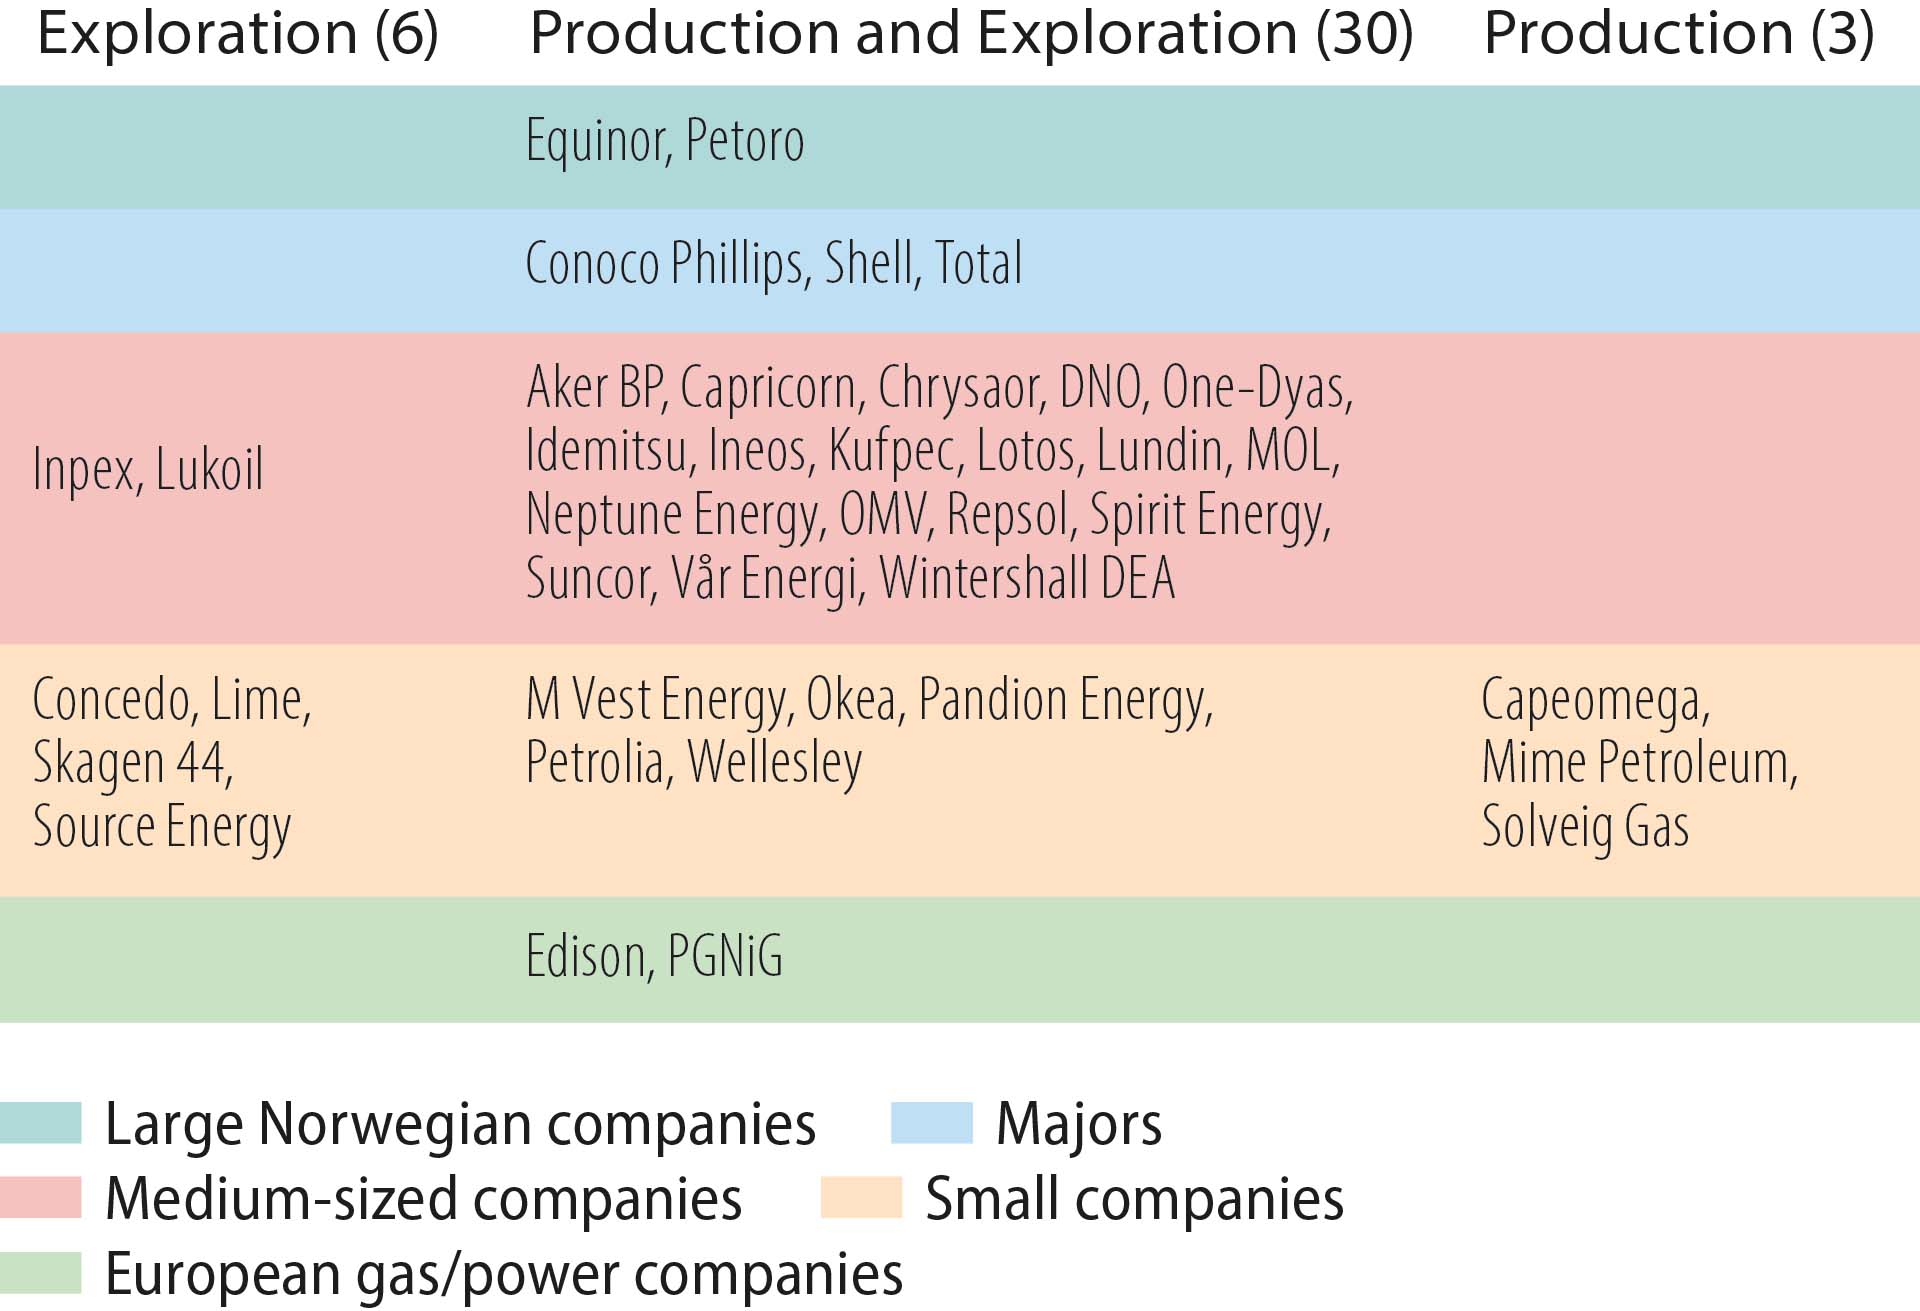
Figure 4.20 Licensees on the NCS by company category and focus areas at 31 December 2019
The figure shows that players concerned to explore are represented in all company categories. They differ in experience, ownership composition, risk willingness and priorities. Overall, this ensures a very diversified exploration environment, which lays the basis for innovation, technology development, growth and value creation.
Strong competition and a diverse range of players at all levels in the value chain are important for good resource utilisation and for ensuring adequate interest in the opportunities available on the NCS.
Exploration leads to innovation
and technology advances
Technological challenges are becoming increasingly complex as resources get more difficult to find. Maintaining diversity and competition in specialist teams is therefore important. Many such groups working on exploration and development are also involved in developing new technology.
The petroleum and supplier industries are knowledge-, technology- and capital-intensive. This expertise can play an important role in overcoming tomorrow’s energy challenges while also safeguarding the climate and the environment (see chapter 6). Technology development and innovation are important for reducing greenhouse gas emissions and the transition to a low-emission society.