

Resource Accounts
High production and an increase in total petroleum resources on the shelf
Oil production on the Norwegian continental shelf (NCS) in 2025 was the highest since 2009. More than half of the production is being replaced with new reserves, and the total petroleum resources on the NCS have increased.
Read about:
Primary trends:
- High liquids and gas production
- Reserve growth replaces 60 per cent of production
- Reduction in contingent resources in fields, but an increase in contingent resources in discoveries
- Slight decline in undiscovered resources
- Overall increase in total petroleum resources
Petroleum resources on the Norwegian continental shelf
Petroleum resources are discovered, discoveries are developed as fields if they are economically and technologically viable, and the oil and gas is produced and sold. This results in dynamic resource accounts that change from year to year.
This report is an appendix to the Resource Accounts as per 31 December 2025 (Excel). The report describes changes from last year's Resource Accounts with the aid of simple analyses, figures and tables. Numbers in figures and tables may deviate from the Resource Accounts due to rounding. Numbers with decimals can be found in the Resource Accounts.
In this report, oil, gas, condensate and liquids are stated in standard cubic metres (Sm3) of oil equivalent (o.e.). Natural Gas Liquids (NGL) is stated in tonnes. See the appendix to the report for the NGL conversion factor. Liquids are the sum of oil, NGL and condensate volumes.
The annual sales volumes for oil and gas from the NCS since 1970 are illustrated in Figure 1-1.
Figure 1-1 This figure shows historical oil and gas sales.
Resource Accounts
According to the Resource Accounts as per 31 December 2025 (Excel), the estimated total resource volumes (including what has been sold and delivered) are:
- 9,037 million Sm³ of liquids
- 6,685 billion Sm³ of gas (1000 Sm³ of gas = 1 Sm³ of o.e.)
- A total of 15,722 million Sm³ o.e.
This is an increase of 111 million Sm³ o.e. compared with the previous year.
The total estimated petroleum resources in each resource class are shown in Table 1-1, along with changes from the Resource Accounts in 2024. Expected values for petroleum resources in each ocean area are shown in Table 1-2.
The petroleum resources are divided into the following classes: reserves, contingent resources and undiscovered resources. The classes are described in the report's appendices.
Discovered resources have increased by 131 million Sm³ o.e. compared with the Accounts for 2024. Remaining discovered resources have been reduced by 112 million Sm3 o.e., including last year's total production of 243 million Sm3 o.e. Undiscovered resources have been reduced by 20 million Sm³ o.e. in opened areas. There was no change in undiscovered resources in unopened areas.
Table 1-1 This figure shows expected values for petroleum resources in different resource classes as per 31 December 2025, with changes from 2024.
Table 1-2 This figure shows expected petroleum resources in each ocean area as per 31 December 2025, with changes from 2024.
Changes in the various resource classes over the past year are shown in Figure 1-2. The change in the volume of overall resources in 2025 is 0.71 per cent of the total petroleum resources of 15,722 million Sm³ o.e.
Figure 1-2 This figure shows the changes in resource volume for 2025 distributed by resource classes in the Resource Accounts. The Y axis starts at 15,000 million Sm³ o.e. in order to highlight the various changes.
The volumes of contingent resources in fields (meaning resources still awaiting a production decision) have been reduced by 70 million Sm³ o.e., and contingent resources in discoveries have increased by 54 million Sm³ o.e.
There was a minor reduction in the volume of undiscovered resources. This was caused by a combination of a decline in undiscovered resources in the North Sea and the Norwegian Sea, as well as a minor increase in the Barents Sea.
Total petroleum resources have increased by 111 million Sm³ o.e. since 2024. In comparison, last year saw an increase of 36 million Sm³ o.e. in total petroleum resources.
The distribution of and uncertainty in the remaining resource volumes, along with the volume sold and delivered as per 31 December 2025, are shown in Figure 1-3.
The expected volume of recoverable petroleum is shown in the middle of the columns, and the uncertainty in the overall estimates is illustrated in the low estimate (P90) on the left and the high estimate (P10) on the right of each column. There are more uncertainty factors associated with undiscovered and contingent resources than reserves. These uncertainties include e.g. geology, technology and economics. The uncertainty in the estimates declines as the resources become more matured.
The pie chart on the right side of the figure shows the distribution across resource classes for the expected volume of the total resources. The total volume has increased somewhat compared with 2024, and the distribution has changed as a result of last year's production as well as the change in reserves and resources.
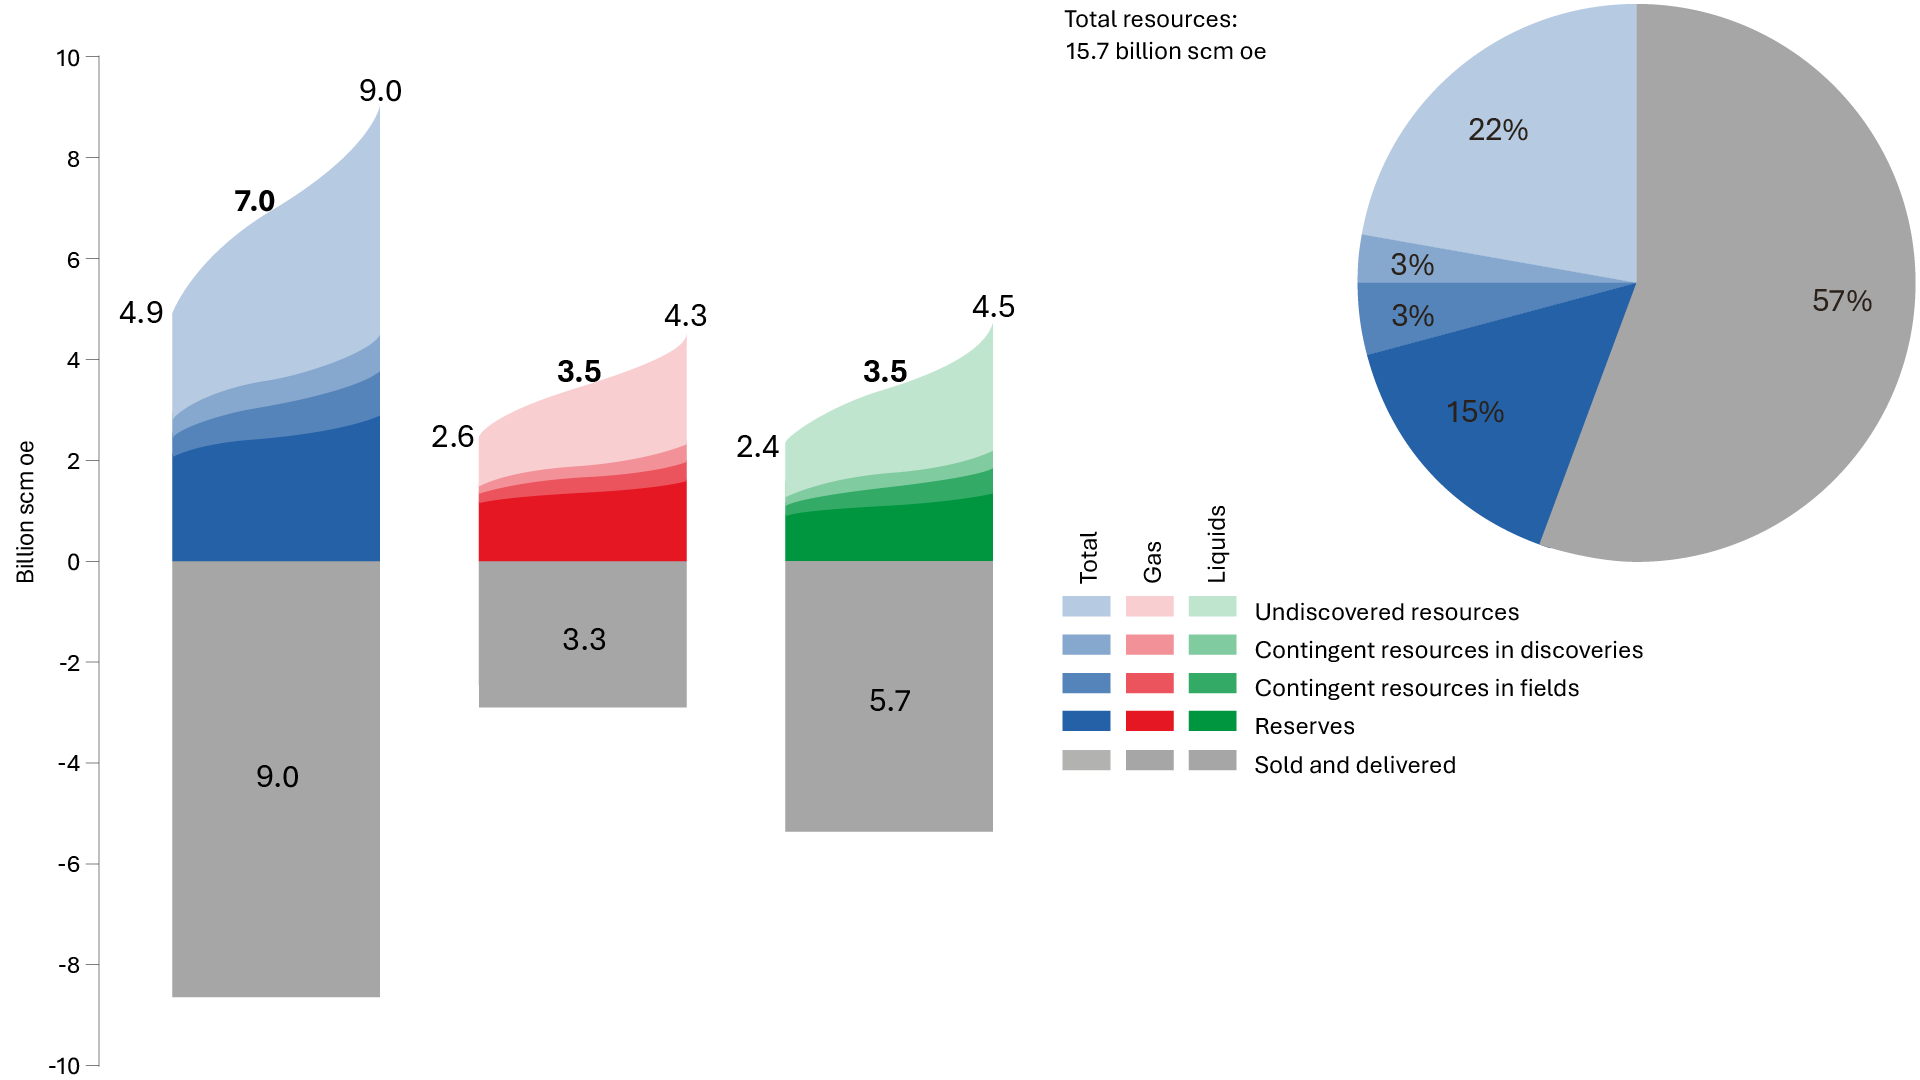
Figure 1-3 This figure shows petroleum resources and uncertainty in the estimates as per 31 December 2025.
Resource development
Resource estimates for petroleum will change over time. New knowledge and technology will affect the expected value and uncertainty associated with the total resources. As the resources are mapped, proven, matured and finally produced, their resource class will also change. Figure 1-4 shows the estimates per class since 1990.
Figure 1-4 This figure shows development in the expected value for petroleum resources on the NCS.
Discovered gas and liquids resources have increased over the last ten years. Discovered liquids resources have increased by just over 6 per cent between 2016 and 2025, while discovered gas resources have increased by nearly 9 per cent. The increase in discovered resources in 2025 is slightly higher than the average for this ten-year period for both liquids and gas.
Undiscovered liquids resources have increased by 29 per cent between 2016 and 2025, while undiscovered gas resources have increased by 14 per cent. Estimated undiscovered resources increased in 2017, as resources in the Barents Sea North were included. Undiscovered gas and liquids resources have gradually declined in subsequent years.
Petroleum resources in Norwegian ocean areas
The ocean areas of the North Sea, Norwegian Sea and Barents Sea are different both as regards geology, resource base, maturity and scope of infrastructure. An overview of resources in the three ocean areas can be found in the Resource Accounts as per 31 December 2025 (Excel).
There has been petroleum activity in the North Sea since 1965. The Norwegian Sea and Barents Sea (areas north of the 62nd parallel) were opened for petroleum activities in 1980.
The remaining resources and distribution between discovered and undiscovered resources in opened and unopened areas, respectively, differ between the three ocean areas. The expected estimates are presented in Figure 1-5, which illustrates the distribution for liquids and gas, respectively. The volume estimates do not reflect uncertainty, which declines with increasing maturity.
In the North Sea, which has the longest history of petroleum activity, the majority of resources are already subject to production decisions. Of the remaining resources in the North Sea, 59 per cent are classified as reserves, with a somewhat higher percentage for gas.
In the Norwegian Sea, reserves account for 29 per cent of remaining total resources, and the largest contributor is gas. Undiscovered resources make up the largest share of the remaining resources with 56 per cent.
Vast areas in the Barents Sea have yet to be opened for petroleum activity, and this is where we find the greatest expected value for undiscovered resources. Eighty-two per cent of the remaining liquids and gas resources in the unopened and opened areas in the Barents Sea have yet to be discovered.
Figure 1-5 This figure shows expected remaining volumes of liquids and gas resources distributed by ocean areas and resource classes. Liquids resources are shown in green and gas resources in red.
Updated: 2/27/2026