Foreword
The world is changing rapidly. Energy markets are turbulent, the geopolitical landscape is in flux, and technological development is accelerating. In the midst of this stands the Norwegian continental shelf, which for several decades has provided Norwegian society with energy, income and value creation.
The story began in the mid-1960s, with the first exploration permit and the strong conviction that oil and gas resources were present on the Norwegian continental shelf. In the summer of 1966, the first exploration well was drilled. Three years later came Ekofisk - the discovery which would redefine Norway. Production started in 1971, and the following year the Norwegian Petroleum Directorate, now called the Norwegian Offshore Directorate, was established.
Since then, our mission has been to contribute towards achieving the primary goal of Norway's petroleum policy. This includes contributing to the best possible value creation for society through efficient and responsible resource management, whilst taking into account health, safety, the environment, and other users of the ocean.
To succeed in this, the government must be optimally informed about the resource base on the Norwegian continental shelf. A key task for the Norwegian Offshore Directorate is therefore to build knowledge around the resource potential and share analyses providing insight into how this resource potential may develop over time. The Resource Report 2026 is a significant contribution to this work.
Sixty years on from the first exploration licences, there remains a great need for knowledge regarding the resources on the Norwegian continental shelf. We know far more now than the pioneers of the 1960s did, but the future is not a given.
The resources are there. The scale of their recovery depends on the choices we make today. The resources on the Norwegian continental shelf can be developed by applying the same principles which have characterised activities since the very beginning: knowledge, technology, willingness to invest – and the courage to explore new opportunities.
To make good decisions, society needs the best possible knowledge base. This report is a contribution to that. Good resource management starts with a comprehensive knowledge of resource availability.

Kjersti Dahle
Director Offshore New Ventures
Summary
High activity level
The activity level on the Norwegian continental shelf (NCS) is high. Oil production in 2025 was the highest since 2009, and investments for 2026 are estimated at approximately NOK 230 billion. The high level of investment reflects strong confidence in the resource base and future profitability.
Resources for long-term production
The total expected remaining resources are estimated at approximately 7 billion standard cubic metres of oil equivalent. Around half of these have not yet been discovered.
This provides a basis for production, exports and value creation for society for a long time to come.
But this type of progress does not happen by itself. Production is expected to remain high until the end of the 2020s and then decline. To halt the decline, more exploration is needed, both in well-explored areas and in underexplored areas.
In addition, more investments must be made in fields, discoveries, infrastructure and technology development. A lack of investment will lead to a rapid dismantling of the petroleum industry.
Oil and gas up to 2050
The Norwegian Offshore Directorate has prepared three scenarios for the total production of oil and gas up to 2050. All three scenarios depict a decline in production, but how quickly this happens depends on exploration activity, willingness to invest and technology development, inter alia.
The scenarios describe a wide range of opportunities for developments in production up to 2050. In High, robust exploration activity, more discoveries and rapid technology development help to maintain a high production level, at approximately 65 per cent of today's level in 2050.
In Low, a reduced willingness to invest and limited exploration activity result in rapid downsizing of operations, with production dwindling to approximately 5 per cent of today's level in 2050.
The difference in net present value between the High and Low scenarios is estimated at around NOK 3 200 billion based on the same oil and gas price. Based on a high price in High and a low price in Low, the corresponding difference is NOK 8 300 billion.
Plenty left to discover
To secure sufficient resources to maintain activity and production over time, more exploration is needed, both close to existing infrastructure and in less explored areas.
Exploration close to fields yields good returns and many discoveries, but the discoveries are generally small and result in limited resource growth.
More exploration is required in underexplored areas, where the potential for large discoveries is greatest to avoid a rapid decline in production.
Profitable exploration
The Norwegian Offshore Directorate has analysed exploration activities in the period 2000–2025. The analysis shows that oil and gas exploration on the NCS has been extremely profitable.
Of approximately 730 exploration wells drilled during this period, 370 were classified as discoveries. The net present value from exploration activities is estimated at close to NOK 4,000 billion.
Every krone invested in exploration has on average returned NOK 4. Exploration is profitable in all sea areas on the shelf.
Improved recovery from the fields
Whilst the NCS already has an average recovery rate of about 50 per cent, various measures can extend the lifetime of the fields and increase resource utilisation. In 2025, the companies submitted around 145 specific projects for improved recovery, corresponding to an estimated 280 million scm of oil equivalent.
These include the drilling of more production wells, low-pressure production, late-phase production, as well as injection and advanced methods.
The drilling of new production wells is the single most important measure. In 2025, more than 60 per cent of oil production came from wells drilled post- 2020.
Advanced methods for improved recovery (EOGR) have great technical potential but are being downgraded by the industry due to technical uncertainty, strict profitability requirements and regulatory barriers. The window of opportunity to realize this potential is limited, and as the infrastructure is decommissioned, so too the opportunities disappear.
Many discoveries have not yet been developed
The discovery portfolio on the NCS currently consists of over 90 discoveries with a total over 500 million scm oe in contingent resources. The overall picture is one of many small discoveries dependent on infrastructure with spare capacity in order to be developed.
Since the discoveries are small, profitable development largely requires tie-back to existing infrastructure, either as subsea developments or as wells from existing facilities. This in turn requires collaboration and good area solutions.
The lead time from discovery to production start-up is currently long. The industry is actively working to reduce lead times. Shorter lead times may allow more discoveries to be profitably developed.
Increased gas export capacity from the Barents Sea
The High North has the largest remaining resource potential on the NCS. Large areas of the Barents Sea are still underexplored, and significant areas have not been opened for petroleum activities.
Without increased gas export capacity, large portions of the resources in the Barents Sea may remain unexploited, and exploration will remain unattractive to the companies.
Hammerfest LNG at Melkøya is currently the only facility for gas export from the Barents Sea and is fully utilised by the Snøhvit field.
Increased gas export capacity can speed up production from existing fields and discoveries by up to 20-30 years and pave the way for new discoveries earlier than with current capacity. This in turn may increase exploration activity in the least explored areas of the Barents Sea.
A more concentrated player landscape
The number of companies on the NCS has more than halved since 2013. Large international companies have pulled out, and the development of new projects on the shelf is now largely dominated by Norwegian-based companies such as Equinor, Aker BP and Vår Energi.
A more concentrated player landscape can diminish both the geoscientific diversity of ideas and the competition for attractive acreage, which has historically been crucial for large discoveries.
Backdrop
In this chapter:
- Significant resources remain
- High activity – great values
- Exploration is crucial
- Production up to 2035
- Improved recovery extends lifetime
- Infrastructure, discoveries and fields – interdependence
- Strengthening diversity with companies that are willing and able
- Three scenarios
- Competence and technology development
Significant resources remain
The remaining resources on the NCS are considerable. The total expected resource volumes (including those sold and delivered) are estimated at around 16 billion standard cubic metres of oil equivalents (scm oe), of which approximately 7 billion scm oe are expected remaining resources.
Of the expected remaining resources, about half are reserves and resources in discoveries and fields, while the other half are undiscovered resources. The undiscovered resources are associated with the greatest uncertainty but also represent the greatest long-term resource potential, as illustrated in Figure 1.1.
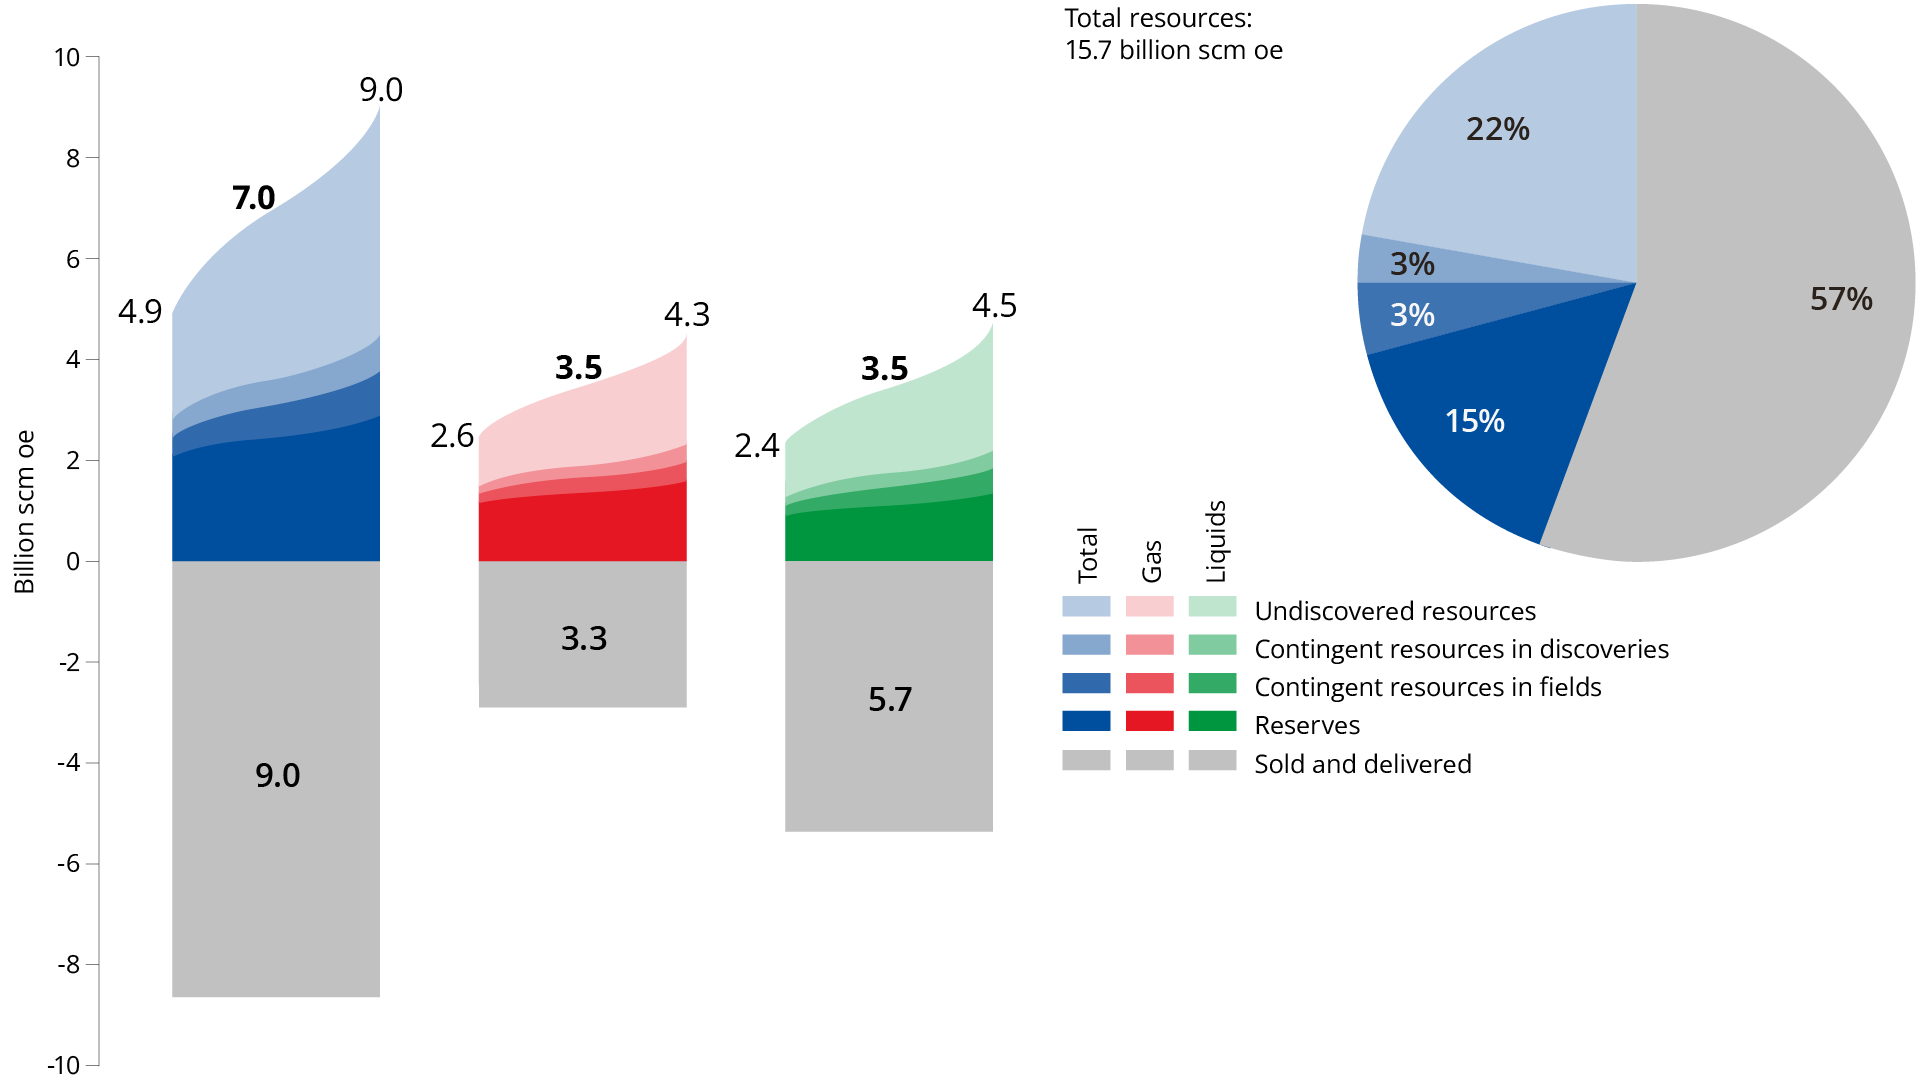
Figure 1.1 Total resources on the NCS as of 31.12.2025 (1). The expected volume of recoverable petroleum is shown in the middle of the bars, and uncertainty in the total estimates is illustrated by a low estimate (P90) to the left and a high estimate (P10) to the right in each bar. The pie chart on the right of the figure shows the distribution by resource class for the expected volume of the total resources.
The remaining resources are unevenly distributed across the sea areas. The North Sea and the Barents Sea currently have about the same total resource volumes, but there is a large difference in maturity (Figure 1.2).
About sea areas
The Norwegian Offshore Directorate uses delimitation of the Barents Sea, the Norwegian Sea and the North Sea in accordance with the management plan for Norwegian sea areas, which deviate from purely geographical or geological definitions.
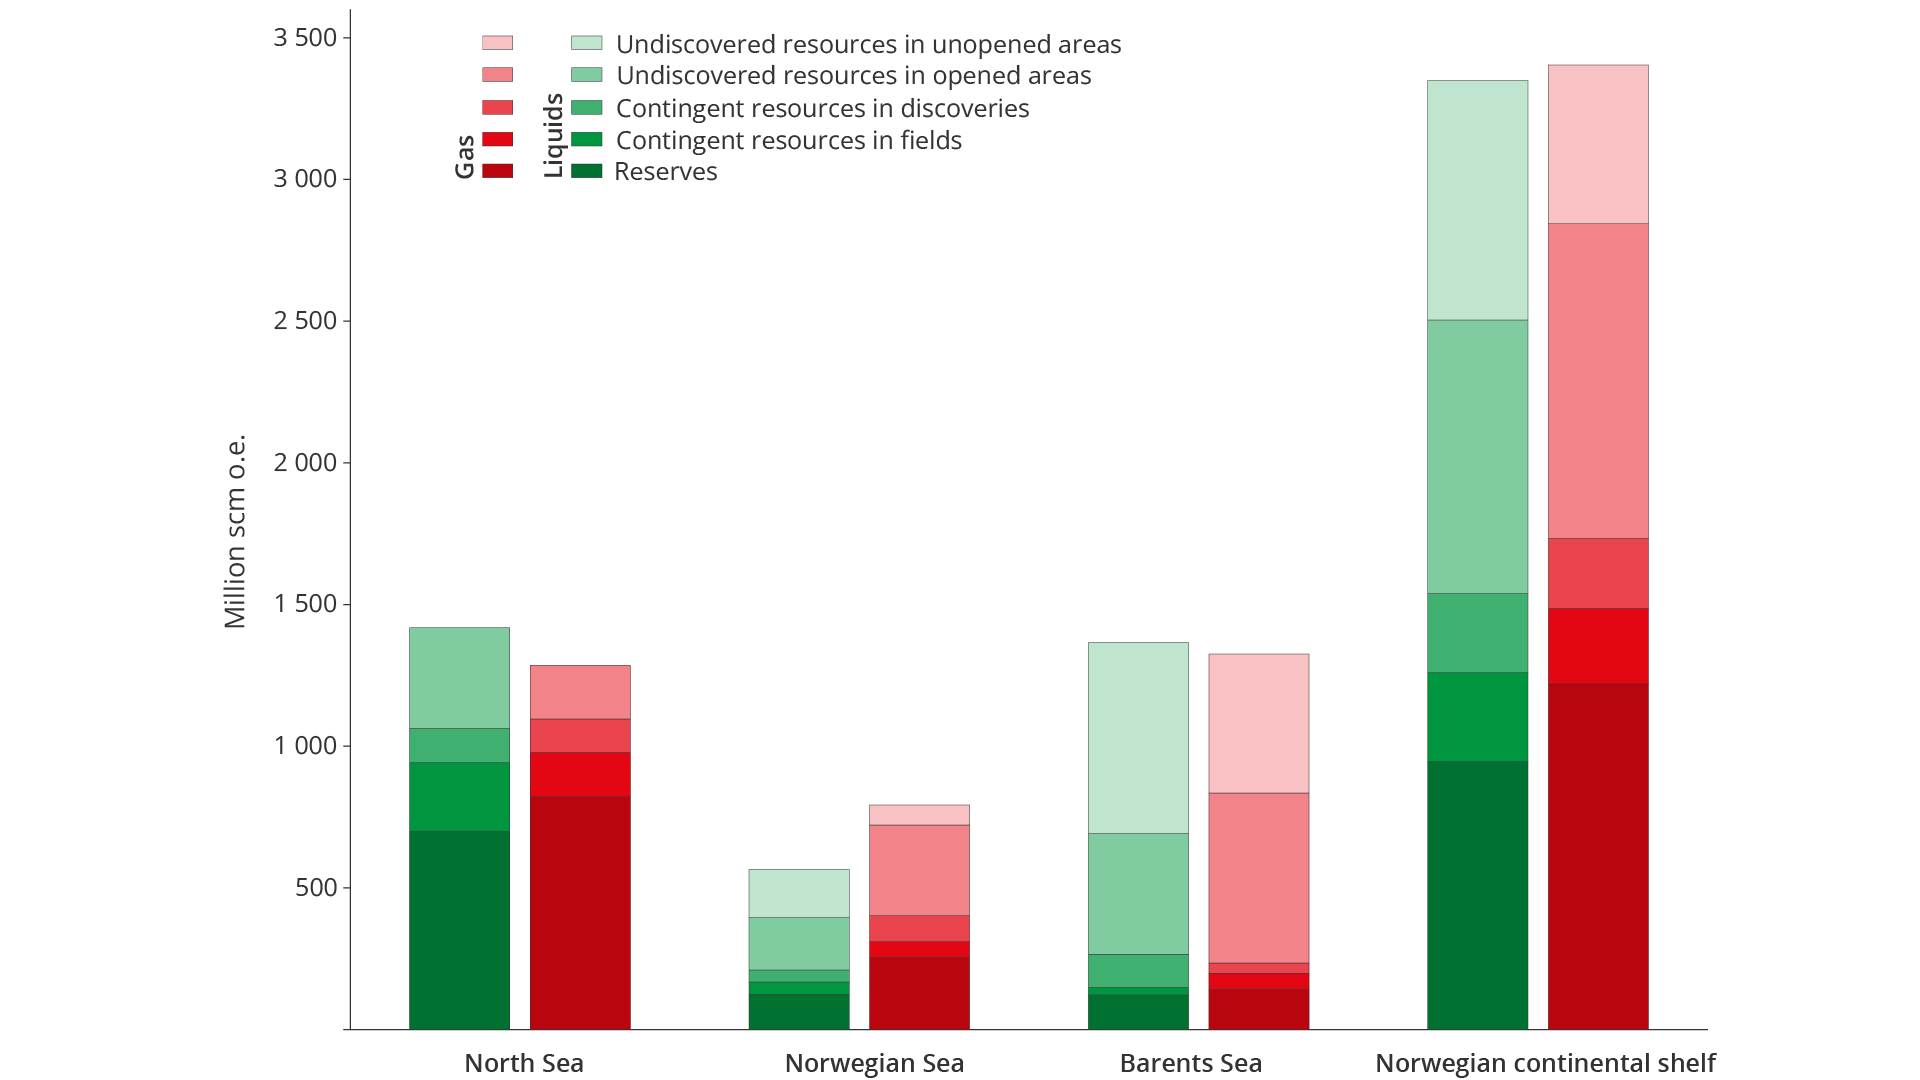
Figure 1.2 Remaining resources on the NCS as of 31.12.2025 by sea area.
In the North Sea, most of the resources consist of reserves and contingent resources that have already been approved or assessed for recovery. This reflects 60 years of exploration, development and operation, and relatively low uncertainty related to the resource base.
In the Barents Sea, most of the resources remain undiscovered. The sea area has few fields in production, and large parts of the expected resource base have not yet been proven. This provides considerable long-term potential, but also greater uncertainty and a longer time horizon before the resources can be recovered.
The Norwegian Sea lies between these extremes, with a mix of mature resources in fields and discoveries and considerable undiscovered potential.
High activity – great values
The petroleum industry is Norway's largest industry measured in value creation, government revenues, investments and export value. In 2026, the industry is expected to account for 22 per cent of total value creation and 47 per cent of export values (Figure 1.3). More than 210 000 people are directly or indirectly connected to the petroleum industry (2).
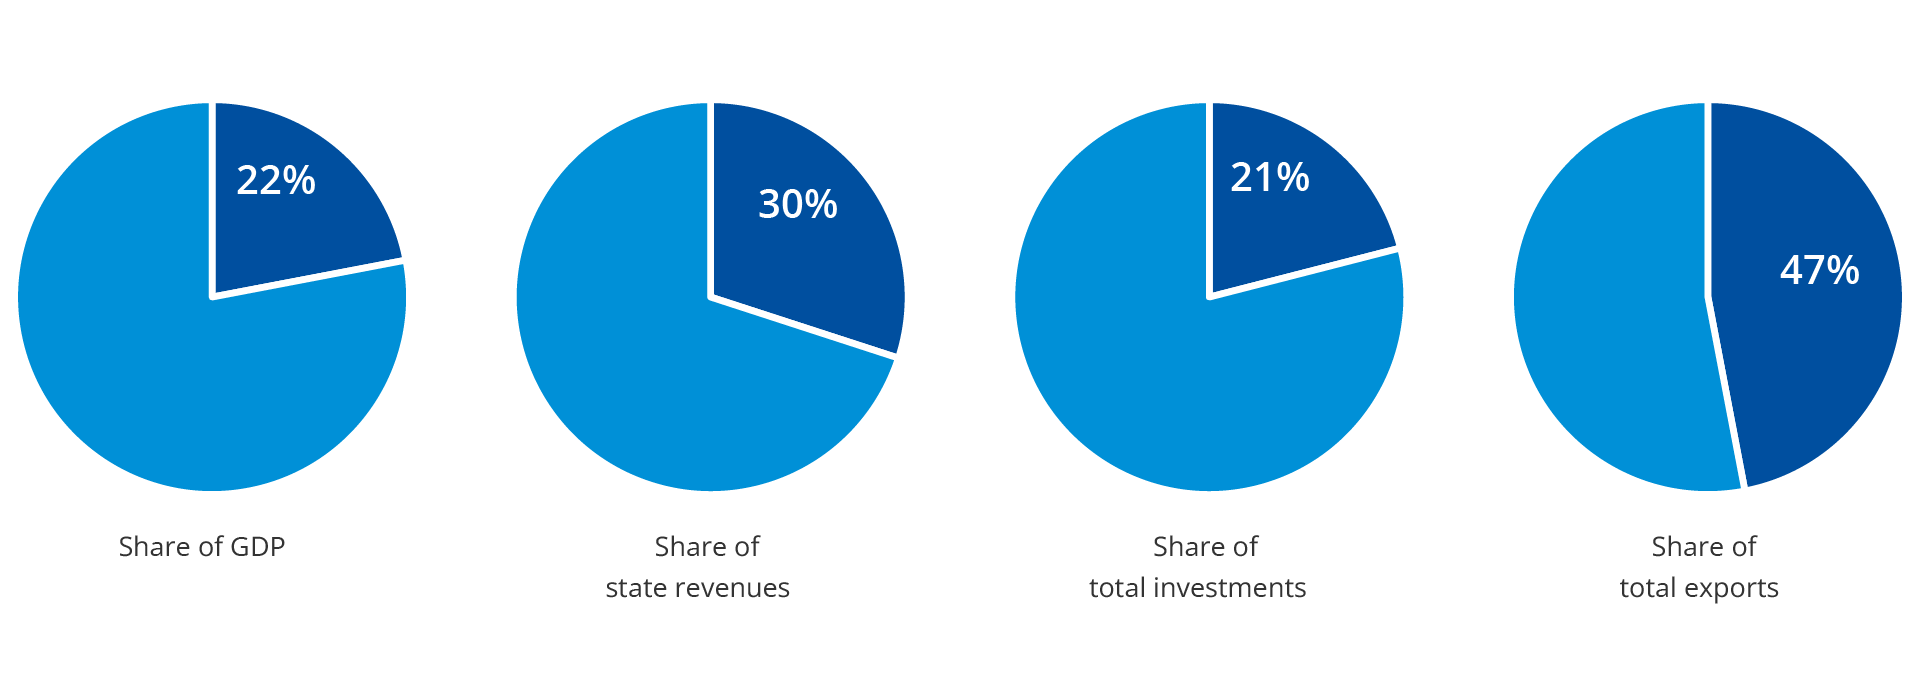
Figure 1.3 Macroeconomic indicators for the petroleum sector in 2026 (3).
Oil production in 2025 was the highest since 2009. At the same time, exploration activity was high, with 50 spudded exploration wells and 21 discoveries. This shows that the NCS is still an attractive and productive area for exploration and production. The ongoing activity lays the foundation for continued value creation in the decades to come.
Investments in the petroleum industry for 2026 are estimated at approximately NOK 230 billion. The high level of investment reflects strong confidence within the industry in both future profitability and the resource base on the NCS.
Exploration is crucial
Exploration is crucial for long-term production development. A large part of the production expected in the future comes from resources which have not yet been proven. Exploration activity is primarily concentrated in well-explored areas, which yields many small discoveries, good returns and contributes to extending production on existing fields.
At the same time, this results in limited resource growth (Figure 1.4). To strengthen long-term production, more exploration must be carried out in underexplored areas, where the probability of larger discoveries is higher.
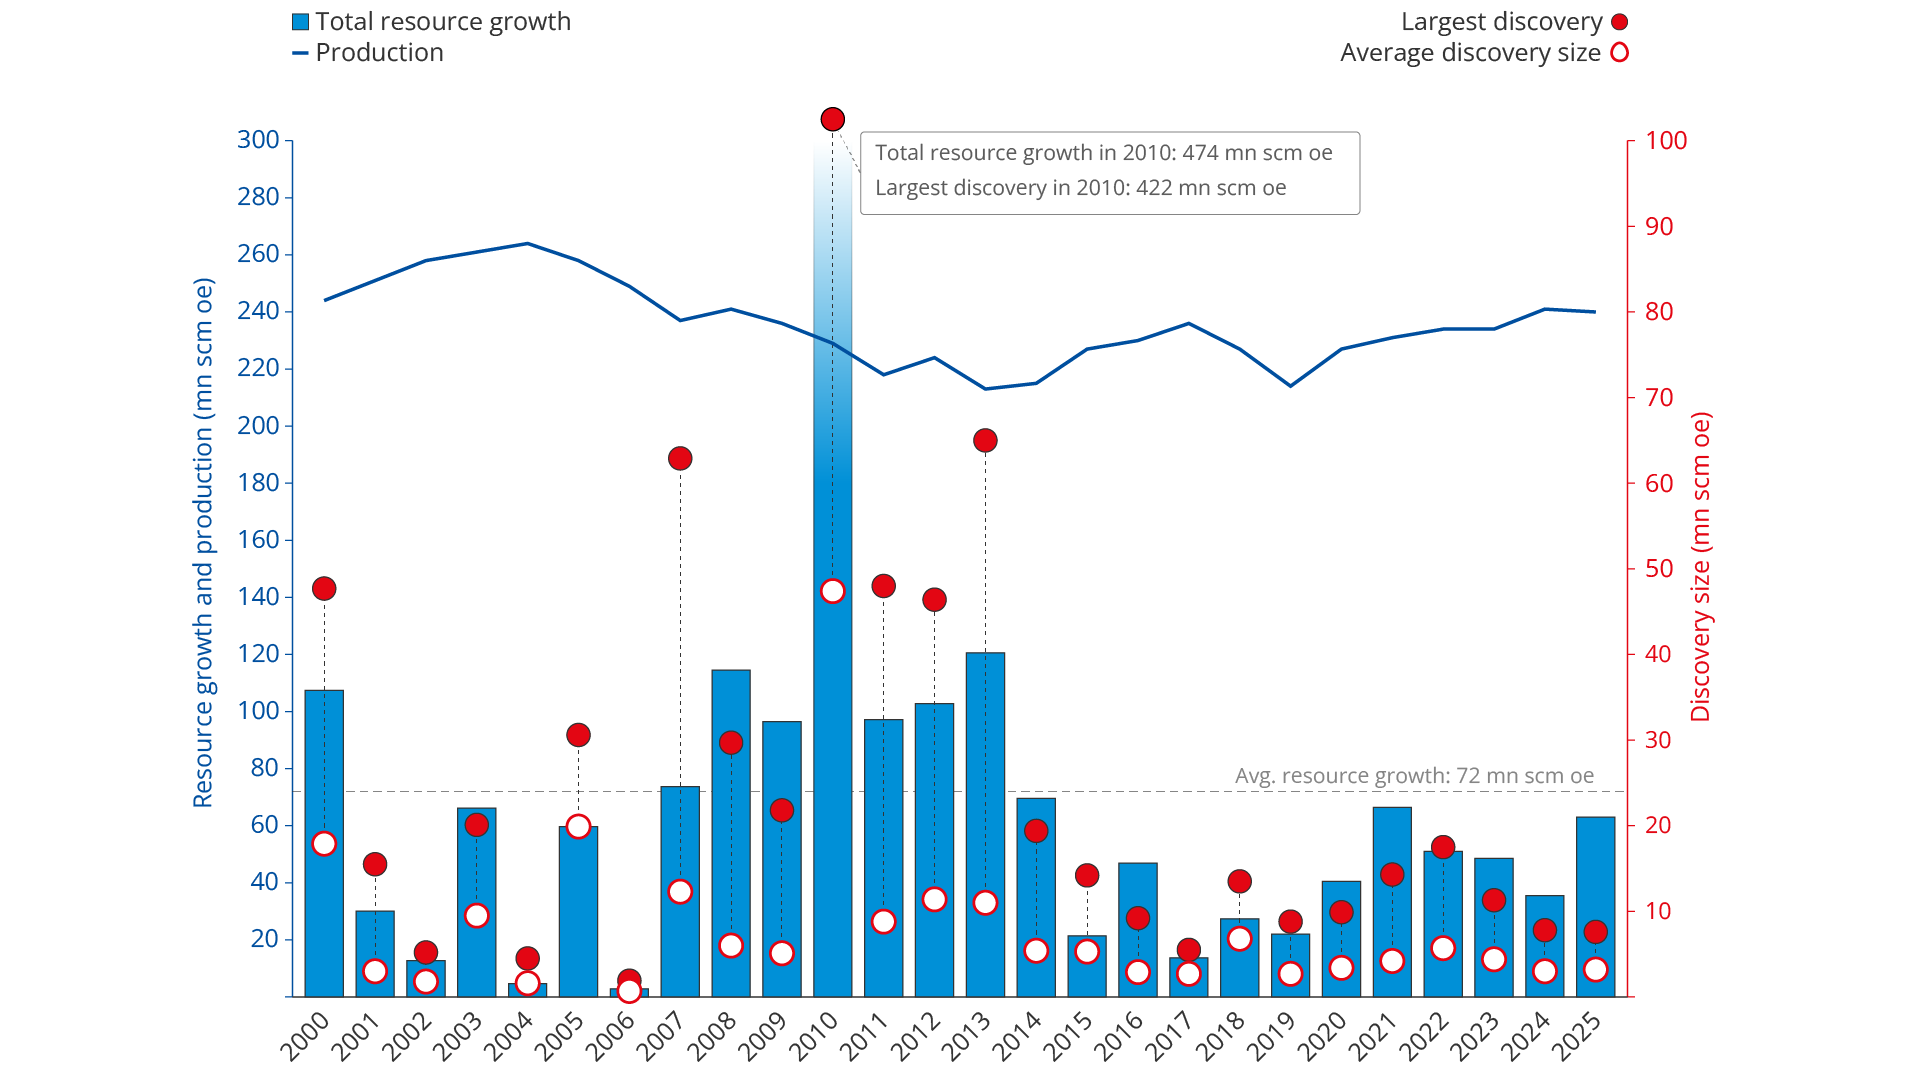
Figure 1.4 Average discovery size, largest discovery, resource growth and production per year, 2000–2025 (excluding resource class 6)
Production up to 2035
Total production is expected to remain high until the end of the 2020s. Forecasts show that production will then gradually decline to around 160 million Sm³ of oil equivalent in 2035.
Resources in fields and discoveries are becoming increasingly important leading up to 2035 and account for an increasing share of production (Figure 1.5). To avoid a steep decline in production, it is essential to develop the remaining resources in fields and discoveries.
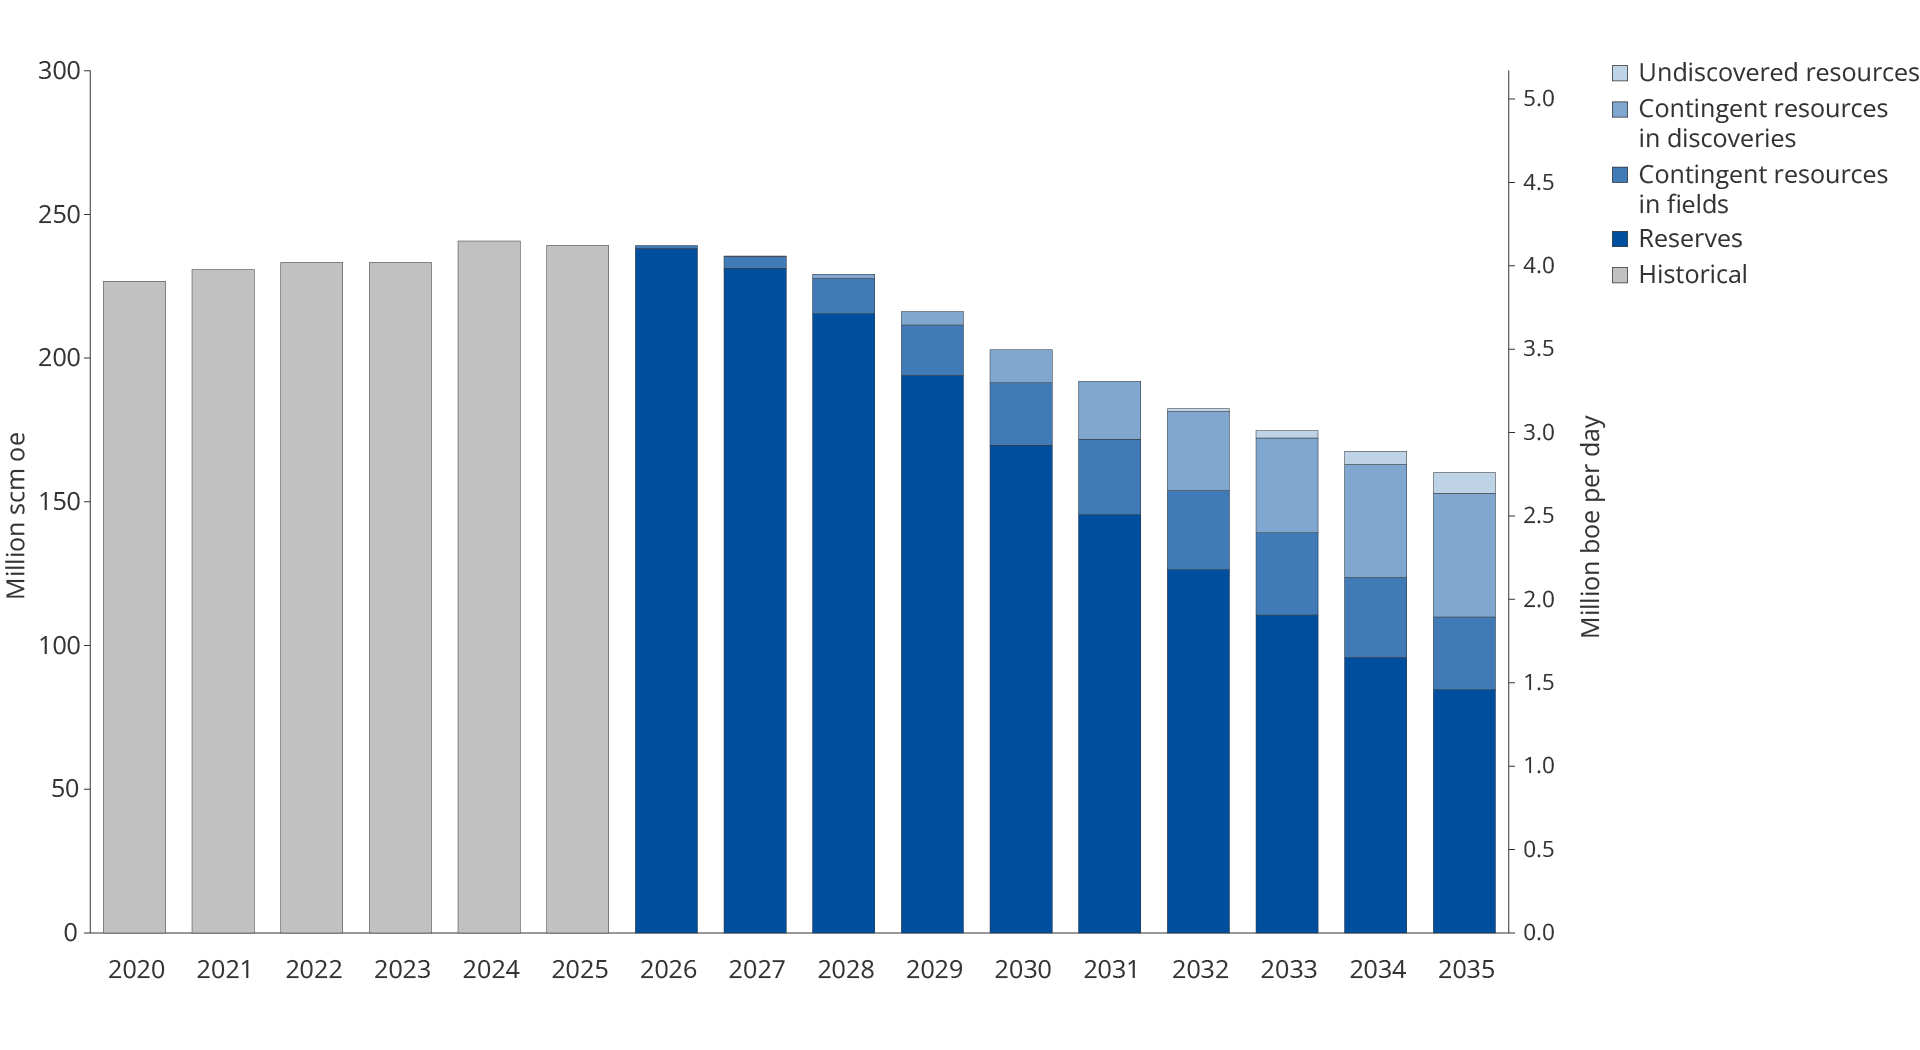 Figure 1.5 Production development on the NCS up to 2035 based on reporting to the Revised National Budget 2026 (RNB 2026)
Since the turn of the millennium, the number of producing fields has increased significantly, while average production per field has fallen. Several large fields which have accounted for most of the production are now mature (Figure 1.6). The expected decline in production in these fields can be counteracted to some extent by developing several smaller discoveries and developing more demanding resources.
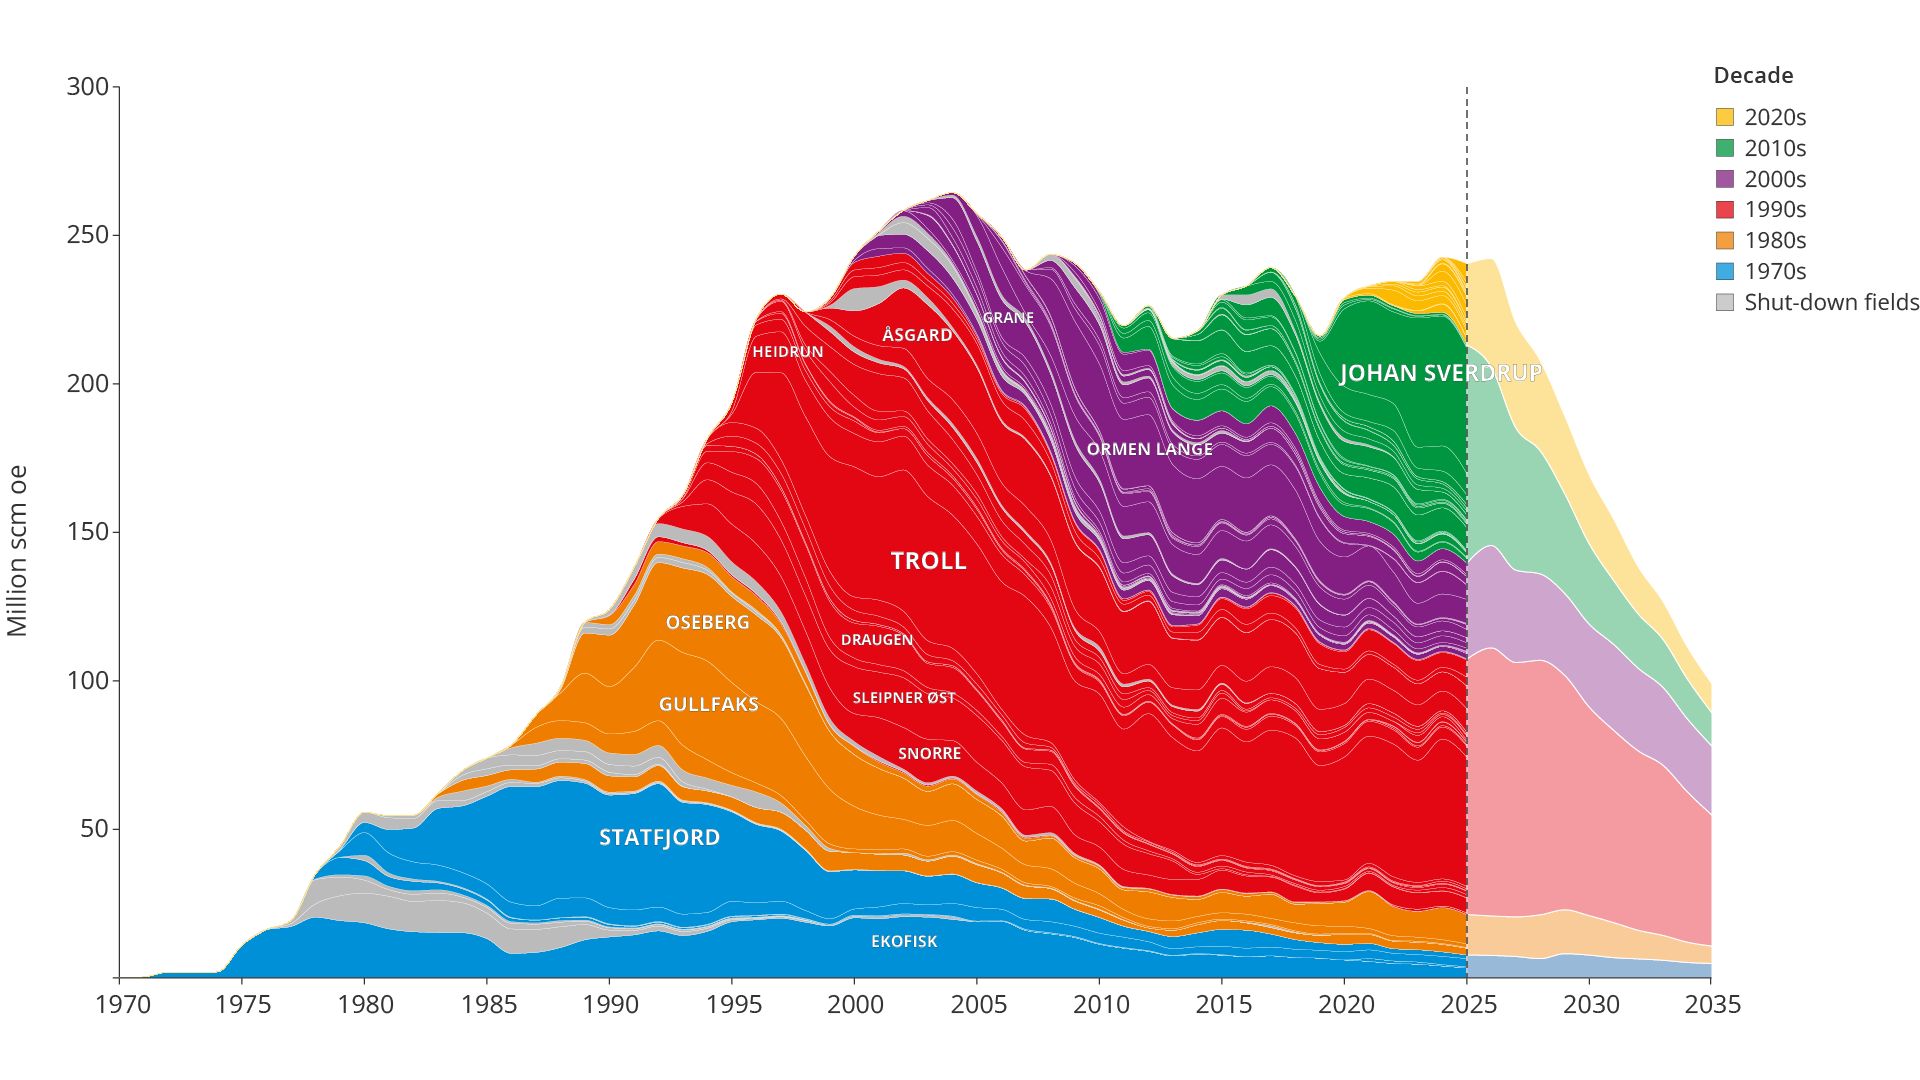
Figure 1.6 Historical production development and production forecast
Improved recovery extends lifetime
Improved recovery from existing fields is one of the most important tools for slowing down the decline in production. Although the NCS already has a high recovery rate, moderate improvements can yield large volume gains, given the size of the overall field portfolio.
Several measures can extend the fields‘ lifetime and increase resource utilisation. This includes the drilling of additional production wells, tie-in of new discoveries, new well technology, improved injection methods and advanced reservoir monitoring.
The NCS has several examples of fields originally planned to be shut down a long time ago, which are still producing due to improved recovery, technology development and ongoing investments in further development. Ekofisk, Statfjord, Oseberg and Valhall are examples of how active resource management can extend field lifetimes significantly and create substantial added value. As Figure 1.7 illustrates, production from a number of fields has been extended significantly beyond the lifetime assumed upon PDO approval.
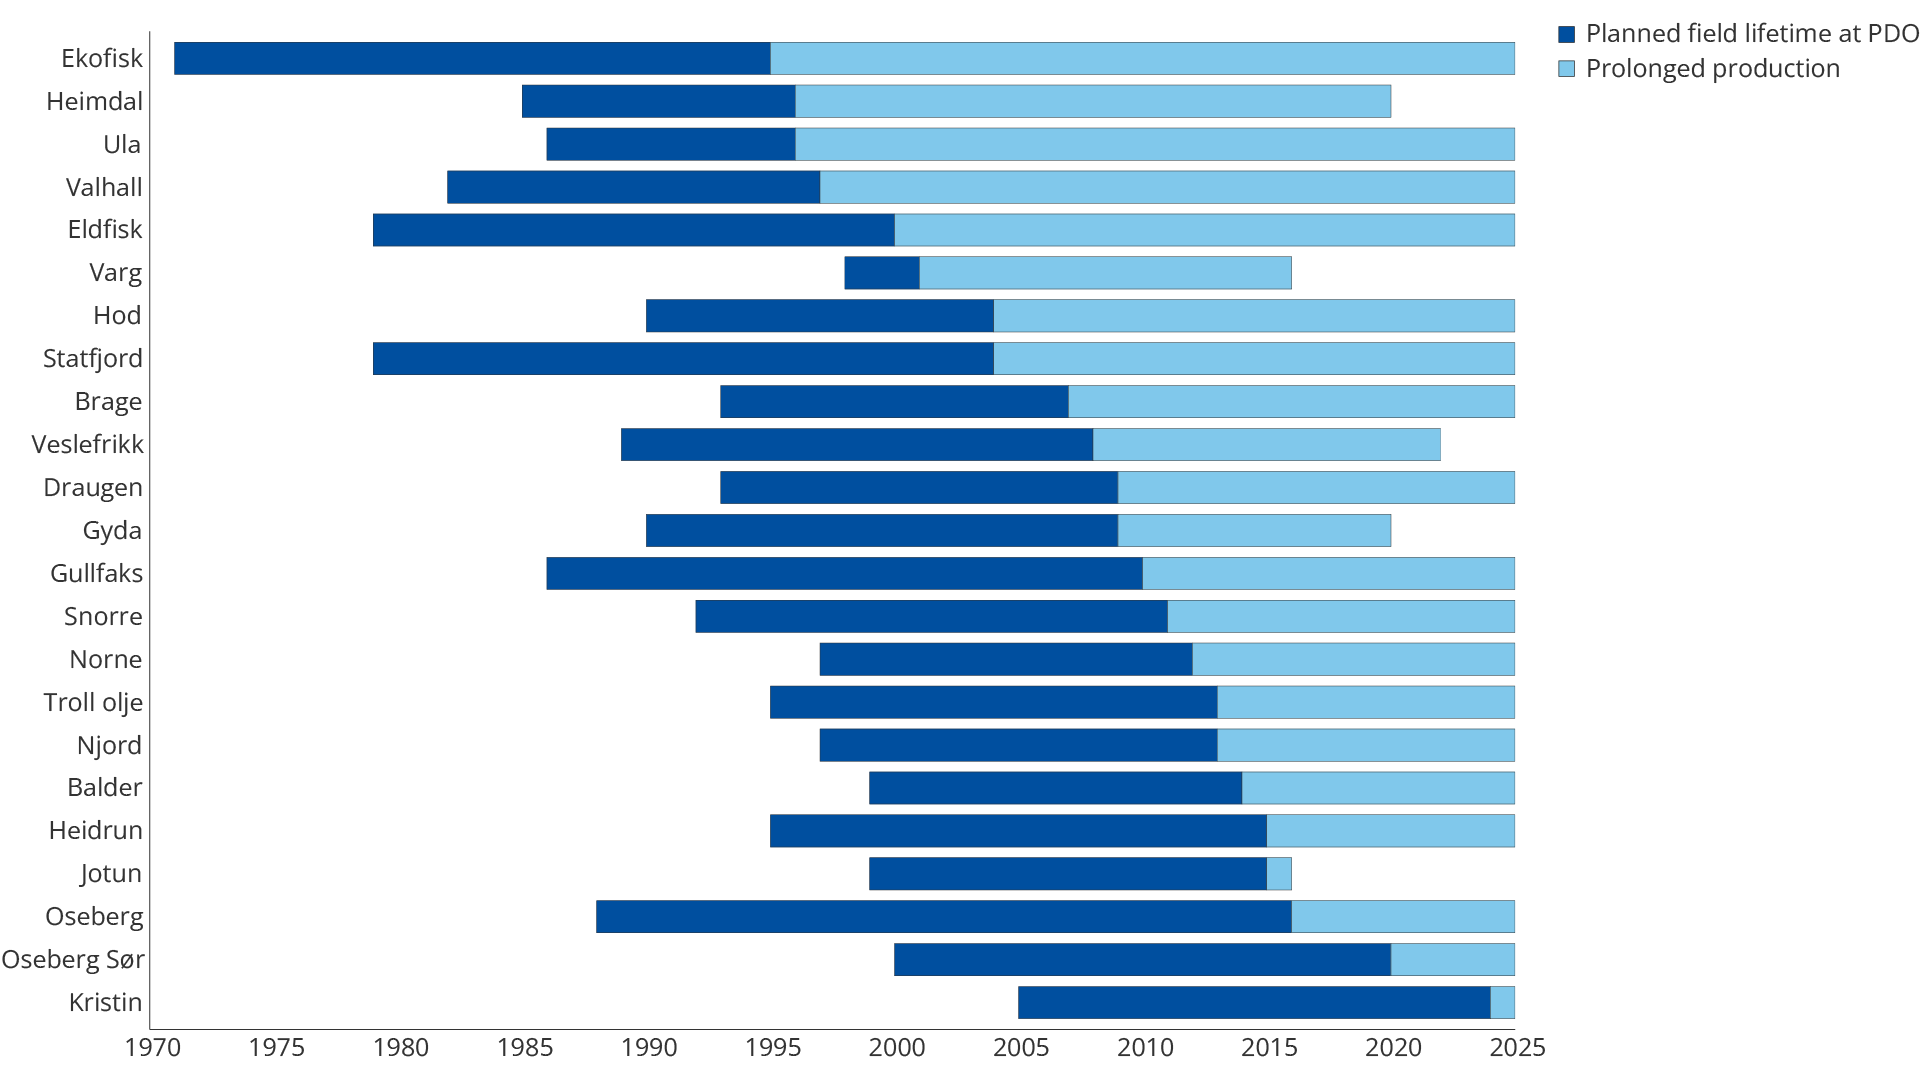
Figure 1.7 Extended production for selected fields in relation to previous plans, sorted by planned production cessation under the Plan for Development and Operation (PDO). The forecast is not shown here.
Infrastructure, discoveries and fields – interdependence
The infrastructure on the NCS, such as pipelines, processing platforms, hubs and receiving terminals, is crucial for production and value creation. A large part of this was established in the 1980s and ‘90s and is dimensioned for higher production than many fields currently deliver. Lower throughput results in higher unit costs, reduces profitability and increases the likelihood of earlier shutdowns.
The close link between fields and infrastructure means that shutdown decisions must be considered in context. The closure of one processing facility could cause neighbouring fields and early-stage discoveries to lose their sole connection, potentially triggering domino effects and accelerating production decline in entire areas. Since most new discoveries are small and dependent on existing capacity, the time window for realising their potential is limited.
Strengthening diversity with companies that are willing and able
In the 2000s, there were many international companies on the NCS. The shelf is now dominated by a few large, Norwegian-based operating companies (Figure 1.8). This can provide advantages in the development and operational phase but can be challenging in the exploration phase.
Fewer players may result in less diversity in geological assessments and thus reduce the likelihood of proving new, large discoveries, particularly in underexplored areas.
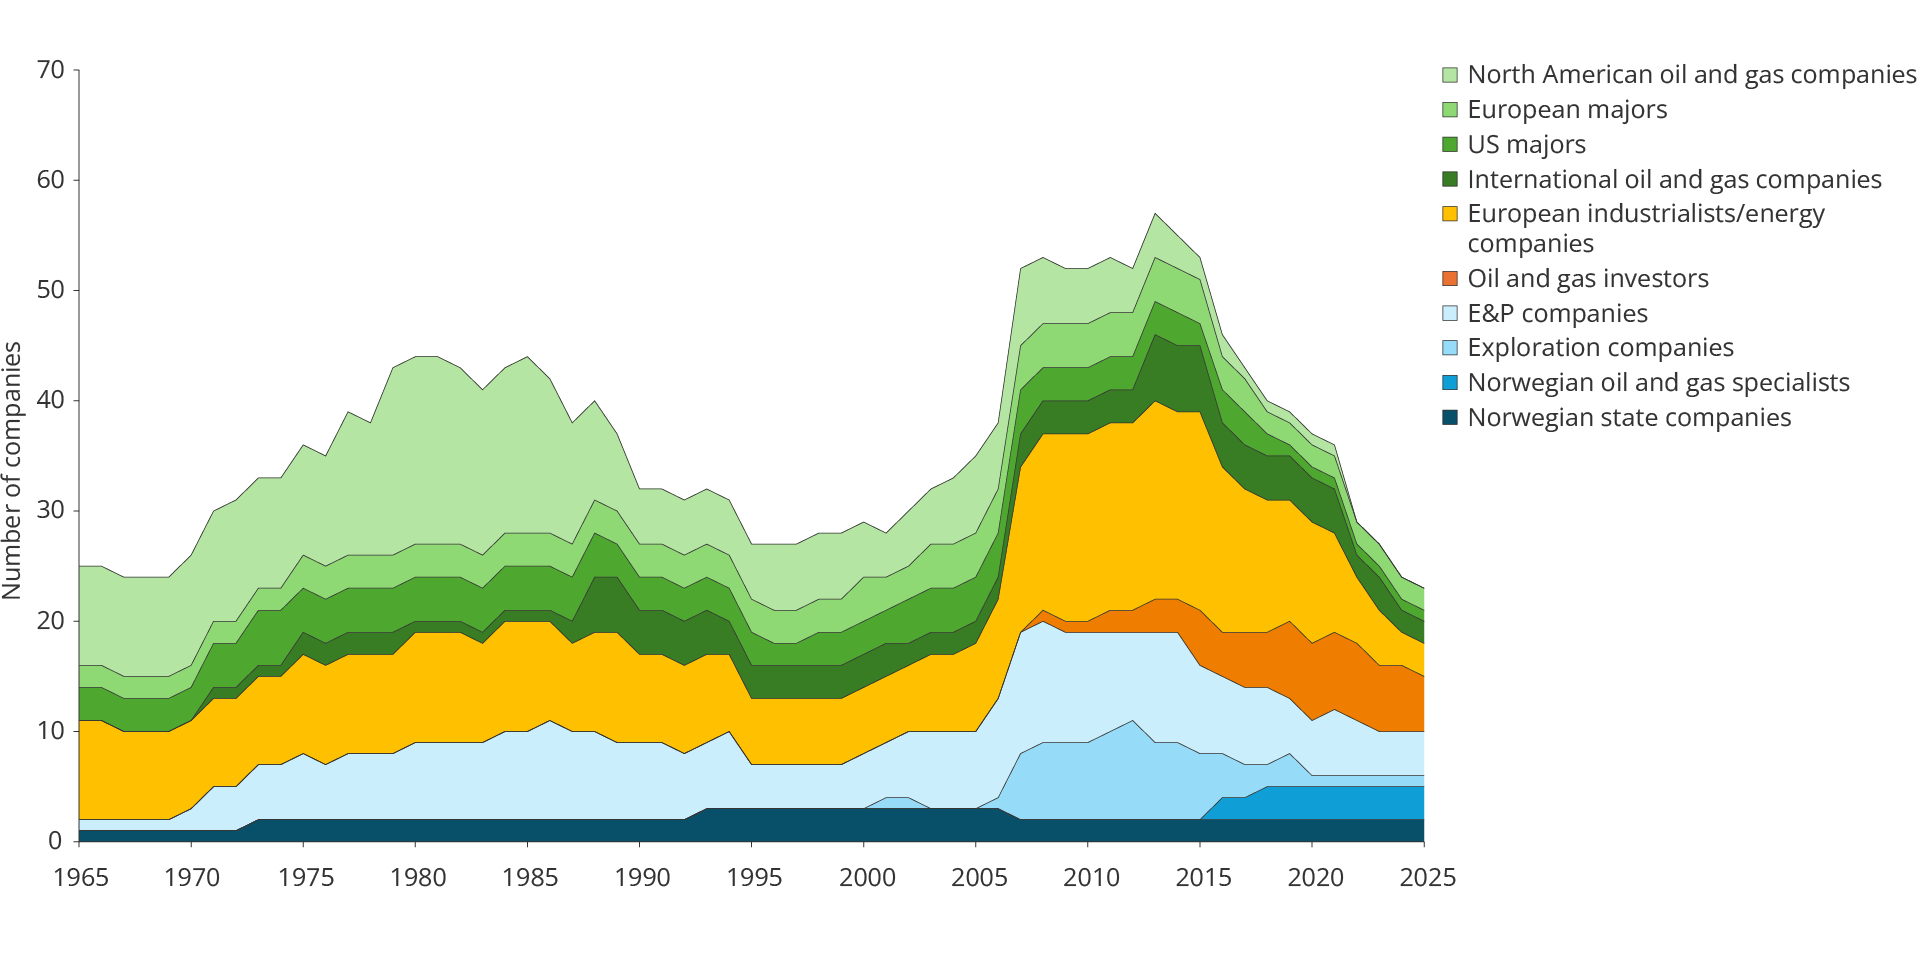
Figure 1.8 Development in the number of oil and gas companies on the NCS (1965–2025)
The High North
The High North has the largest remaining resource potential on the NCS (Figure 1.9). Large areas of the Barents Sea remain underexplored, and significant areas have not been opened for petroleum activities.
The gas resources in the Barents Sea represent the most significant potential for Norwegian gas deliveries in the long term. Realisation of the potential requires the development of infrastructure, particularly related to increased gas export capacity.
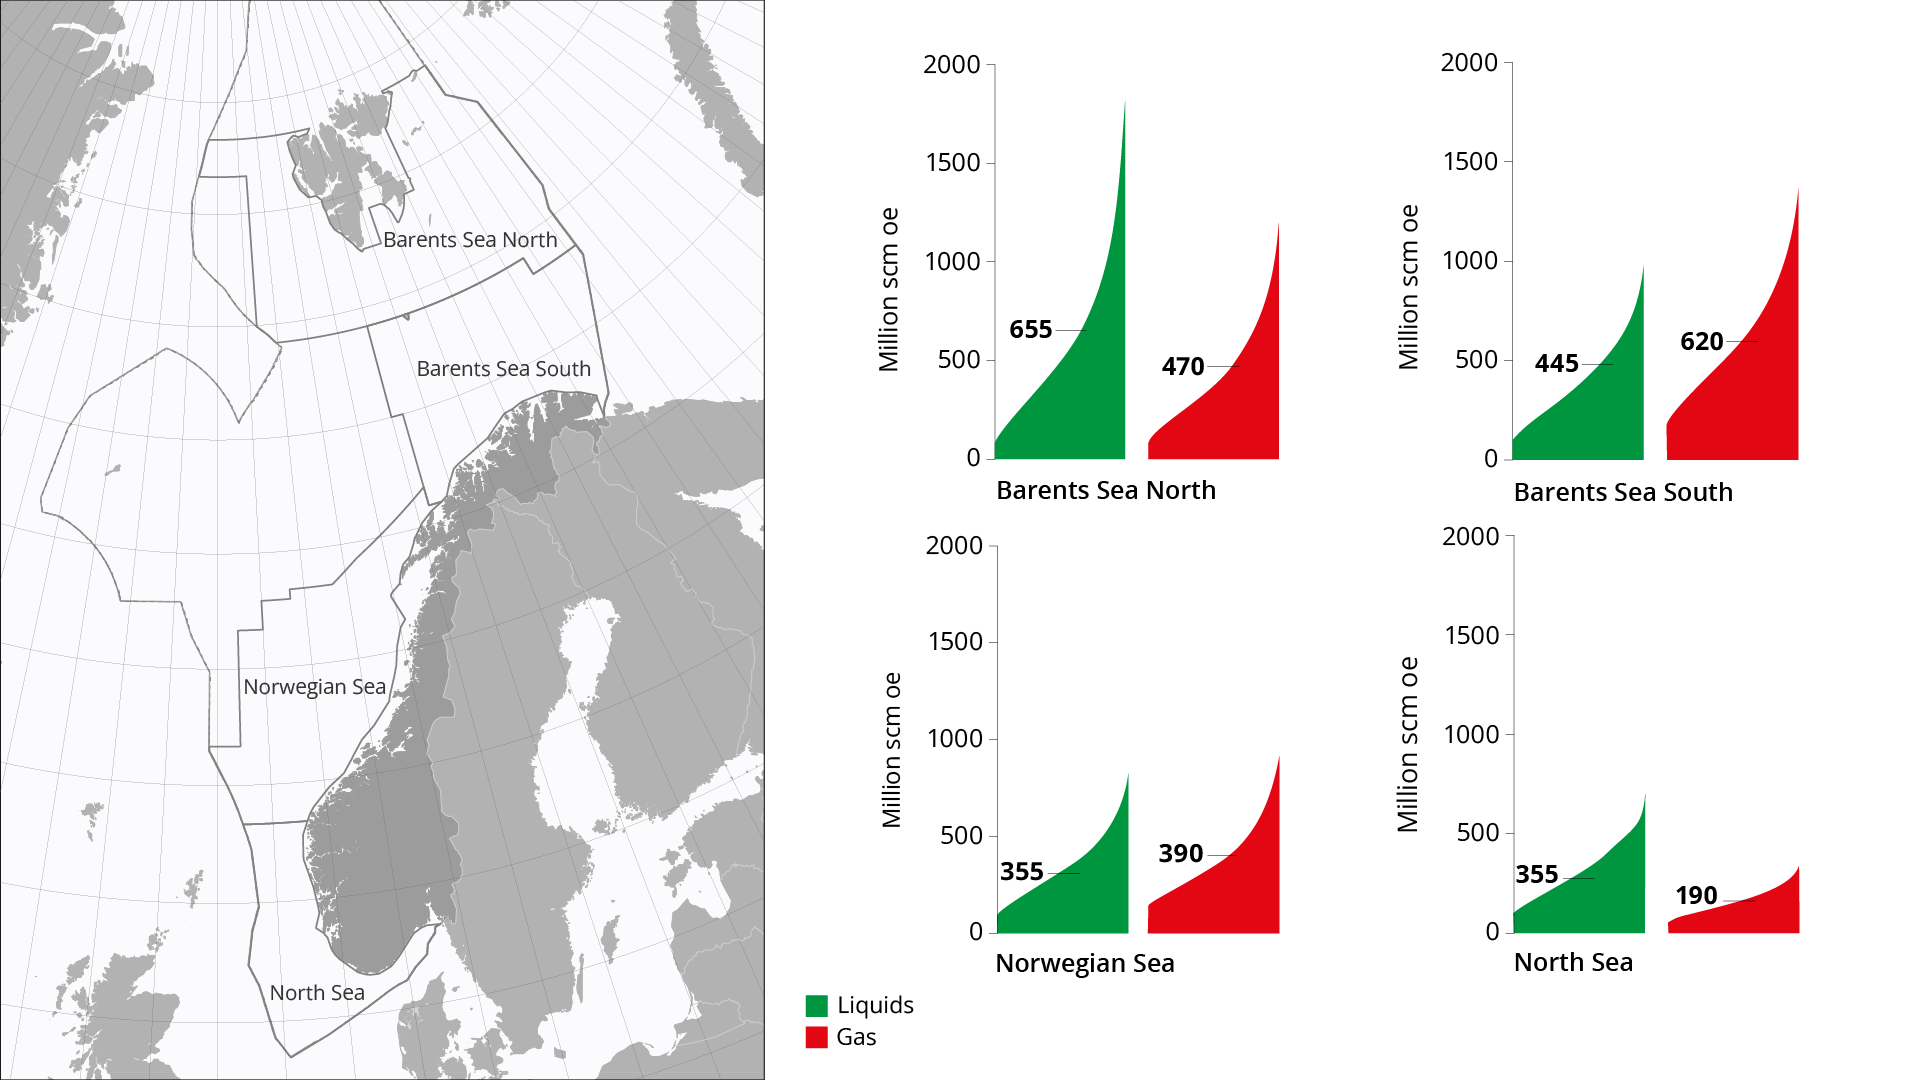
Figure 1.9 Distribution of undiscovered liquids and gas in the various sea areas with uncertainty ranges (4)
Three scenarios
The future of the NCS up to 2050 will depend on international drivers, Norwegian policies and developments on the shelf. This provides a wide scope for outcome and action, as illustrated by the Norwegian Offshore Directorate's three scenarios (Figure 1.10).
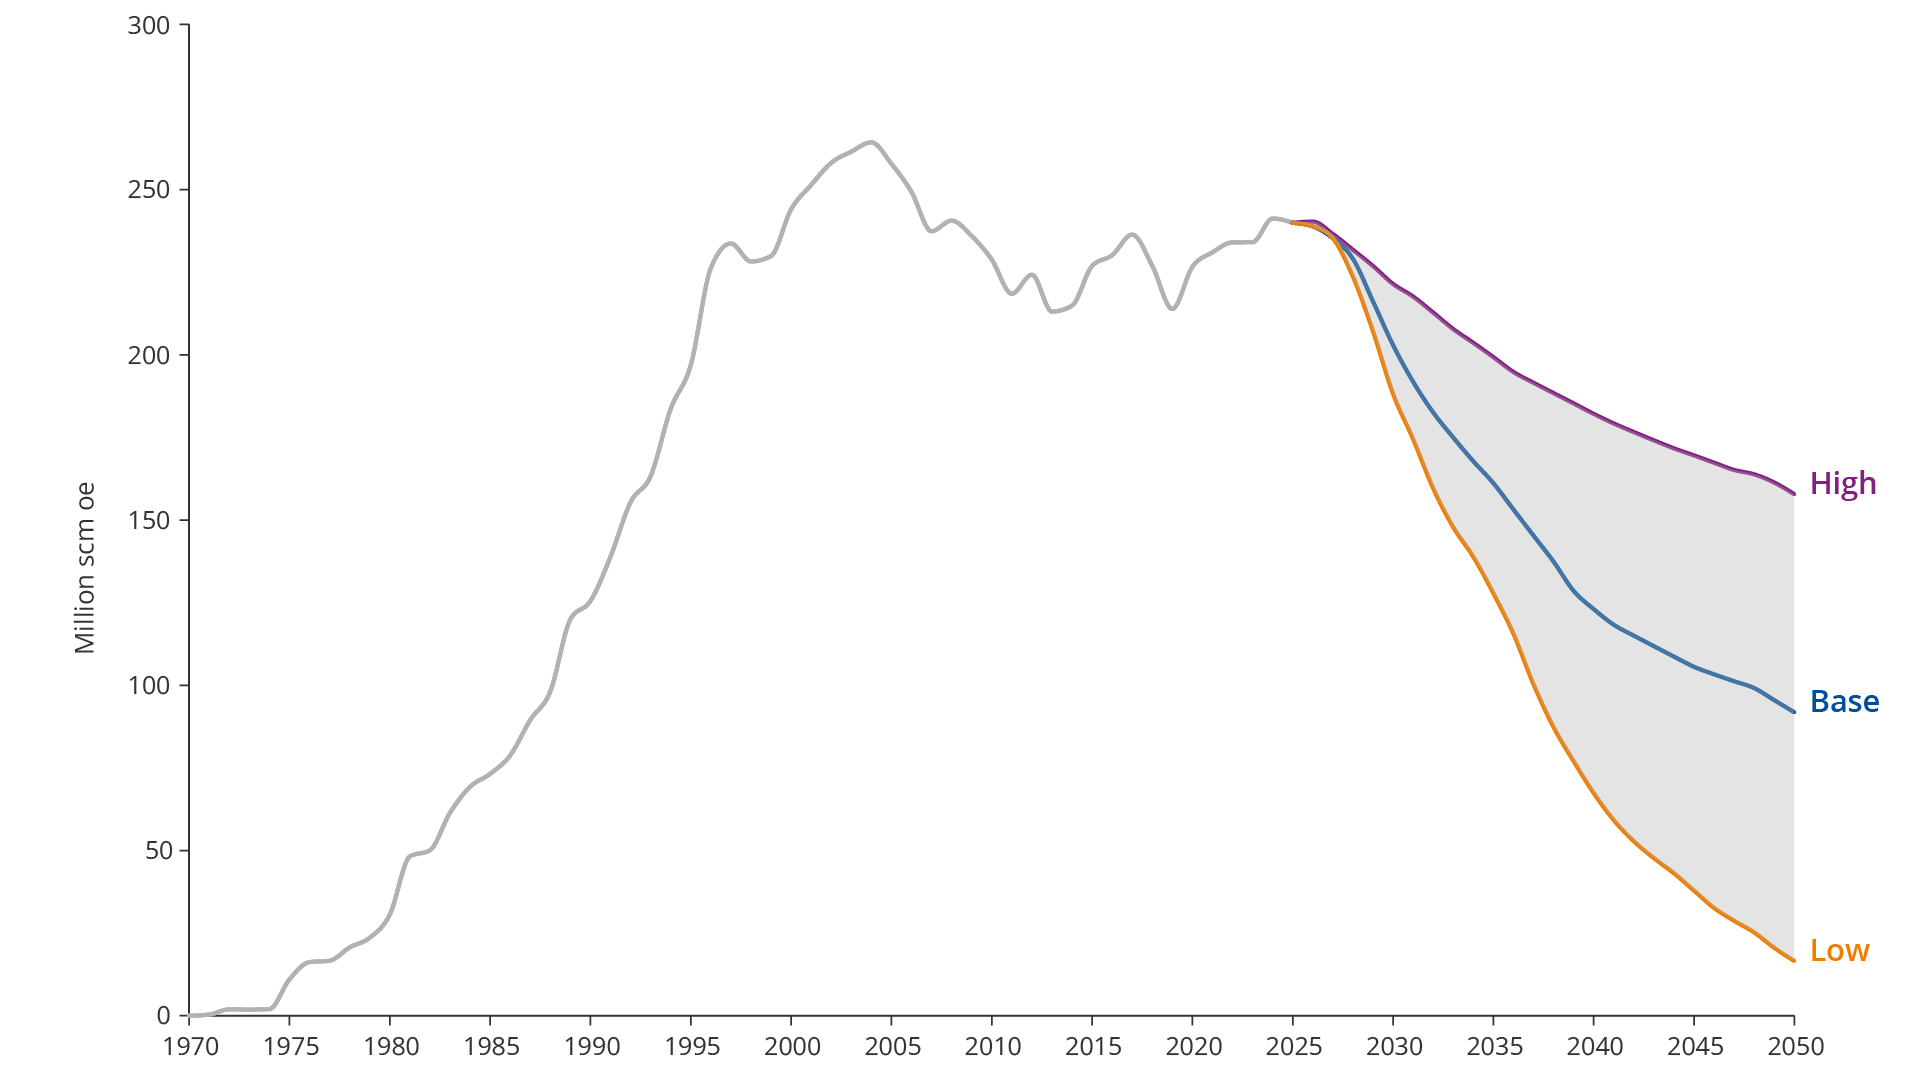
Figure 1.10 Three scenarios for petroleum production on the NCS up to 2050
All scenarios show a decline in production over time, but the pace and scope depend on exploration activity, technology development and willingness to invest.
The resource estimate on which they are based does not represent an upper limit for the potential on the NCS. A higher resource base than expected, permanently higher prices, technological breakthroughs or the opening of new areas can each increase the probability of higher production than that depicted by the scenarios.
Competence and technology development
Realisation of the value potential and slowing down the decline in production require expertise in the petroleum disciplines to be maintained and further developed. Seismic surveys, drilling of wells, subsea developments and improved recovery projects are examples of activities that contribute to maintaining and further developing this expertise.
At the same time, petroleum activities have positive ripple effects in other parts of the economy through a knowledge-intensive, high-tech supplier industry. The expertise and technology are also transferable to offshore wind, CO₂ storage and other industries, and thus have significance beyond petroleum activities.
Three scenarios up to 2050
Scenarios for production development
The Norwegian Offshore Directorate has developed three scenarios for production on the NCS up to 2050. Together, they depict a broad spectrum of potential production outcomes. All three point towards a decline in production over time, but the pace and extent of the decline vary.
The scenarios show neither an upper nor a lower limit for future production. A higher resource base than expected, sustained high prices, technological breakthroughs or the opening of new areas can increase the likelihood of higher production than that illustrated. Similarly, persistently low prices and low willingness to invest may reinforce the trend towards less exploration, lower resource growth and lower production.
Scenarios – Methodological Framework
Scenarios are neither forecasts nor recommendations. The Norwegian Offshore Directorate’s scenarios describe plausible and consistent future pathways for the NCS. Each pathway shows how different combinations of willingness to invest, exploration activity and technological development may influence the decline in production.
The scenarios have been developed by combining the most important and uncertain drivers of production development on the shelf to create plausible and consistent future pathways. For each scenario, production profiles have been established for fields, discoveries, improved recovery and contributions from exploration.
The production profiles are based on the companies' reported data to the Revised National Budget (RNB) and the Norwegian Offshore Directorate's expected estimate for undiscovered resources in areas opened for petroleum activities. In the High scenario, technological development means that volumes not currently included in the Directorate's resource accounts become technically and commercially recoverable.
Modelling of new discoveries
The production profile for new discoveries from undiscovered resources is based on assumptions about exploration activity, discovery success and lead time. For each discovery, a development solution and associated cost and production profile are assigned.
The development solutions are based on typical concepts, either as stand-alone developments or satellite developments. The production and cost profiles consider resource size, reservoir depth and distance to infrastructure. The cost level is based on historical experience and assessments of future development.
Only projects with a positive net present value (NPV) are included in the production profile. As production declines towards 2050, increased consolidation of infrastructure is assumed to keep unit costs down.
Market development and price assumptions
All scenarios are based on the assumption that only profitable resources are produced, using technical calculation prices for oil and gas prepared by the Ministry of Energy.
The development in production in the three scenarios is outlined in Figure 2.1.
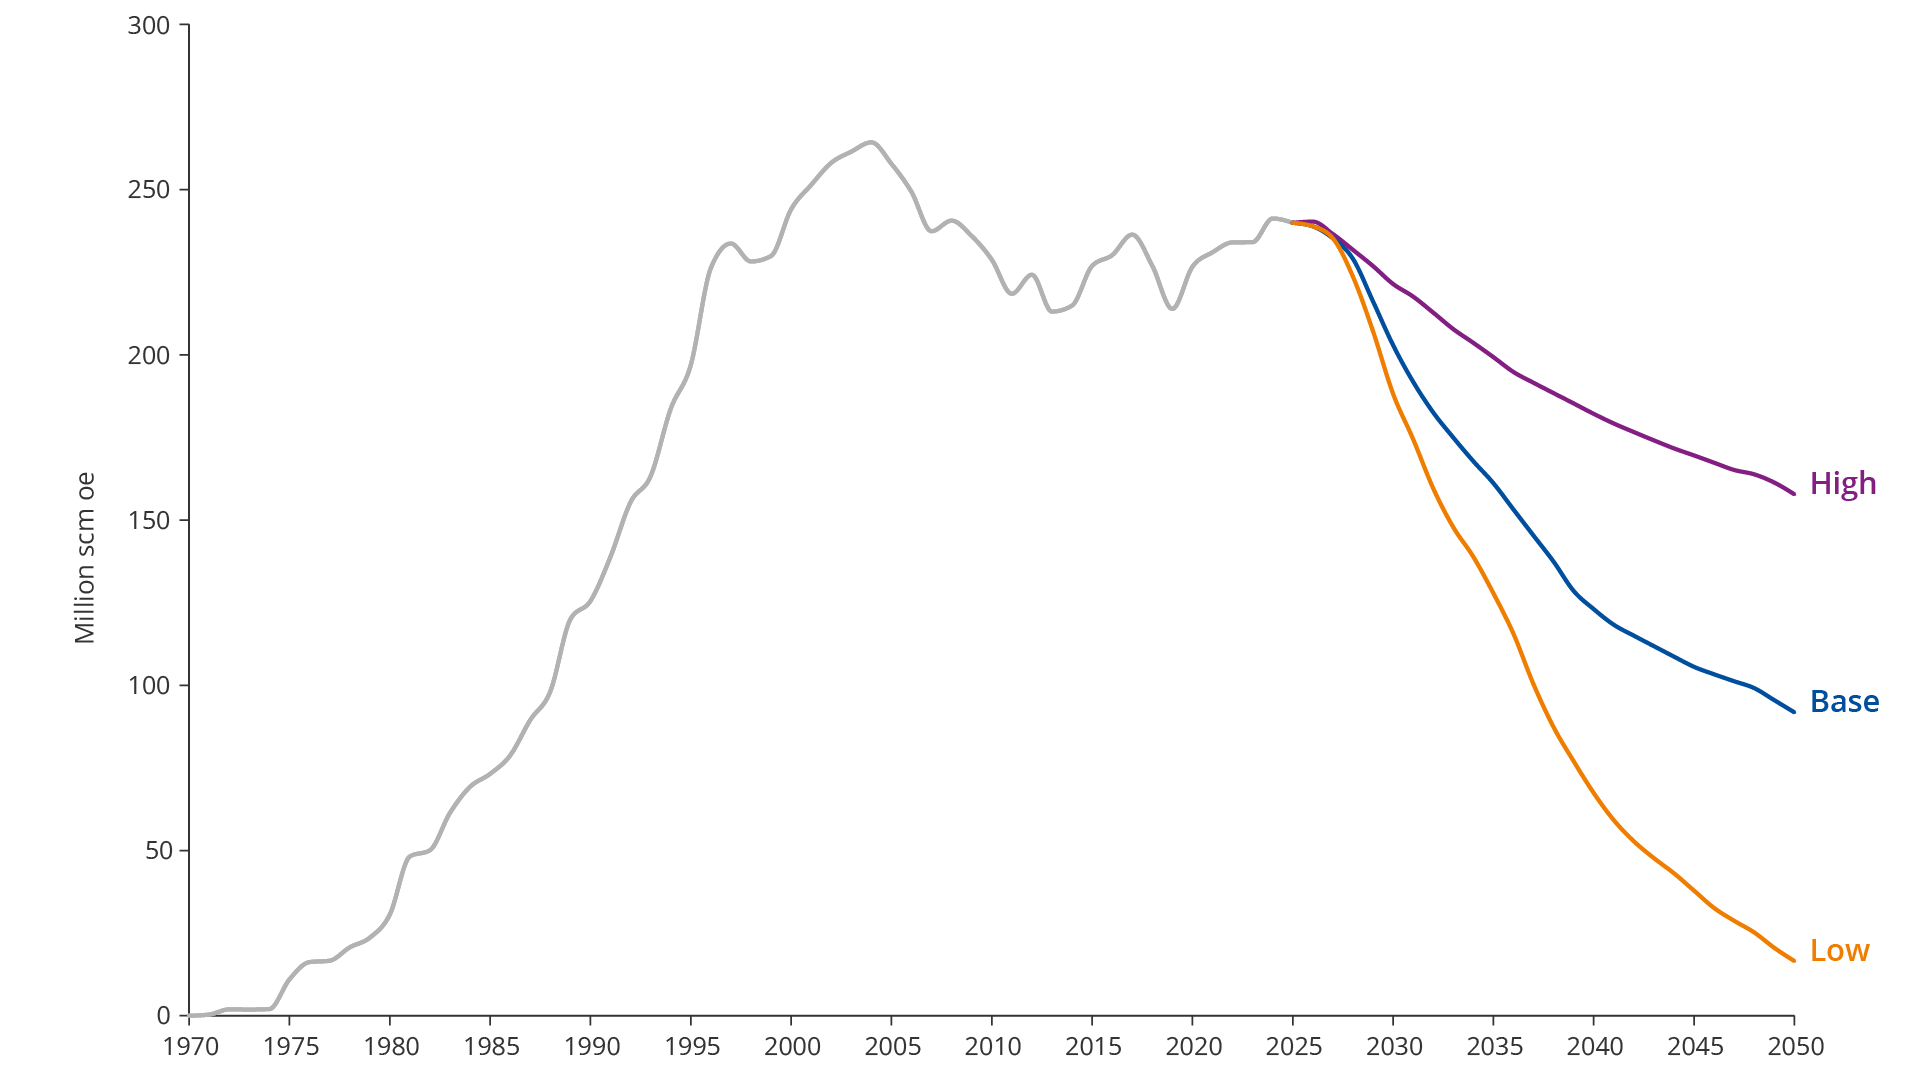
Figure 2.1 Three scenarios for production development on the NCS up to 2050.
The scenarios Base and Low largely correspond to the presentations in the Resource Report 2024. The High scenario, on the other hand, has a somewhat different profile in this report. Large discoveries in the Norwegian Sea and the Barents Sea are made later, while several medium-sized discoveries are made early in the period.
Low scenario
The Low scenario (Figure 2.2) is characterised by low willingness to invest, limited exploration activity and weak technology development. Overall, this leads to a rapid decline in production up to 2050.
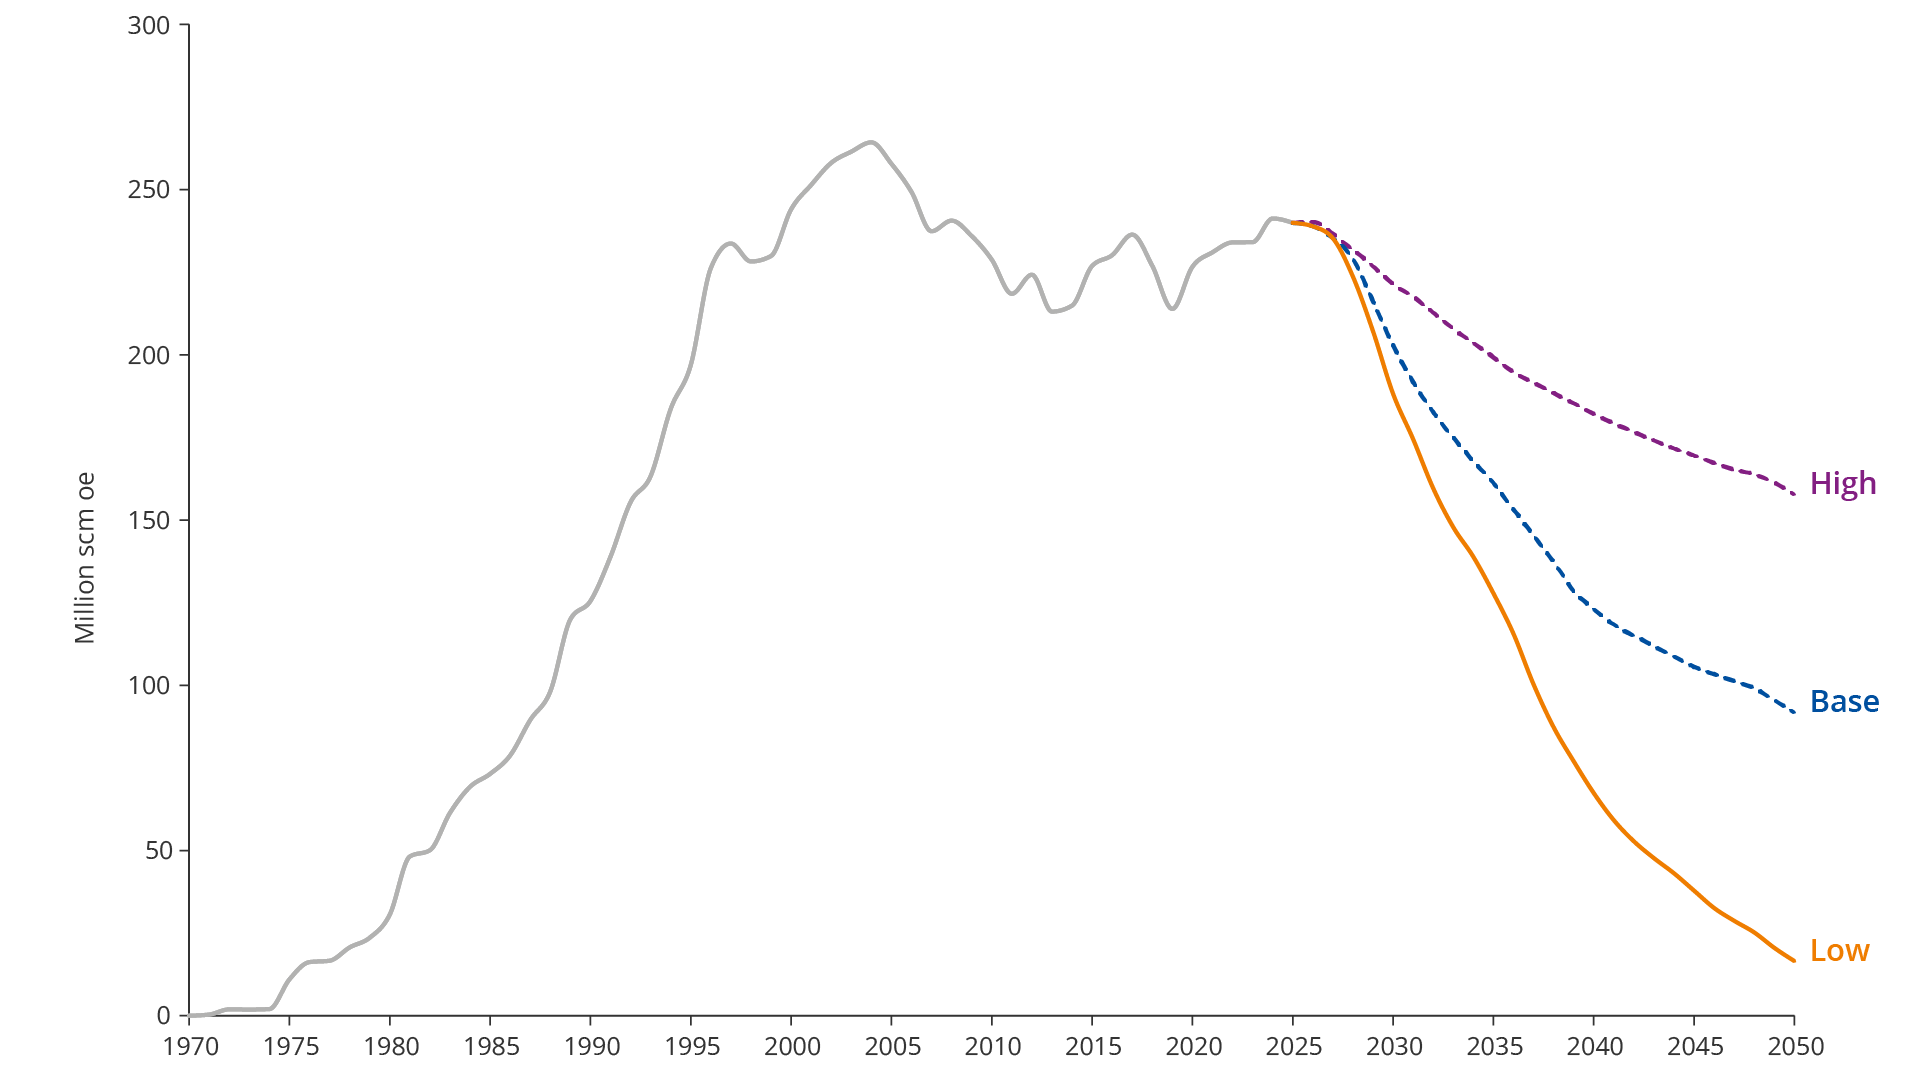
Figure 2.2 Low Scenario
Production falls from approximately 240 million scm oe in 2025 to approximately 15 million scm oe in 2050. This is reflected in a rapid and extensive decommissioning of petroleum activities on the NCS.
Exploration activity remains close to current levels for the first few years, declining rapidly thereafter. Most of the wells are dry, and few discoveries are commercial. Increased export capacity for gas from the Barents Sea is not established, and exploration in the area yields few profitable discoveries. Activity is concentrated in the North Sea and the Norwegian Sea, where discoveries are generally small.
Few new discoveries are developed, and those that are realised are too small to maintain high capacity utilisation in host fields, pipelines and processing plants. Few projects are initiated to improve recovery. Unit costs rise rapidly, profitability weakens and many fields are shut down early. This triggers a domino effect in the infrastructure, thus amplifying the drop in production.
Base scenario
The Base scenario (Figure 2.3) is characterised by a strong willingness to invest, relatively high exploration activity and moderate investments in technology. Overall, this contributes to curbing the decline in production up to 2050.
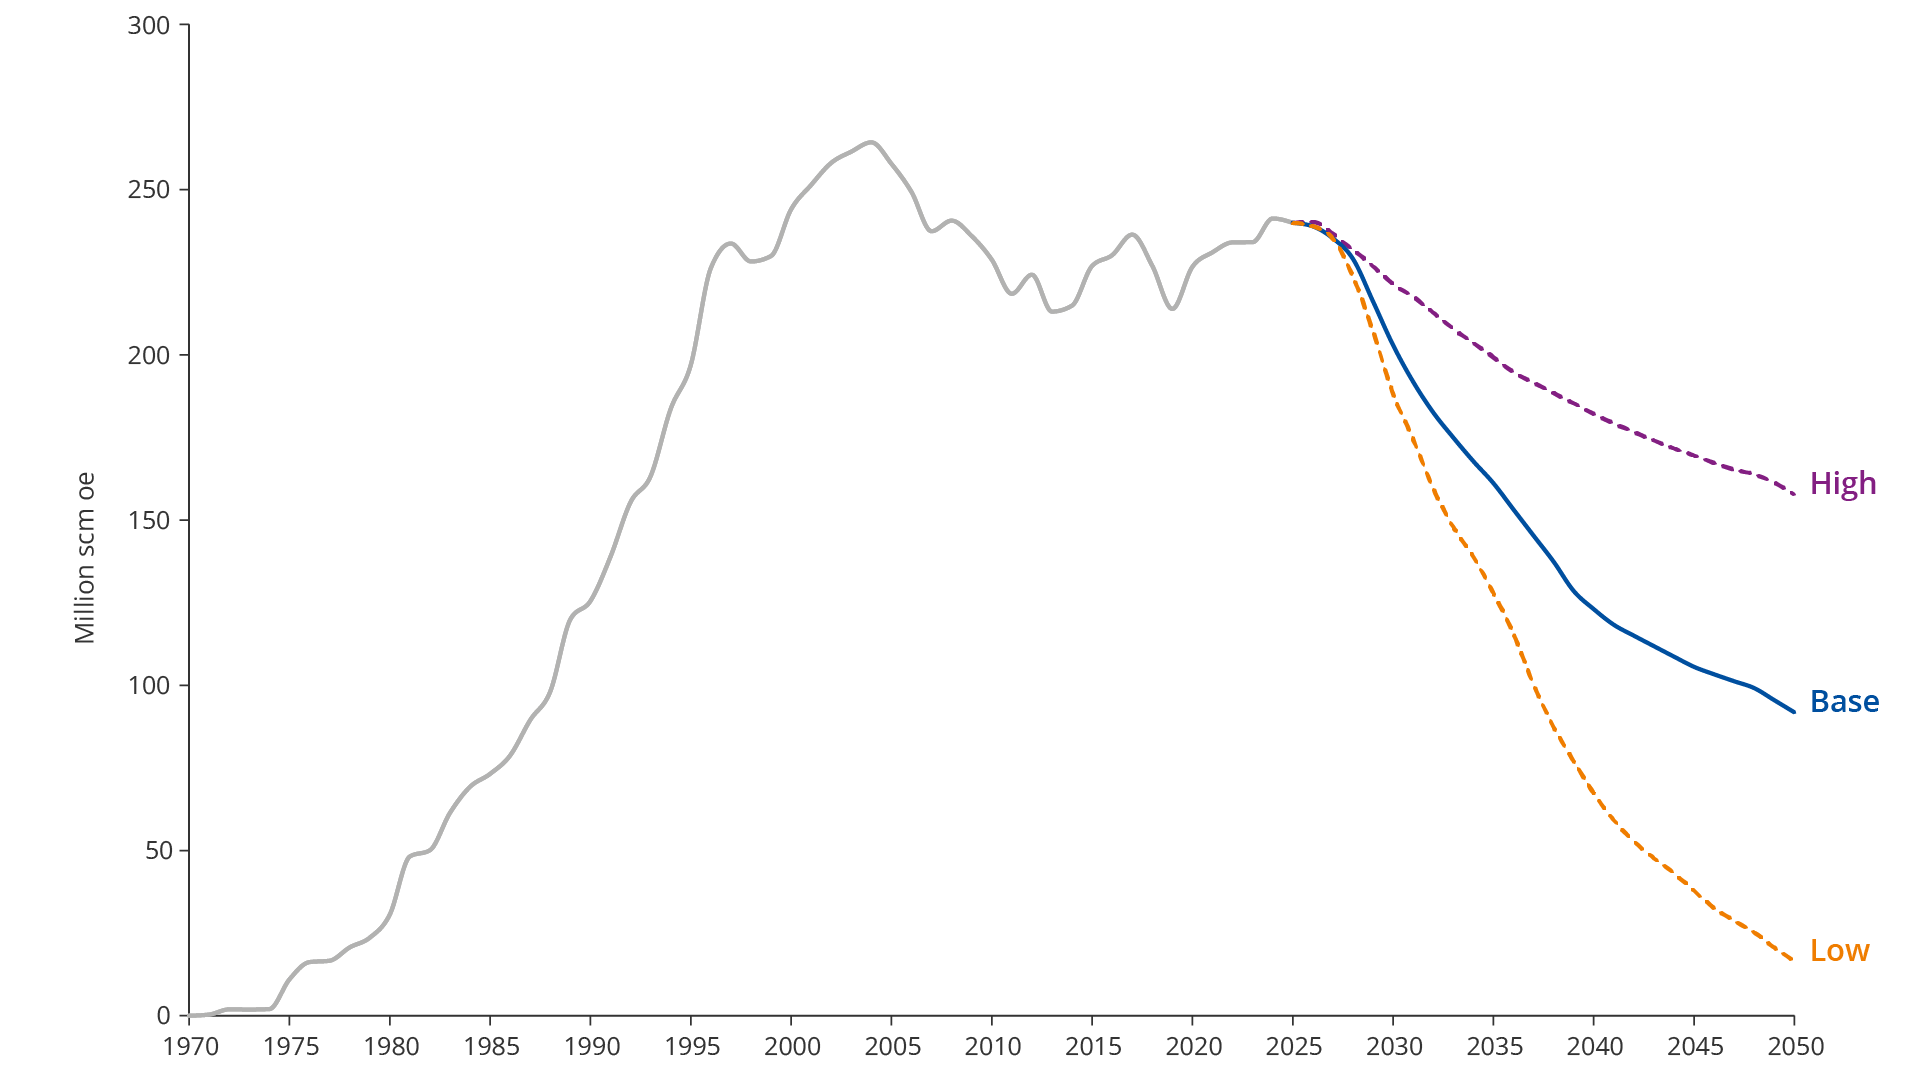
Figure 2.3 Base scenario
Production is reduced gradually from approximately 240 million scm oe in 2025 to approximately 90 million scm oe in 2050. The resource growth from exploration activities is not sufficient to compensate for the decline in production from the large fields.
Exploration activity remains approximately at current levels for the first few years but gradually declines further during the period. Activity is highest in the North Sea and the Norwegian Sea, where access to infrastructure with spare capacity secures a short lead time from discovery to production.
Developed discoveries help to maintain capacity utilisation and keep unit costs down. Increased gas export capacity is established in the Barents Sea. In the medium and long term, the proportion of exploration wells in this area increases.
The companies invest in improved recovery, extending the lifetime of existing fields. Most new discoveries are profitable and developed as satellites to existing infrastructure.
Technology development is sufficient to support further operation and development, but not to counteract the structural decline in production.
High scenario
The High scenario (Figure 2.4) is characterised by high exploration activity, many discoveries and strong resource growth, including from tight reservoirs. Rapid technological development and implementation, combined with companies willing to invest, help to keep production at a high level over time, even if it declines gradually towards 2050.
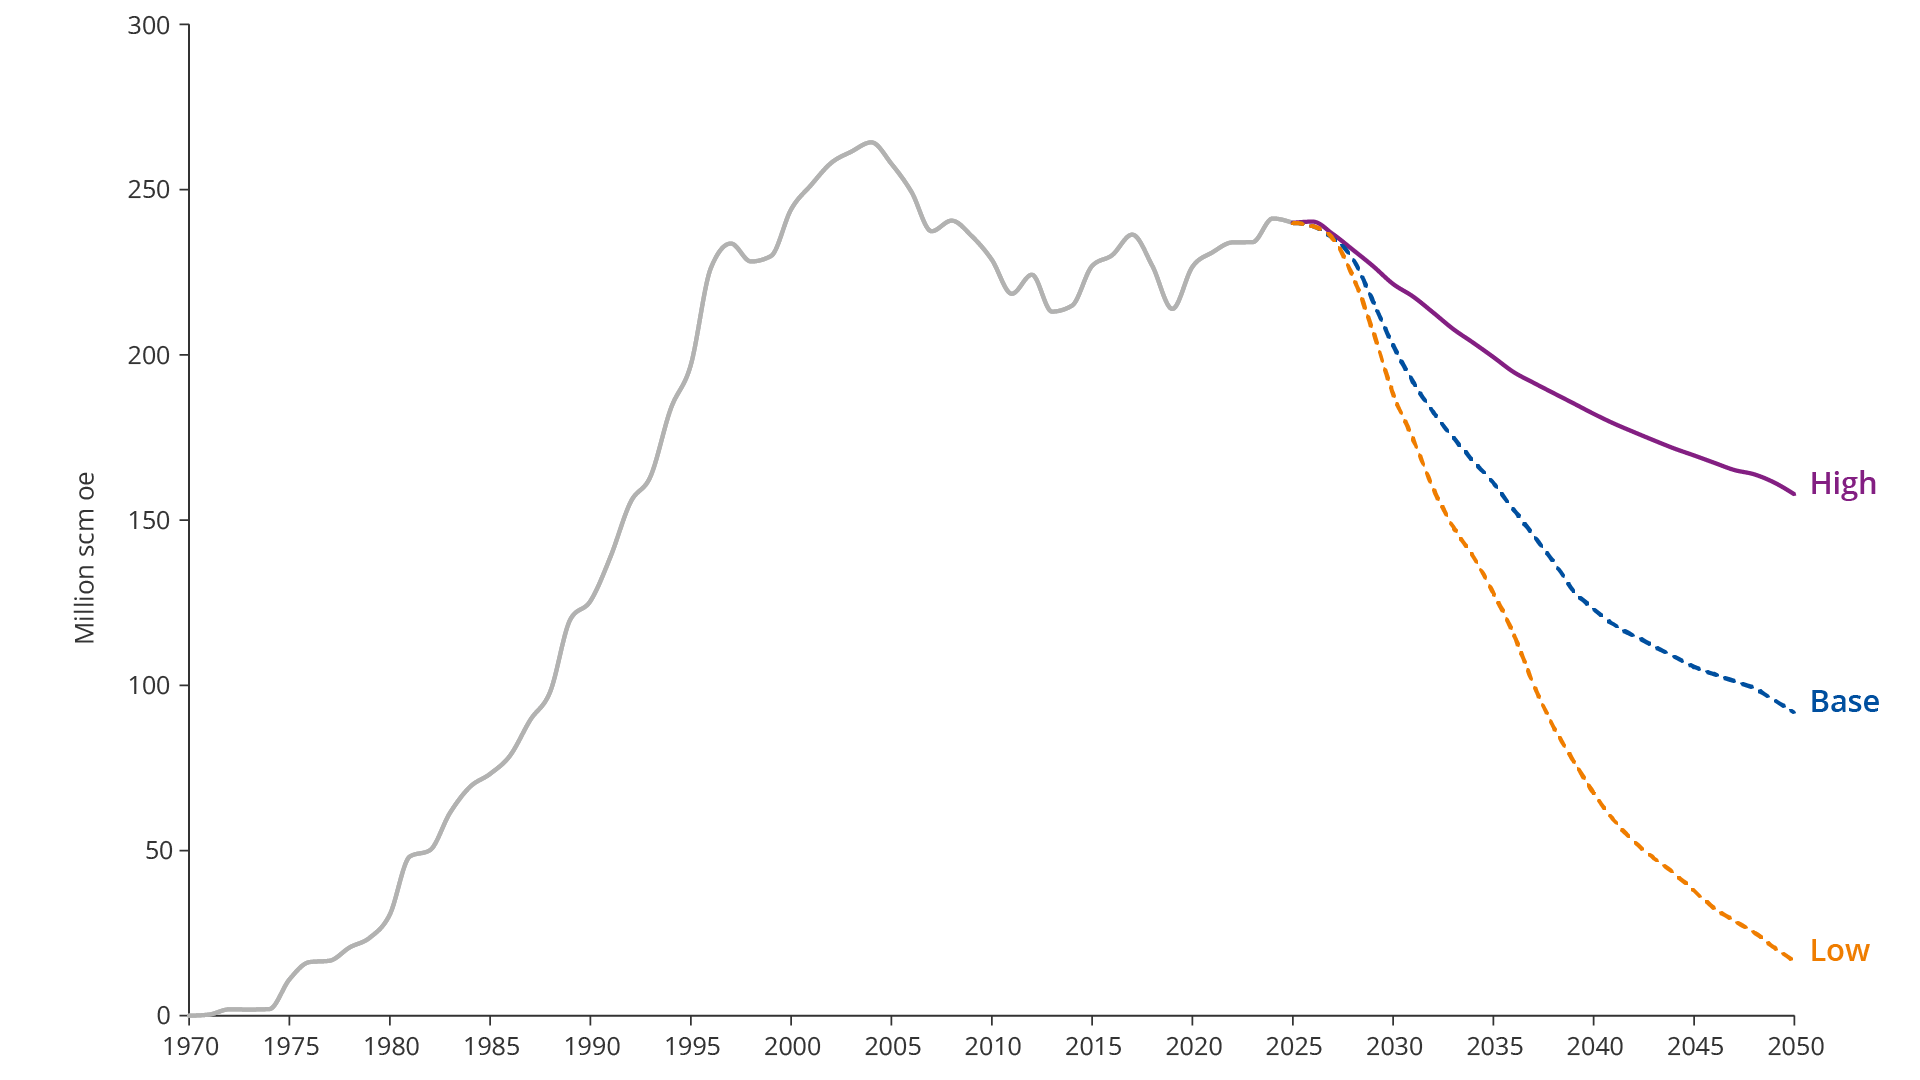
Figure 2.4 High scenario
Production is reduced from approximately 240 million scm oe in 2025 to approximately 160 million scm oe in 2050, corresponding to 66 per cent of current levels.
Exploration activity is high throughout the period. In the first part, exploration is concentrated in areas near infrastructure in the North Sea and the Norwegian Sea, where spare processing capacity secures a short lead time from discovery to production. Advanced seismic data and artificial intelligence increase exploration accuracy, reduce the proportion of dry wells and contribute to falling costs per discovery. Even relatively small discoveries are profitable and are developed as satellites to existing fields.
In the Norwegian Sea and the Barents Sea, several medium-sized discoveries are made and developed in a coordinated manner as stand-alone projects, helping to sustain production through the 2030s. Early establishment of new and significant gas export capacity from the Barents Sea increases the attractiveness of exploration in the area. This triggers increased exploration activity leading to several major discoveries, particularly gas discoveries, in less mature areas of the Barents Sea.
Rapid technological development makes new resources commercially recoverable. The combination of horizontal drilling and hydraulic fracturing, adapted to Norwegian conditions, enables gas production from tight reservoirs in the Norwegian Sea and the Barents Sea. Moreover, developments in drilling, subsea technology, longer tie-backs and subsea compression reduce costs and extend the lifetime of existing gas fields.
Advanced computing, digital twins and new injection technologies, such as CO2 and polymer injection, improve reservoir understanding and increase recovery rates in selected fields. On large fields, even moderate improvements can be equivalent to the resources in several new discoveries. Investments in technology will therefore be crucial to maintaining production at a high level over time.
Technology megatrends towards 2050
The Copenhagen Institute of Future Studies (5) has, on behalf of the Norwegian Offshore Directorate, mapped six technological megatrends and assessed how these may affect exploration and production on the Norwegian continental shelf up to 2050. The trends reinforce mutually and point collectively to what the report refers to as ambient intelligence: a technological platform where large segments of the business operate more independently.
Artificial intelligence (AI) and automation are the single trend with the greatest direct impact. In the exploration phase, AI significantly reduces time spent on and costs related to seismic interpretation. The technology also provides an improved basis for decision-making on drilling, as well as a higher discovery rate. In the production phase, AI facilitates more autonomous operating models, where digital systems monitor and optimize facilities in near real-time. However, assessments are sober: realistic gains at an operational level are estimated at 5–10 per cent lower maintenance costs. Artificial general intelligence (AGI) is considered a structural uncertainty that could change investment assumptions provided the technology matures in the period 2040–2050.
The Internet of Things (IoT) and digital twins provide the NCS with an increasingly dense sensor network. This enables both more efficient exploration through enhanced reservoir understanding, and more precise production management through predictive maintenance and remote control. Digital twins at the equipment level are relatively mature, while full-scale reservoir twins remain less developed. Integration with older infrastructure and varying data quality are key limitations.
Developments in network technology provide increased capacity and new functions: 5G has already been deployed offshore, while 6G is expected around 2030. With 6G, the centre of gravity is shifted from pure communication to sensing, where the network provides continuous data collection to digital twins. Satellite-based solutions provide better coverage for remote fields, including in the Barents Sea.
Cloud and edge computing is already operational on the NCS and supports both exploration and production processes. The report also highlights a geopolitical and security dimension. The Norwegian National Security Authority (NSM) believes that dependence on the American tech giants is a potential risk, partly due to US legislation on data access.
Quantum sensing and quantum computing have different time horizons. Quantum sensing for mapping the subsurface is approaching commercialisation and may reduce the proportion of dry wells, particularly in underexplored areas. Quantum computers for reservoir simulation are less mature and are not expected to surpass traditional high-performance computing until 2035–2040 at the earliest. Post-quantum cryptography is referred to as an imminent regulatory requirement.
In the area of sustainability technology, the Norwegian continental shelf's already low emissions are highlighted.
Revenue and value creation
The scenarios show a considerable difference in future revenues and value creation from the petroleum industry. The analysis is based on two price trajectories: one in which all three scenarios use a base price of USD 80 per barrel, and one in which the High scenario uses USD 100 per barrel and the Low scenario USD 60 per barrel.
At the base price, the difference in undiscounted net cash flow between the High and Low scenarios is approximately NOK 7,400 billion. With a high price in the High scenario and a low price in the Low scenario, the corresponding difference is NOK 15,200 billion, see Figure 2.5.
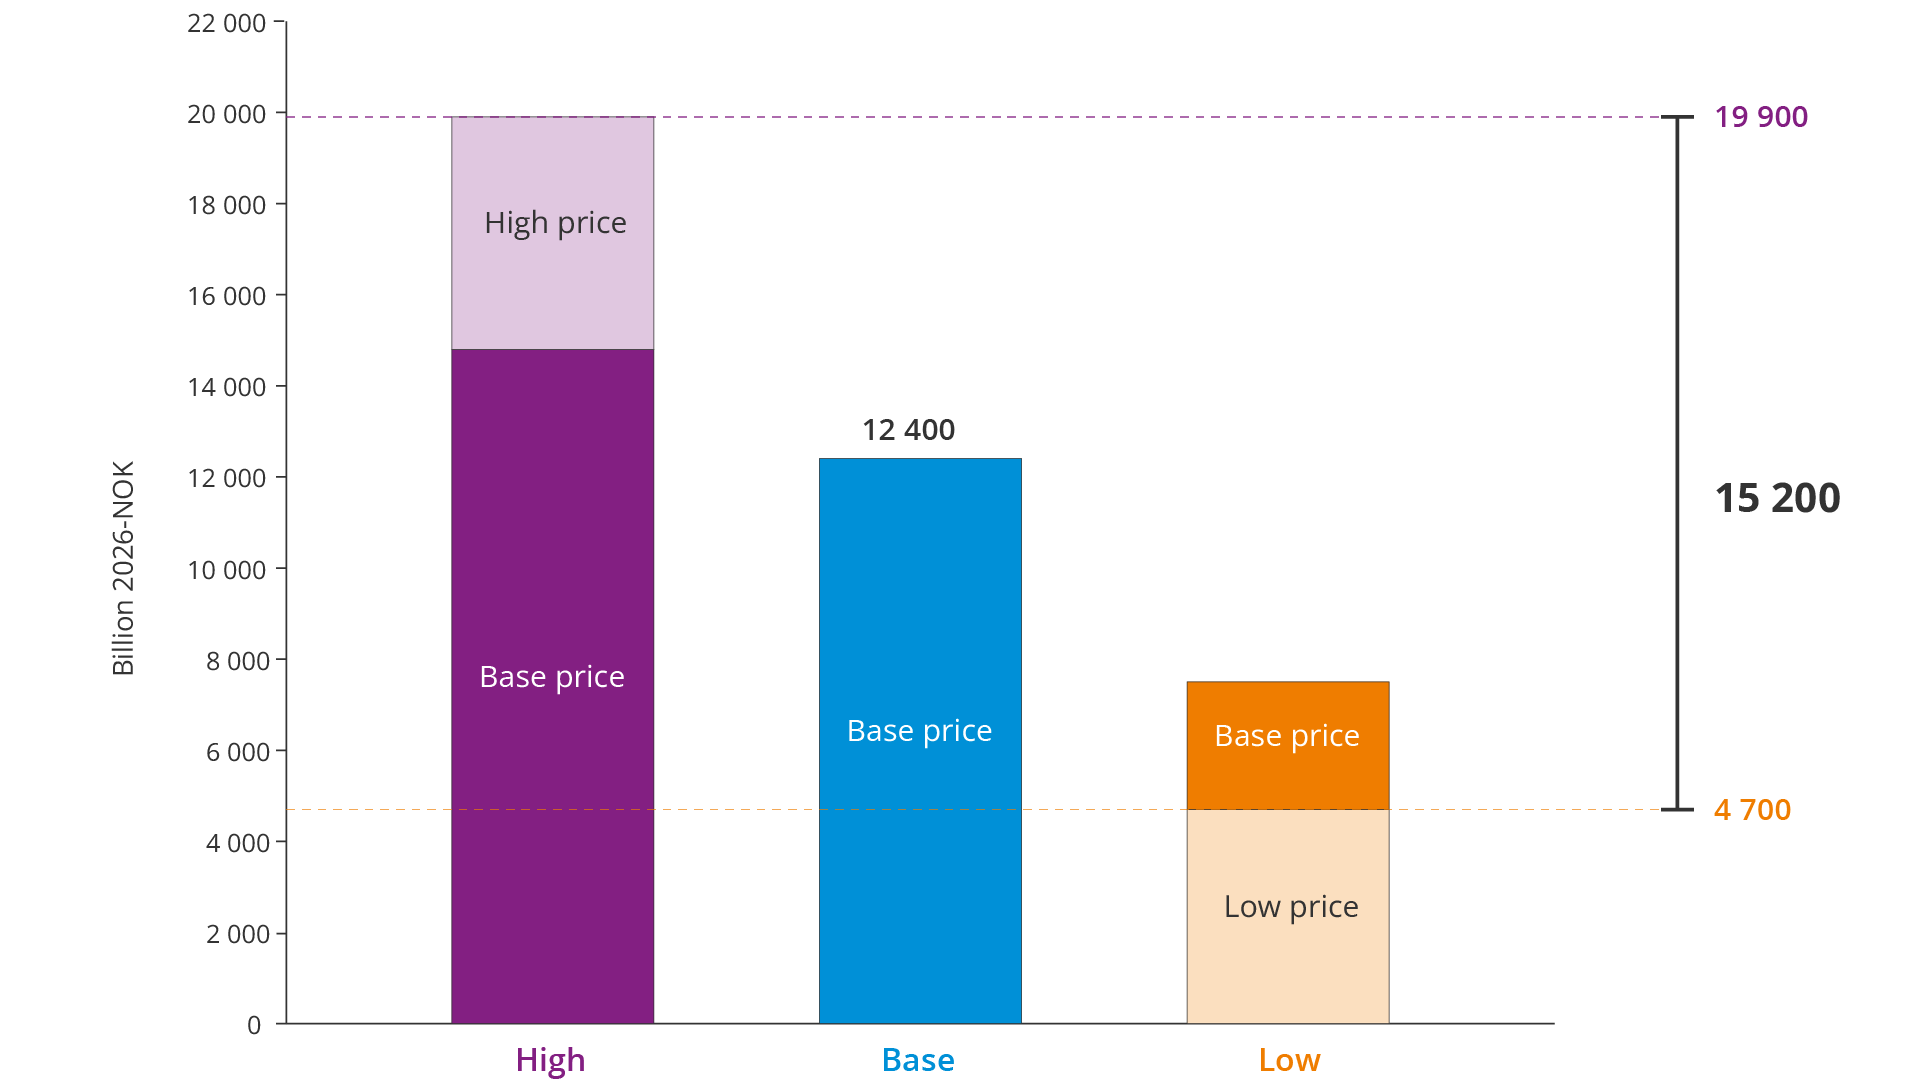
Figure 2.5 Technical estimates for net cash flow (undiscounted)
The net cash flow is discounted using a real discount rate of 4 percent (6), see Figure 2.6.
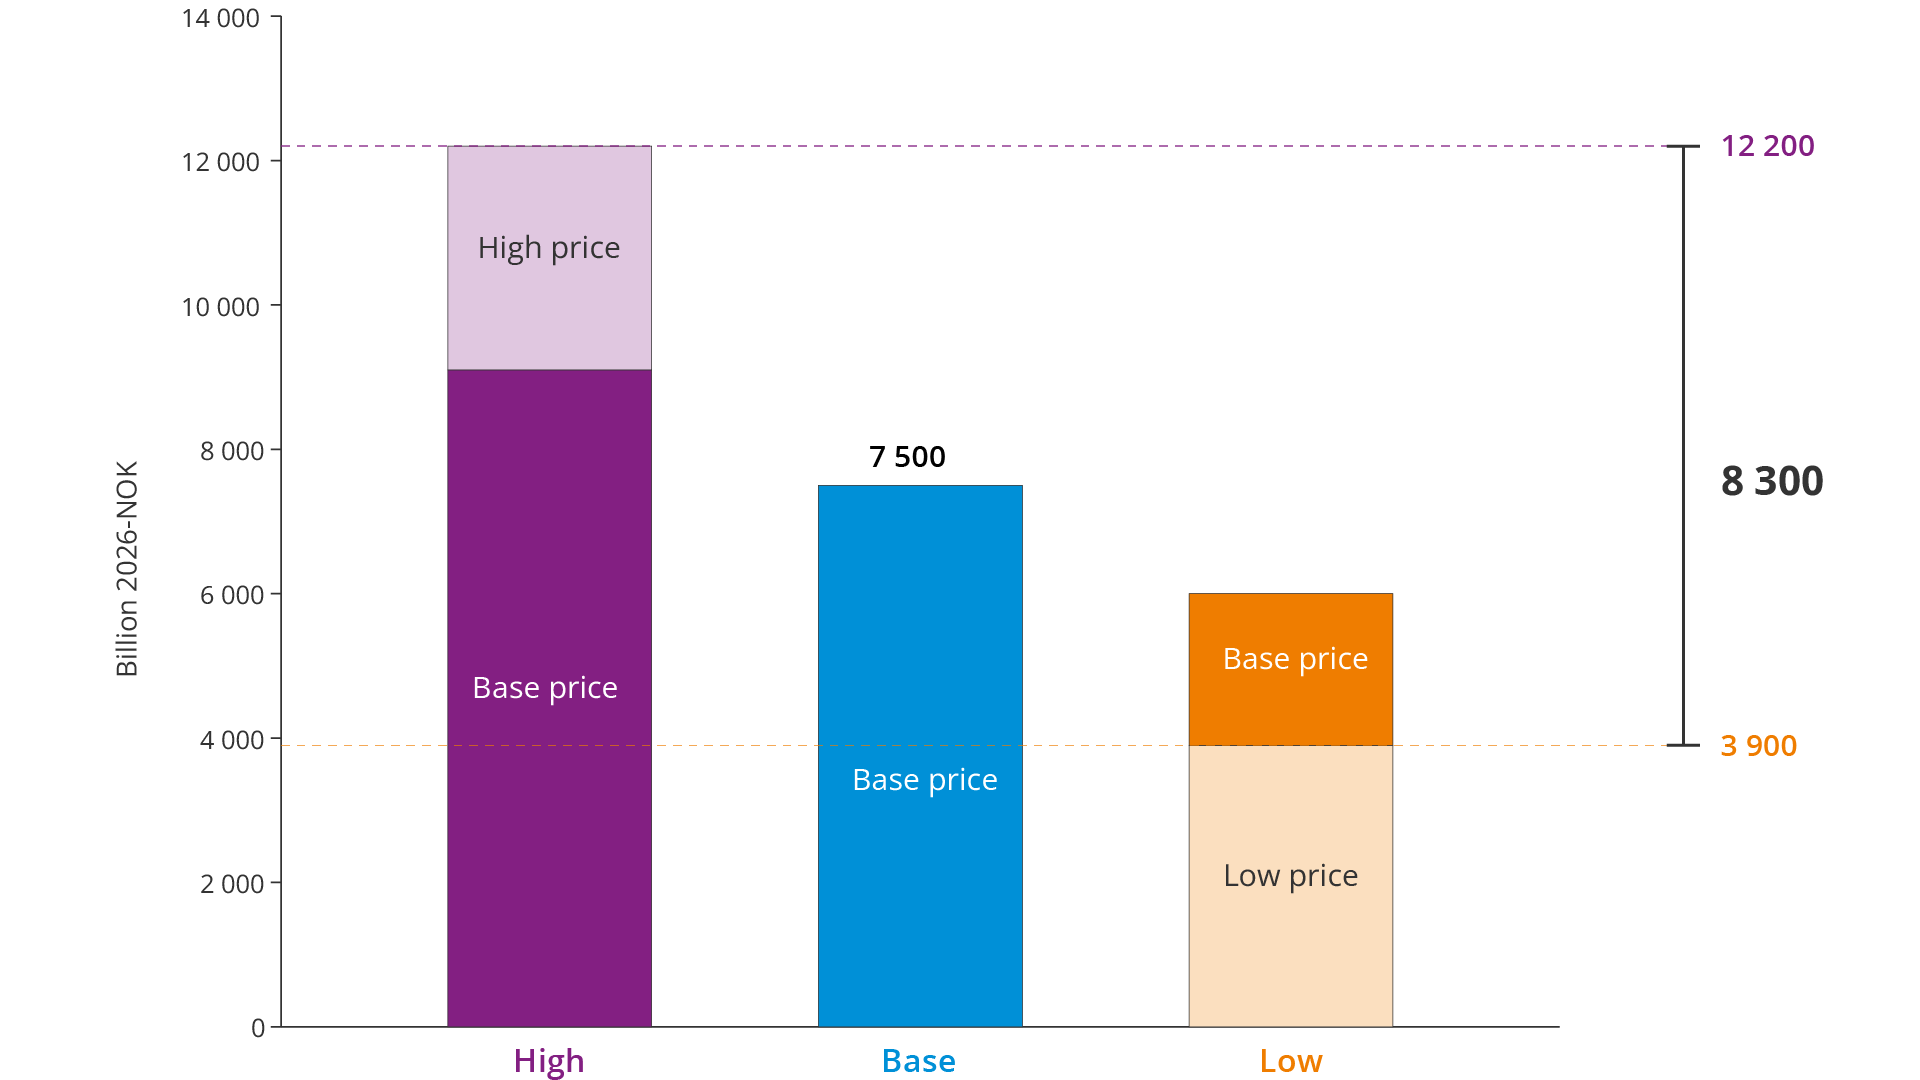
Figure 2.6 Technical estimates for net present value
At the base price, the difference in net present value between the High and Low scenarios is approximately NOK 3,200 billion. With a high price in the High scenario and a low price in the Low scenario, the corresponding difference is NOK 8,300 billion.
Fields and discoveries
In this chapter:
The infrastructure on the NCS consists of an extensive network of pipelines, platforms, subsea facilities, onshore receiving terminals, storage and export facilities. This infrastructure connects fields, discoveries and markets and is a prerequisite for efficient resource utilisation. Without access to existing facilities, large parts of the value potential in both proven and undiscovered resources are difficult to realise.
The NCS finds itself in a challenging phase, with declining production from many fields and consistently small discoveries. In well-explored areas, future value creation will depend largely on improved recovery from existing fields, swift development of discoveries and continued operation of infrastructure. These factors are closely interrelated and interdependent.
The lifetime and capacity of the infrastructure determine which discoveries can be developed and when. In addition, field centres and transport systems must be kept in operation long enough to allow new discoveries to be tied back. For small discoveries, access to available processing and transport capacity is often crucial for profitability.
Technology development along the entire value chain, coupled with the players' willingness to invest, determines whether remaining resources can be developed. Otherwise, the risk of a rapid decline in production increases.
Production levels – slowing down the decline
At the end of 2025, 97 fields were in production on the NCS with total production of 240 million scm oe. At the beginning of the 2000s, approximately 40 fields yielded a similar production volume (Figure 3.1). Production has thus shifted from a few large fields to being distributed across many small and medium-sized fields, with lower average production.
Today, Johan Sverdrup and Troll alone account for approximately 30 per cent of oil production and 35 per cent of gas production, respectively. The remaining production is divided between many medium-sized and small fields.
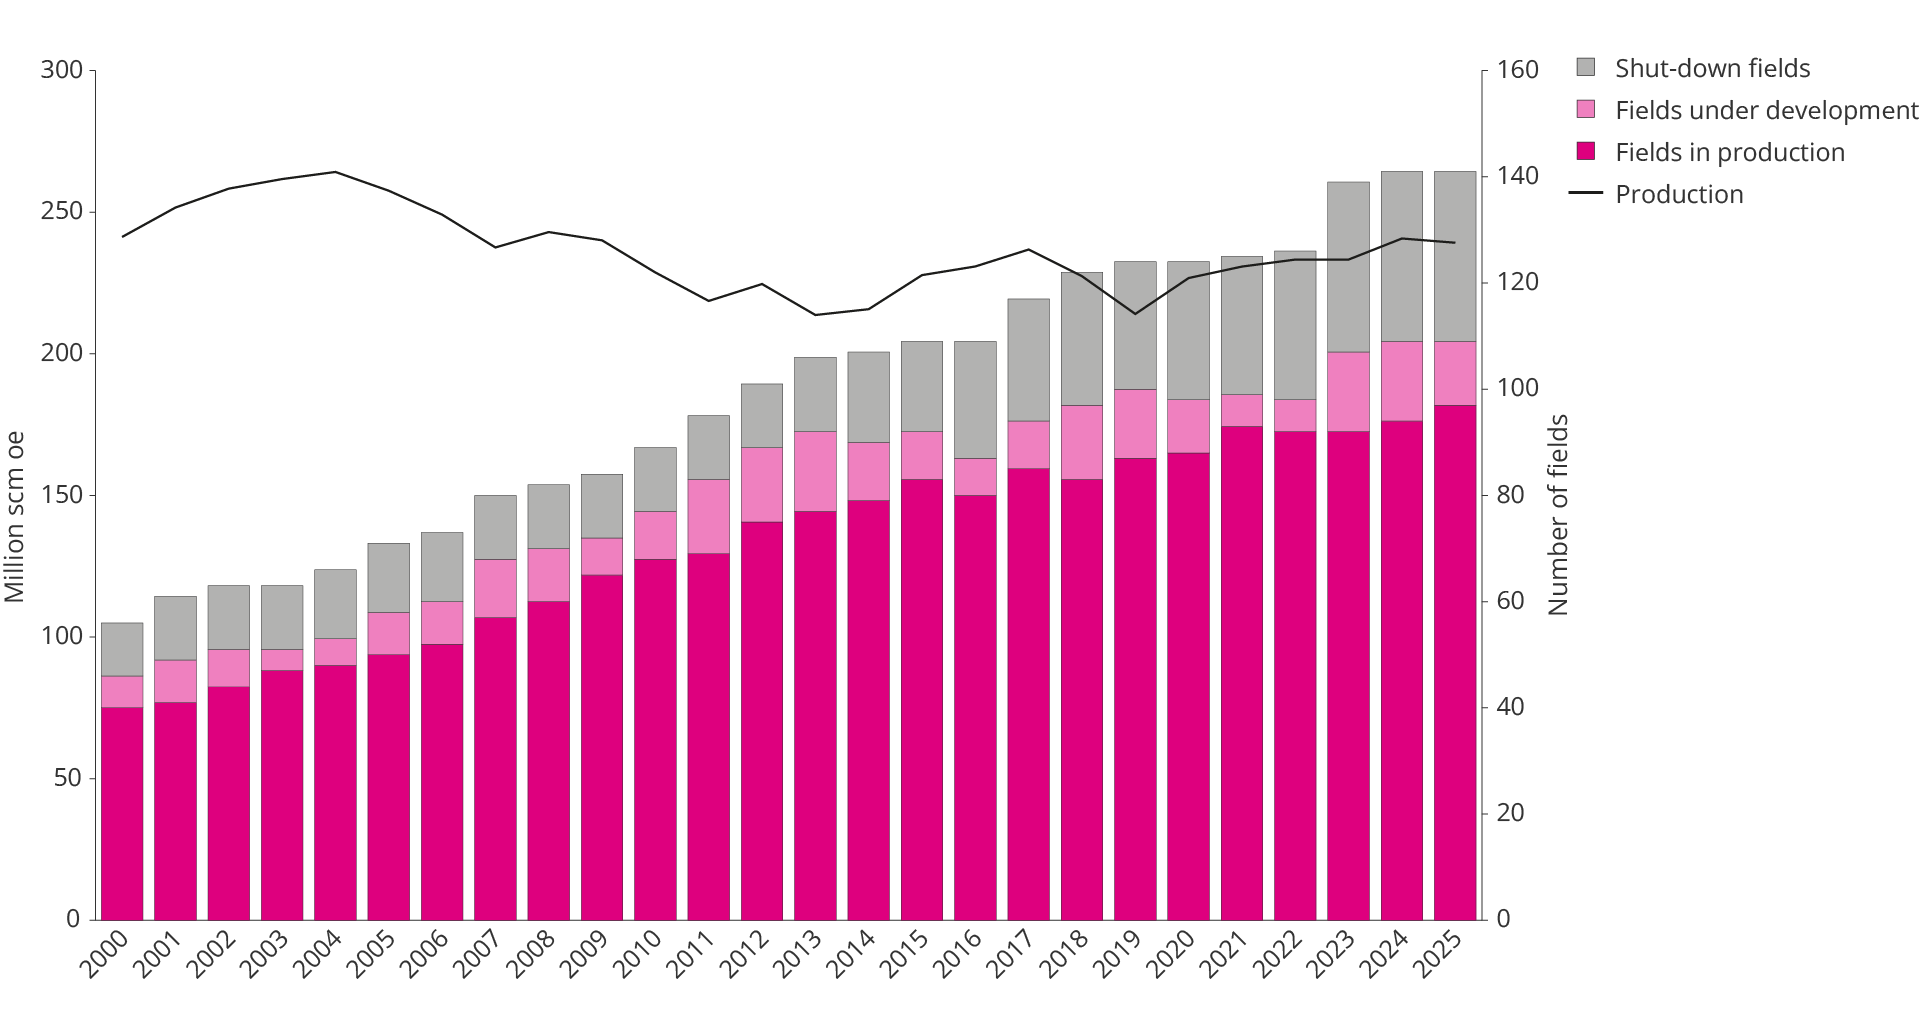
Figure 3.1 Number of fields as of 31 December each year and total production on the shelf over time
Production has gradually shifted from oil to gas. The gas proportion increased markedly from the mid-2000s and has remained relatively stable since then (Figure 3.2).
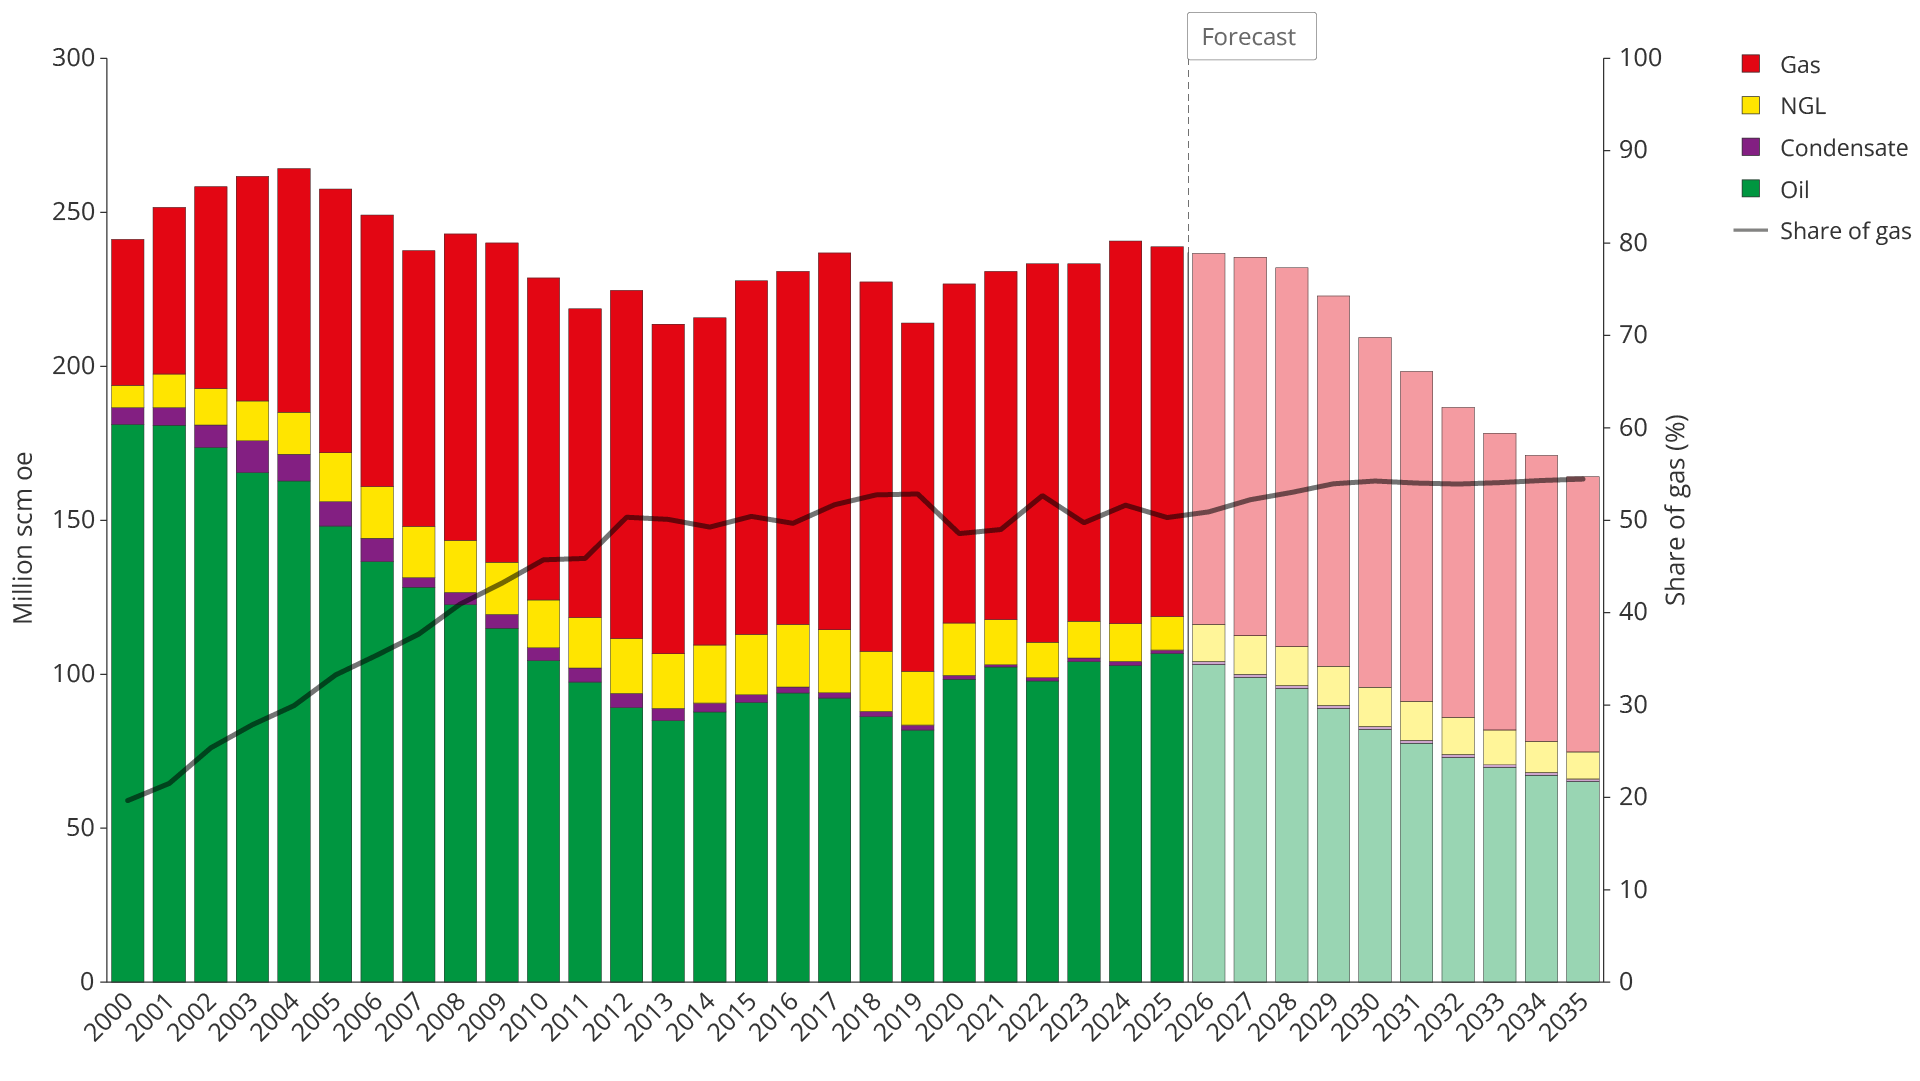
Figure 3.2 Historical production development from 2000 and forecasts up to 2035
Total petroleum production is expected to remain at a high level until the end of the 2020s, before declining gradually towards 2035. This is despite several new fields coming on stream and measures being implemented to improve recovery on fields already in operation.
If the production forecast up to 2035 is based only on contributions from producing fields and approved development projects for new fields, total production will fall markedly throughout the period. As Figure 3.3 illustrates, resources awaiting development decisions in the fields and discoveries must contribute increasingly towards curb this decline. These resources account for an increasing proportion of the expected production towards 2035. In the longer term, exploration will play an increasingly crucial role.
Decisions on further development of resources in fields and discoveries, together with continued exploration activity, contribute to slowing the decline in production, maintaining production and securing long-term value creation on the NCS.

Figure 3.3 Production forecast by field, discovery and undiscovered resources in the period 2026–2035
Rising costs challenge profitability
As fields age and production declines, the cost per unit produced increases. This weakens profitability, especially in the late phase of the field’s lifetime. Ageing facilities require more maintenance and more frequent inspections, while the depletion of reservoirs results in increased water production and higher technical complexity in operations.
It is also difficult to adapt costs related to staffing, logistics and emergency preparedness to declining production. As production levels diminish, unit costs increase further, putting additional pressure on late-phase profitability.
The development in operating costs is also affected by cost levels in the supplier industry. The main reason for the decline in costs after 2014 was lower supplier prices, while the increase from 2021 is largely due to higher electricity prices in particular. Figure 3.4 illustrates the historical development in operating costs per unit produced.
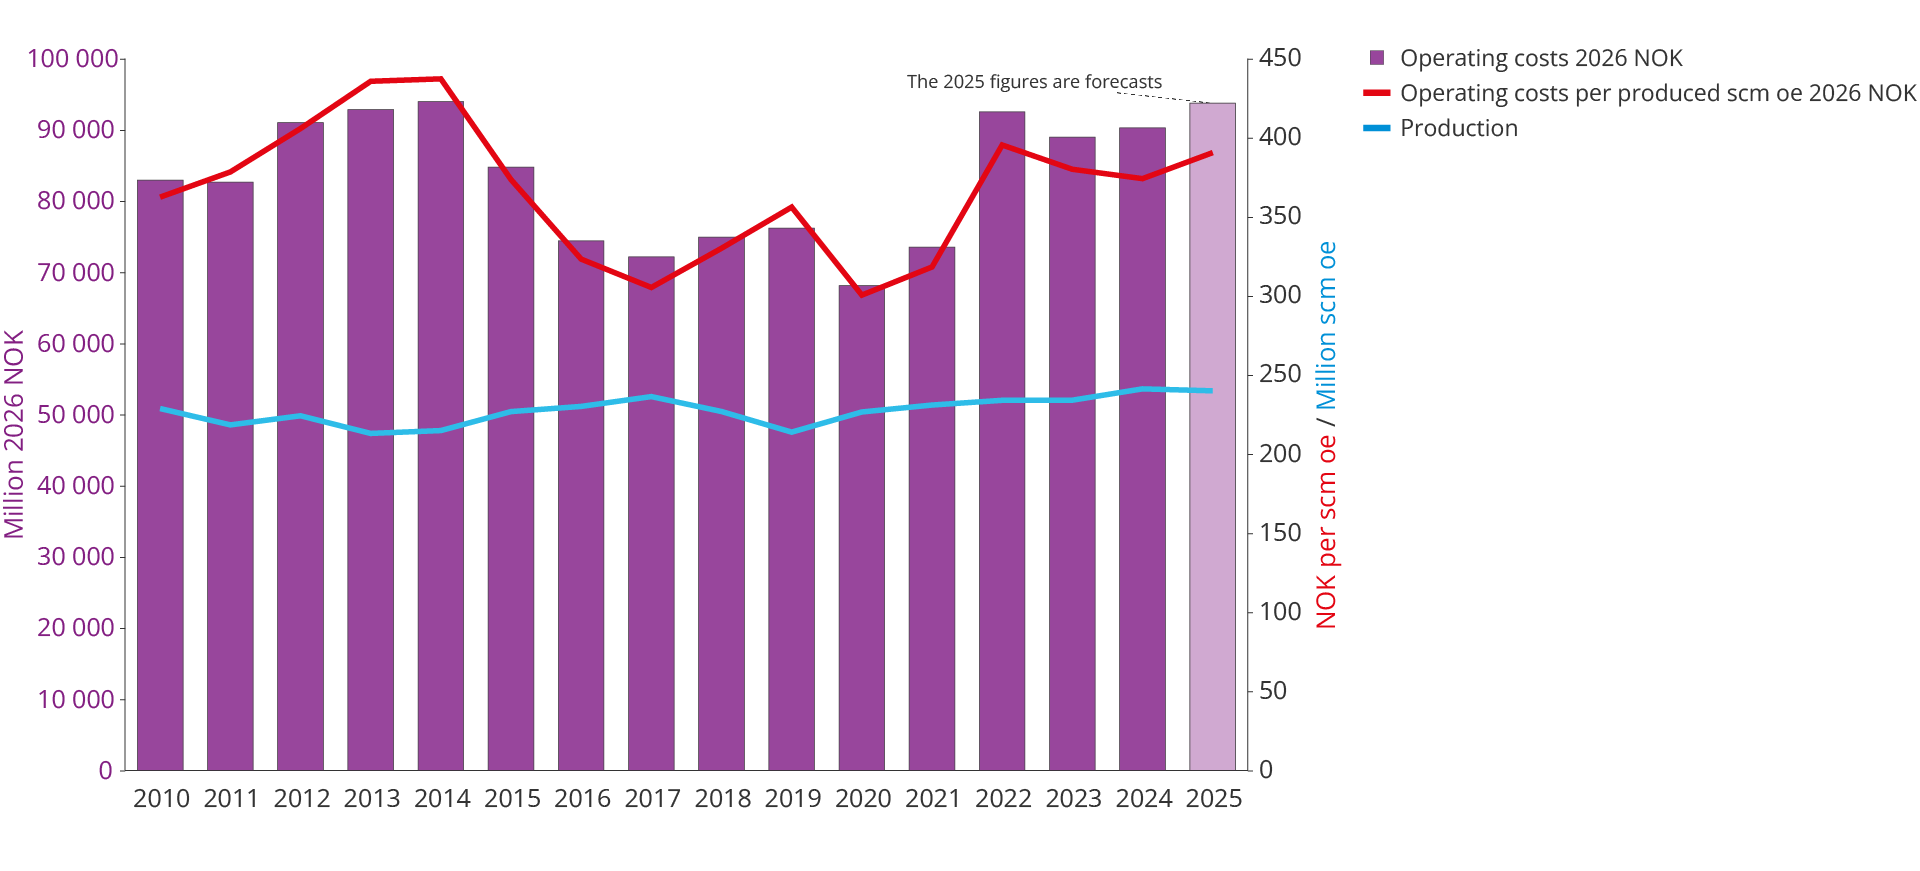
Figure 3.4 Development in operating costs, production and operating costs per unit produced 2010–2025
Improved recovery can curb the decline in production
Many fields on the NCS are likely to be shut down with significant resource volumes remaining in the reservoirs. If these resources are to be developed, targeted measures are required to improve recovery. Such measures can curb the decline in production and extend the fields’ lifetime.
Figure 3.5 shows the 25 oil fields with the largest remaining oil resources as of 31 December 2025. The volumes marked in light green illustrate the potential for improved recovery.
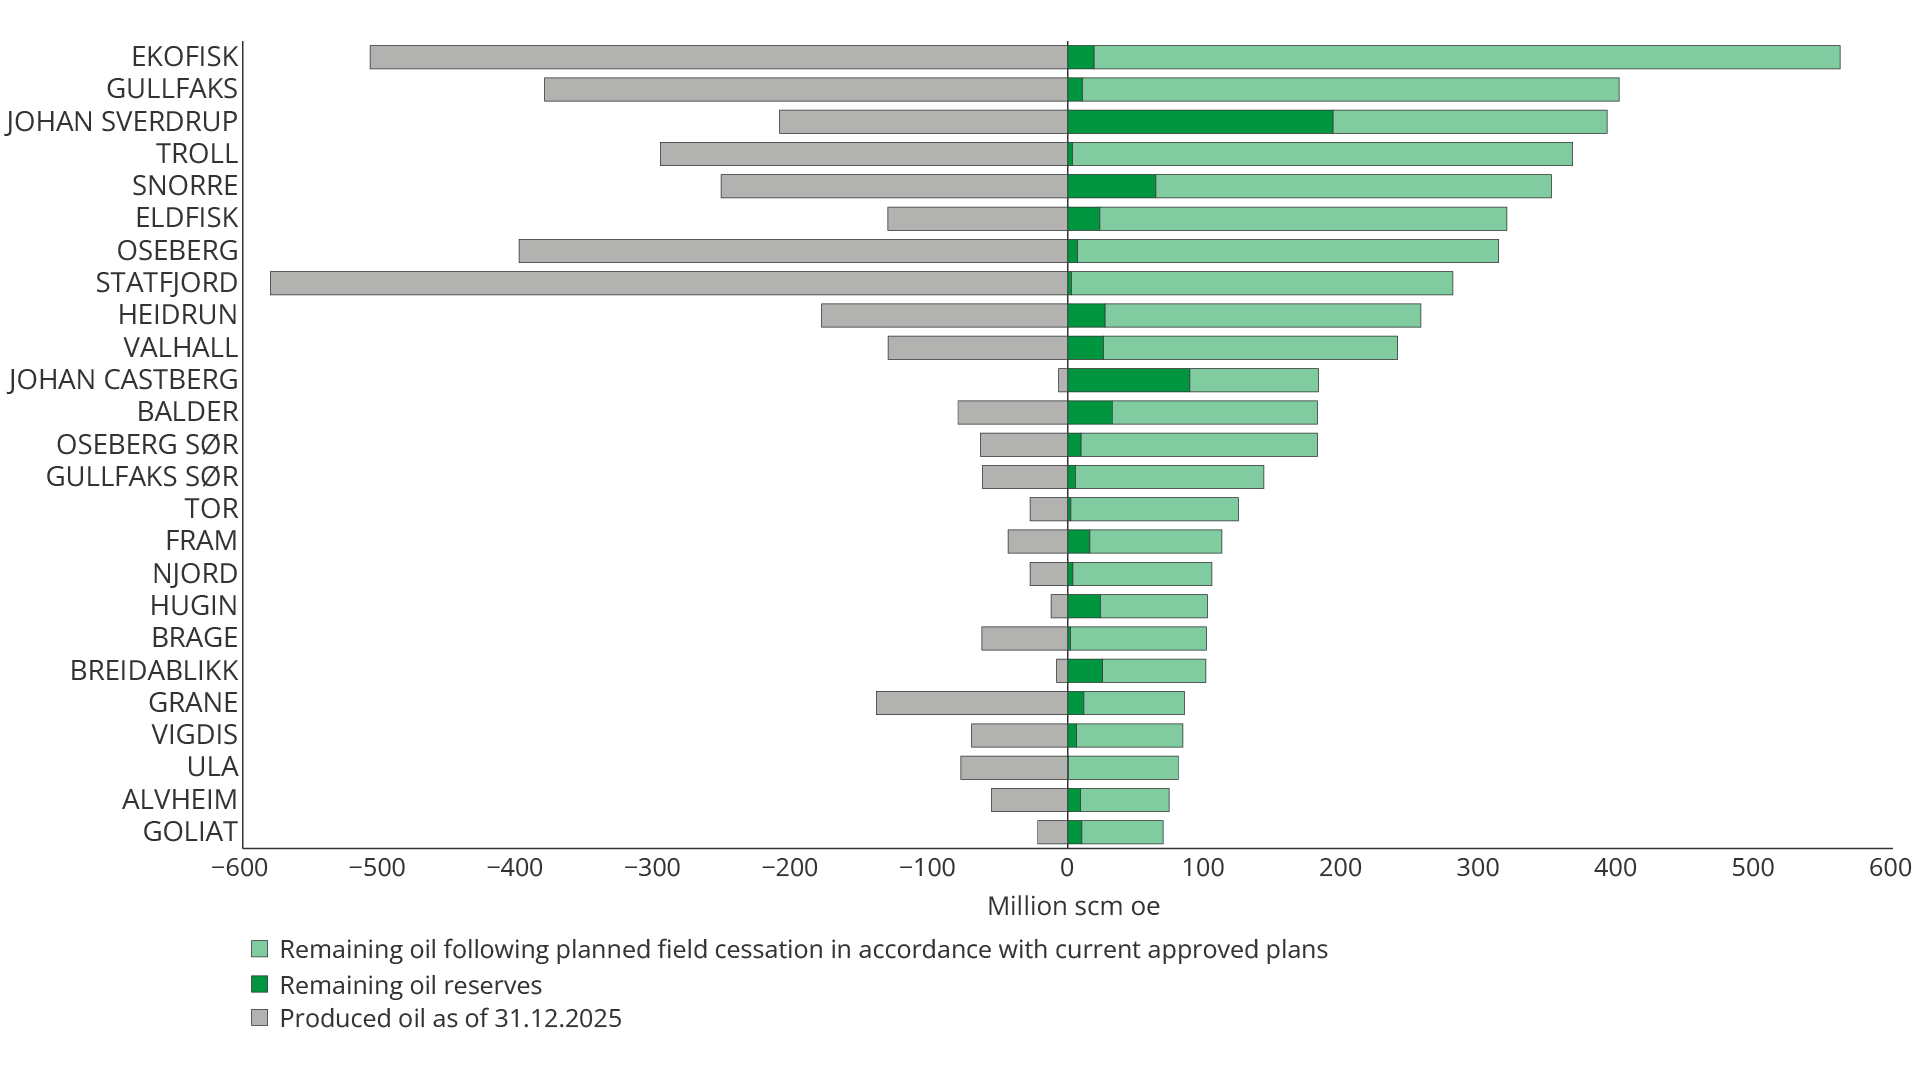
Figure 3.5 25 oil fields with the largest remaining resources as of 31.12.2025
How can we extract more oil and gas from the fields?
Petroleum production normally starts with natural recovery, where the reservoir's own pressure and drive mechanisms help oil and gas flow towards the wells. On many NCS fields, however, water and/or gas injection is included in the development solution from start-up to support the reservoir pressure and achieve the recovery rate upon which the original development plan is based. Such pressure support measures are thus often part of the original development concept and are not in themselves considered measures for improved recovery.
To increase the recovery rate beyond the basis for the originally planned drainage strategy, separate measures can be implemented later to improve recovery. Such measures are often divided into conventional and advanced methods, depending on the choice of technology and complexity. The figure shows examples of measures to improve recovery from producing fields under Norwegian conditions.
Conventional measures, or so-called IOGR (improved oil and gas recovery), are measures for improved recovery which are based on the use of established technologies in producing fields to improve drainage strategies and increase the recovery rate. The purpose is to recover some of the remaining resources that would not otherwise have been produced.
Advanced measures, or so-called EOGR (enhanced oil and gas recovery), include methods that can increase the recovery rate beyond that achievable by conventional methods. The measures aim to enhance the sweep in the reservoir, either by draining a larger volume of the reservoir (increased macroscopic sweep) or by reducing the amount of residual oil in the porous structures (increased microscopic sweep).
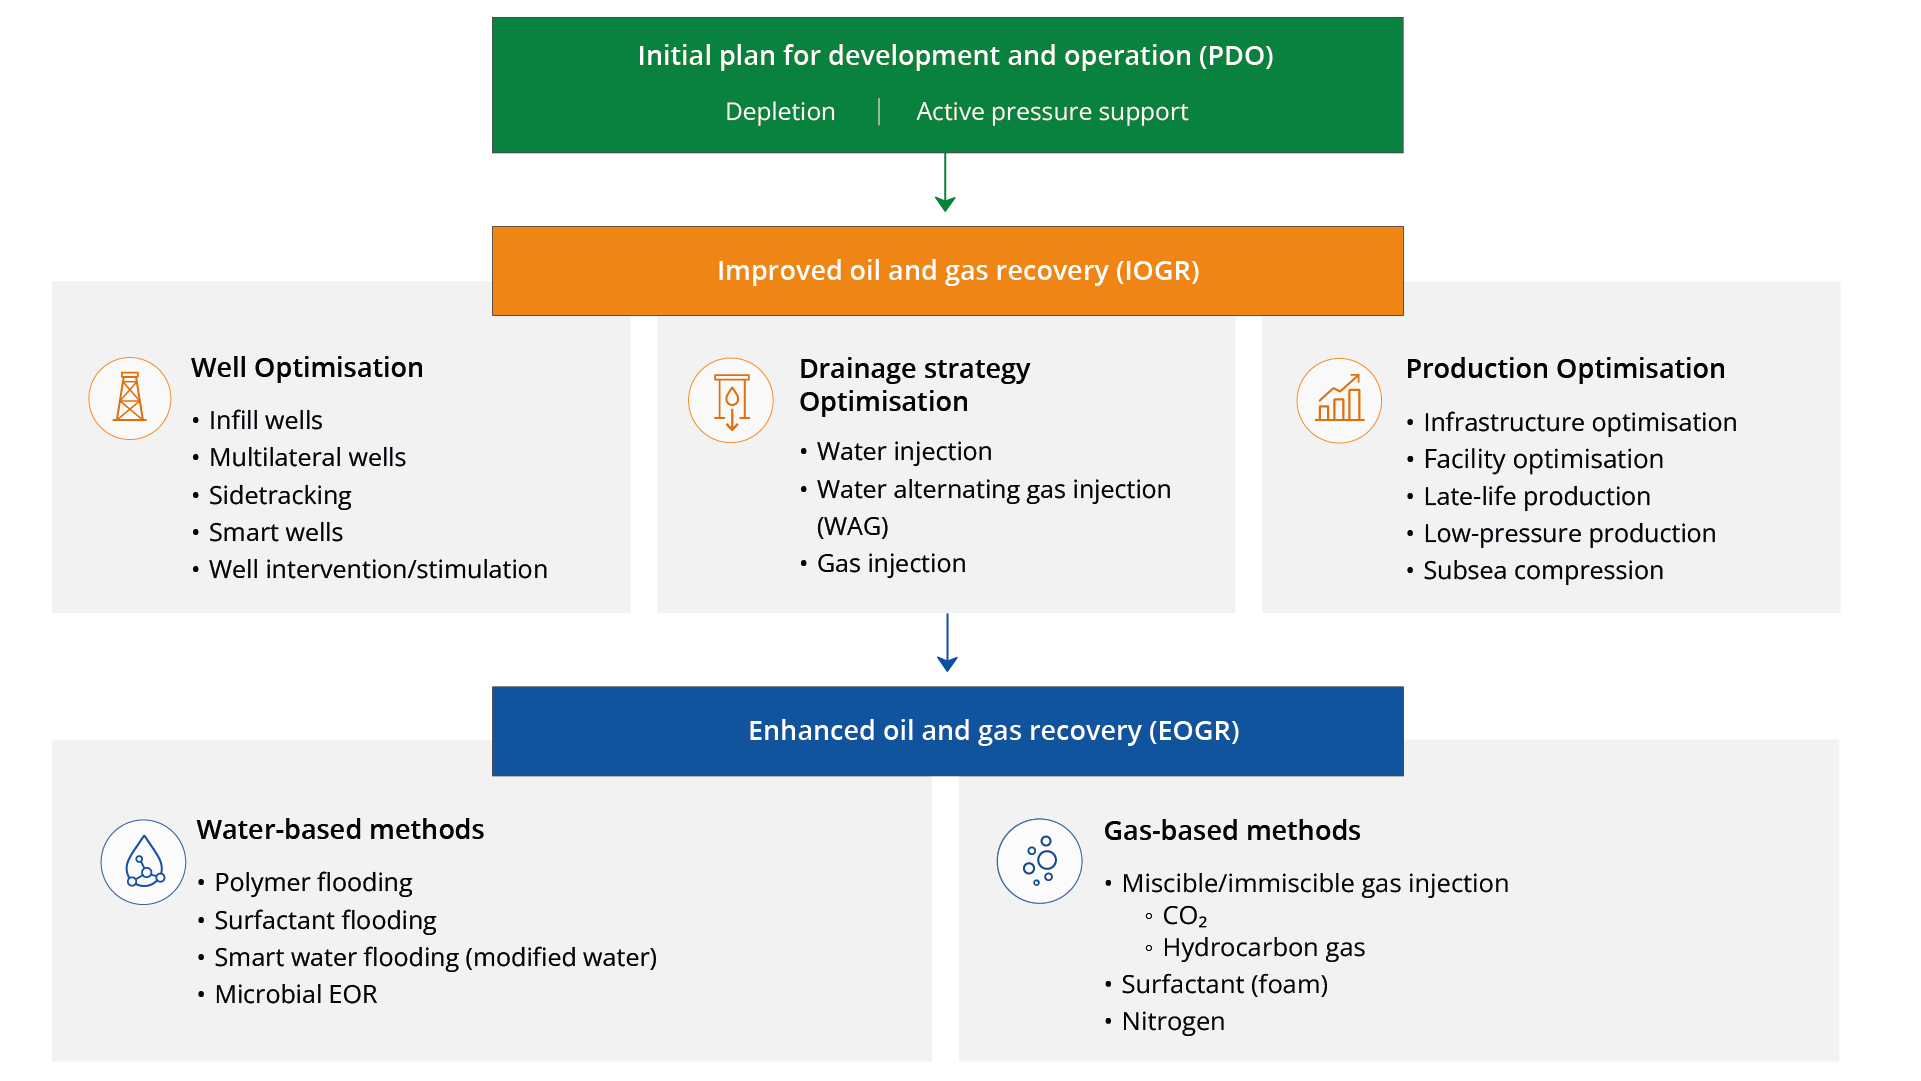
The figure shows examples of measures to improve recovery from producing fields under Norwegian conditions.
The NCS has an average recovery rate of approximately 50 per cent. For gas, the recovery rate is even higher. Nevertheless, large volumes remain in the reservoirs. These cannot be extracted using current technology and methods.
Experience from the NCS shows that long-term, systematic work on improved recovery has added considerably to the recoverable resources. The licensees map the resource base on an ongoing basis and assess measures to improve recovery from producing fields.
In the report to the Revised National Budget (RNB) 2026, the companies reported around 145 specific improved recovery projects awaiting development decision. The projects correspond to an estimated 280 million scm oe, approximately 50 million scm oe lower than in the previous resource report. The decline can partly be explained by the fact that some of the projects have matured and been transferred to the reserves category.
The registered projects are divided into five main categories; drilling of development wells, further development, low-pressure production, late-phase production, as well as injection and advanced methods as illustrated in Figure 3.6. Of these, only advanced methods are included in EOGR, while the other categories are considered IOGR.
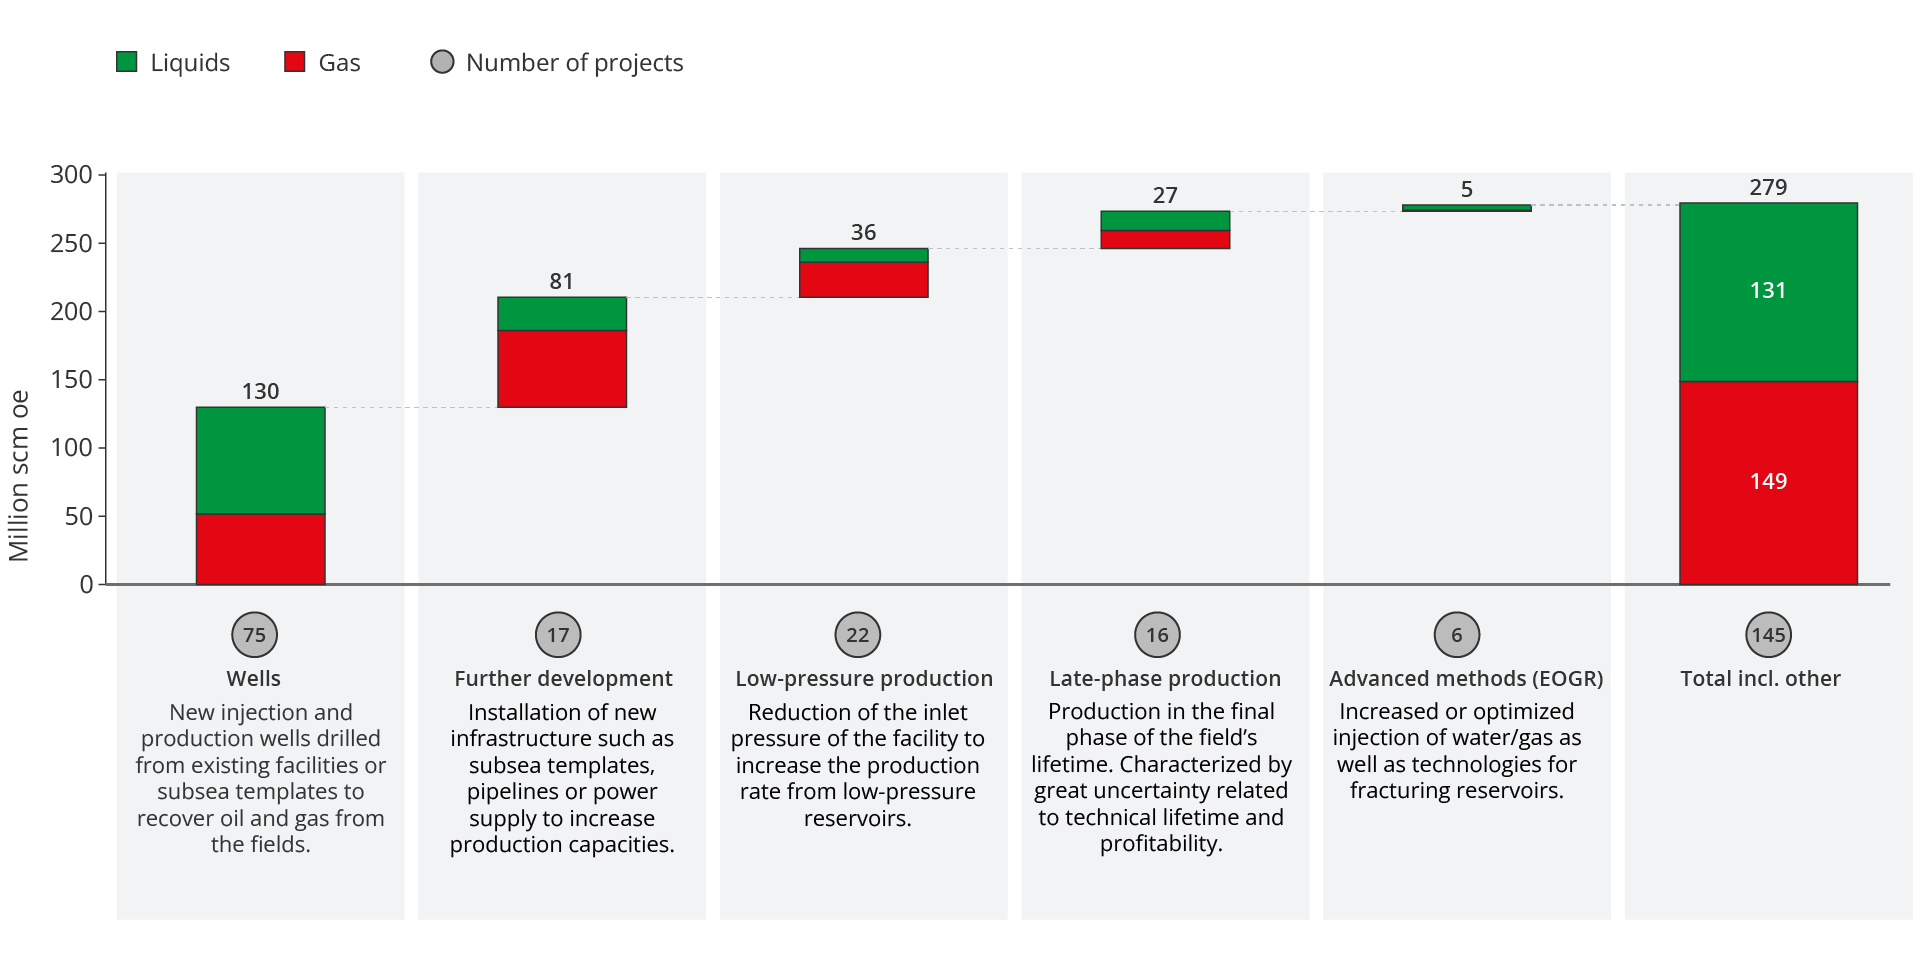
Figure 3.6 Concrete measures awaiting development decision reported in 2025
New wells contribute most to improved recovery
Among the conventional measures for improved recovery (IOGR), wells are by far the largest single category, accounting for around half of the reported projects.
Figure 3.7 shows the significance of drilling new wells to maintain production from existing fields. In 2025, more than 60 per cent of oil production came from wells drilled and put on stream after 2020. To illustrate the contribution from new wells in mature fields, production from fields that came on stream after 2020 has been excluded.
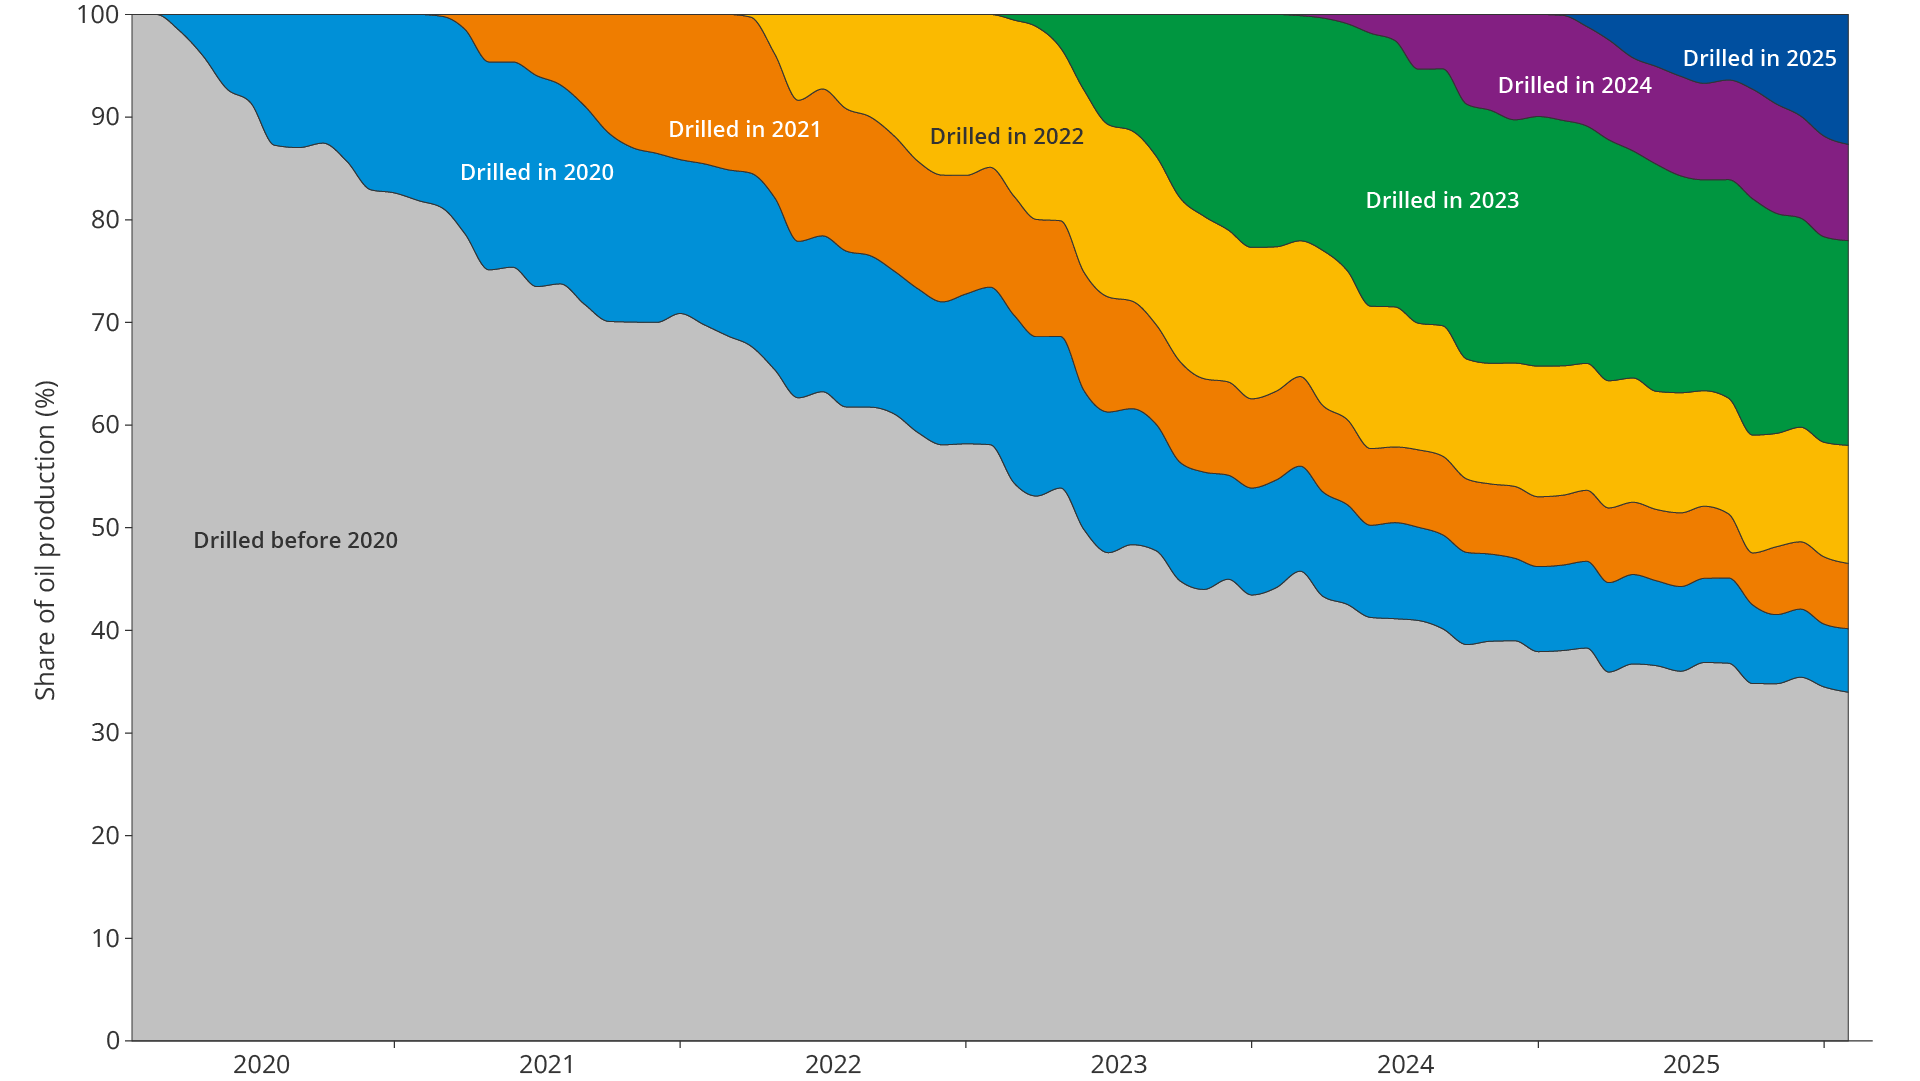
Figure 3.7 Proportion of oil production after the well's start-up year
The development in the number of new development wells (production and injection) per year in the period 2000–2025 is shown in Figure 3.8.
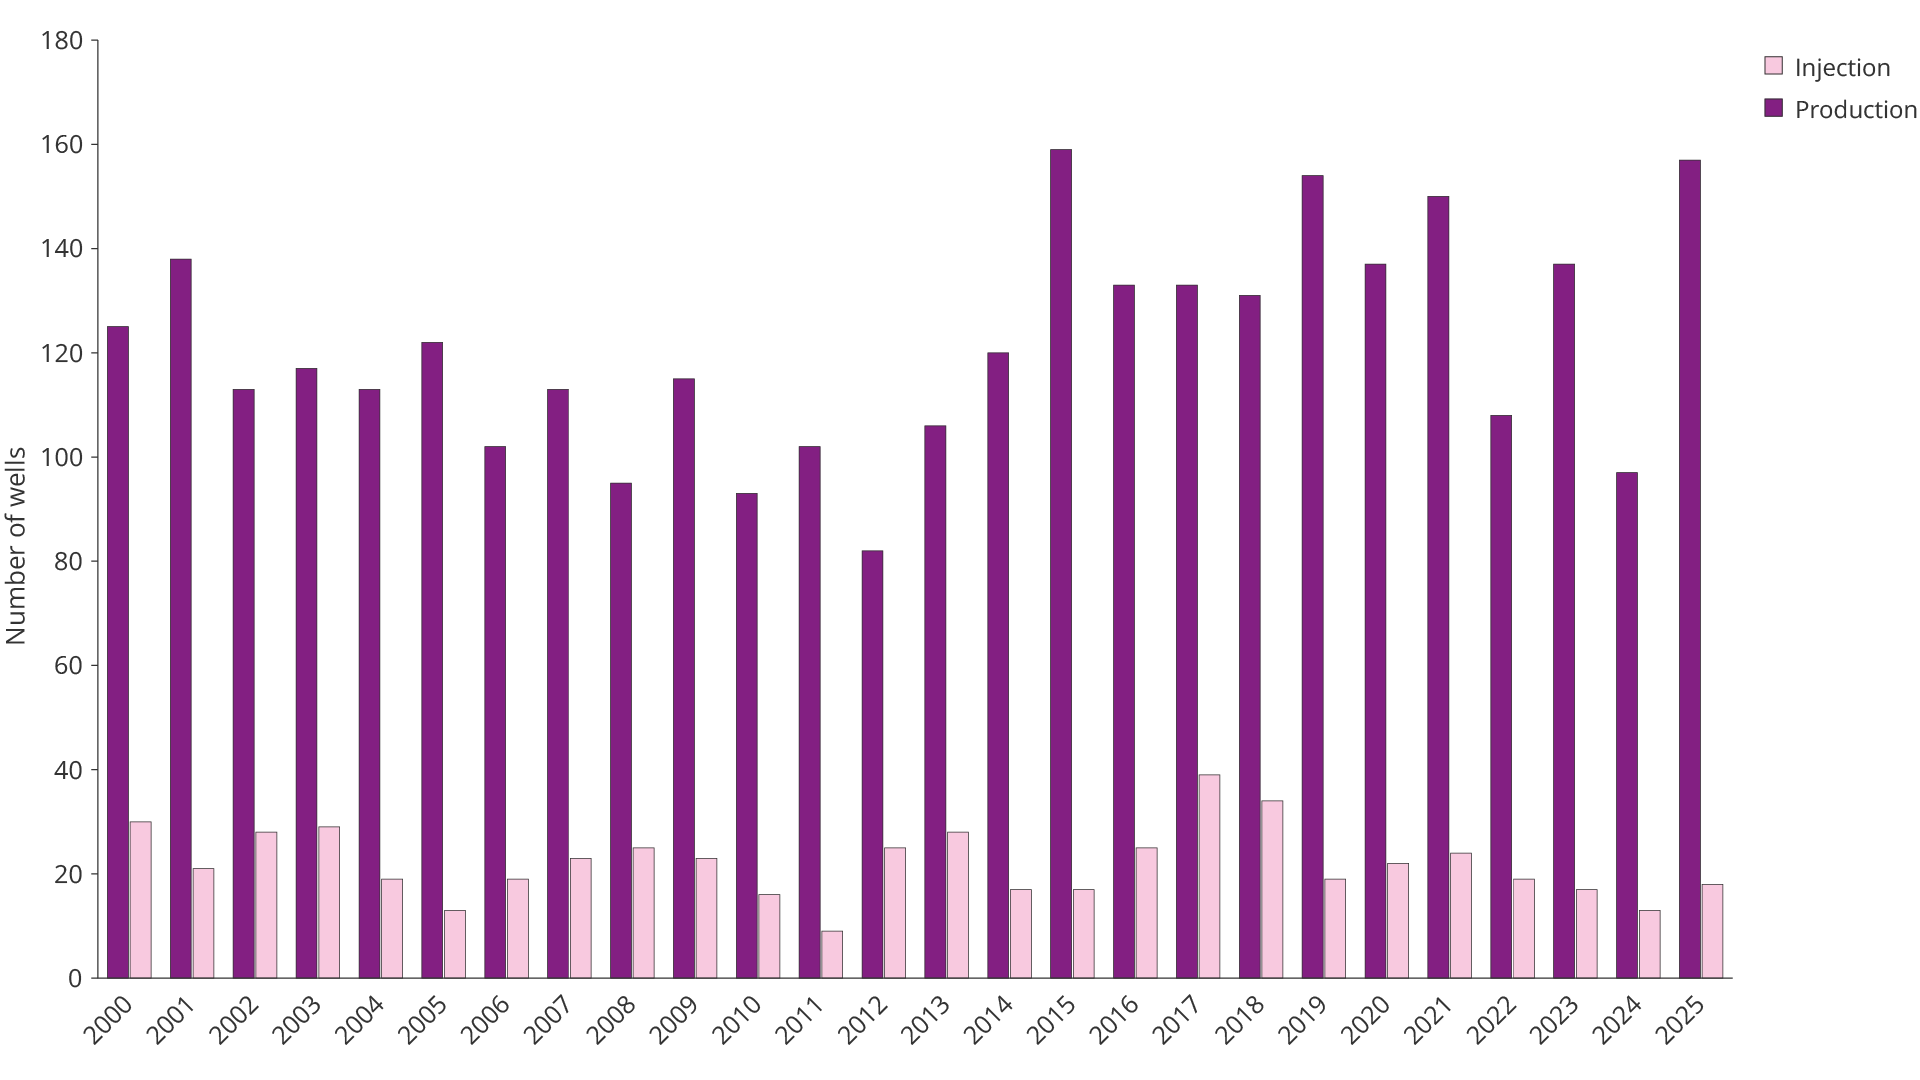
Figure 3.8 Number of development wells on the NCS 2000–2025
Drilling of development wells has varied considerably since 2000, with a clear decline up to the early 2010s before levels picked up again.
In recent years, drilling activity has been higher, driven by measures on mature fields and increased activity following the temporary tax changes of 2020. With 175 wells spudded, 2025 is one of the years with highest drilling activity since the peak year of 2015.
Further drilling is crucial to maintain production and value creation, particularly as production declines on the shelf. Despite the importance of new development wells to maintain production in mature fields, strict profitability requirements can lead to well targets with significant value potential not being developed.
EOGR is not prioritised by the industry
Advanced methods for enhanced recovery (EOGR) account for only four per cent of the specific projects related to improved recovery, whilst the technical potential is considerable.
Many EOGR concepts are not implemented due to technical uncertainty, strict internal profitability requirements, limited access to miscible gas for injection, challenges related to chemical classification and strict environmental requirements.
New EOGR solutions are associated with market failure in the form of positive externalities, because the individual operator bears the entire risk and cost of technology development, while the benefits accrue to several players over time.
At the same time, the increased use of break-even price as a decision-making criterion, particularly since the oil price drop in 2014–2015, contributes to the development of only the most commercially profitable projects. This in turn results in systematic underinvestment in the development of new EOGR solutions compared to what is economically beneficial for society.
International experience shows that advanced EOGR methods can improve recovery. Examples of this are CO2 injection in Brazil and polymer injection and smart water injection in the UK(7)(8)(9).
On the NCS too, there is considerable technical potential for improved recovery through advanced EOGR methods. However, the time window for realising this potential is limited. The room for manoeuvre for new measures diminishes gradually as the time for shutting down a field approaches. Further technology development may nevertheless influence the situation, rendering measures previously downgraded relevant again.
How to develop and realise more EOGR projects?
How enhanced recovery (EOGR) can be achieved has been assessed in two public reports. One is the Recovery Committee's report on increased recovery on the NCS(10), hereinafter referred to as the Åm Committee. The second is the Office of the Auditor General's investigation into the authorities' efforts to improve oil recovery from mature areas on the NCS(11).
Measures which are still relevant
The reports point to several measures to increase the use of EOGR. In particular, the need to strengthen and target PETROMAKS and DEMO 2000 towards EOGR projects is highlighted.
They also recommend a forum for EOGR pilots across the production licences, with clear responsibilities and tasks, as well as increased capacity and a clearer mandate for Petoro to drive forward EOGR on priority fields.
Frameworks, incentives and environmental assessments
Both reports point to the handling of chemical projects as a key barrier for EOGR. Projects are halted prematurely, both by internal assessments and external environmental requirements.
The Åm Committee recommended a more comprehensive process by the authorities, based on overall cost-benefit analyses. The Office of the Auditor General also pointed out that companies often use higher required rates of return and a shorter time horizon than government advisers, for example by using break-even pricing as a decision-making criterion.
The state’s role through Petoro
The reports show that business economic assessments often result in too little investment in EOGR and point to the need for public policy instruments.
The Åm Committee recommended strengthening Petoro's role in assessments of long-term measures on mature fields. The Office of the Auditor General pointed out that Petoro has been a driving force for several EOGR pilots, but that capacity is limited.
Both reports also highlighted access to CO₂ as an important prerequisite for CO₂-based EOGR, and the need to see CO₂ storage and EOGR in context.
New technology boosts recovery
Technological innovation makes it possible to increase recovery from remaining resources at lower costs and with improved utilisation of existing infrastructure.
Continuous assessment, maturation and implementation of new technology is an important prerequisite for prudent recovery of petroleum resources, cf. Section 4-1 of the Petroleum Act(12). In its technology strategy, the Norwegian Offshore Directorate has identified the technology areas where implementation is currently insufficient, and where the potential for increased value creation is greatest(13).
Examples of technology which increases recovery, reduces unit costs and extends the lifetime of fields on the NCS:
- Smart production wells with sensors, controllable valves and real-time monitoring make it possible to control production
more precisely between different zones in the reservoir. This in turn enables the reduction of unwanted water and gas production. The result is better resource utilisation and a longer lifetime for the field. - 4D seismic and machine learning-based interpretation methodology provide superior seismic imaging, increased understanding of fluid movement in the reservoir and a better basis for decision-making on the location of new wells and the choice of appropriate recovery measures.
- A new generation of subsea systems can be operated more efficiently from shore and adapted to changing needs throughout the field's lifetime.
Remote control and digitalization improve operations
Remote control and operation from shore is a key measure for improving cost efficiency. When operations, monitoring and decision support are moved to integrated operations centres onshore, offshore staffing can be reduced. Also, expertise can be utilised more flexibly across fields and facilities. This results in lower costs, less exposure for employees and swifter handling of deviations and operational challenges.
The Munin facility is a concrete example which illustrates how digitalisation can enable profitable operations at production levels which were previously unsustainable (see fact box).
Remote control of the Munin facility
Munin is an unmanned production facility which is part of the Yggdrasil development in the North Sea, and will be operated without permanent employees offshore. The facility will be operated and monitored from shore using modern digital solutions. Production, monitoring and technical control will be followed in real time through sensors and automated systems. Operators onshore will have a continuous overview of processes, pressure, temperature and technical condition, and will be able to intervene rapidly in the event of deviations or the need for measures.
Lower costs and increased safety
Remote control contributes to lower operating costs, reduced need for helicopter transport and increased safety by reducing the number of people offshore. The solution also facilitates a more efficient use of expertise and provides more stable and predictable operations. Munin shows how digitalisation and new technology can lay the foundation for cost-effective and safe operations on the NCS.
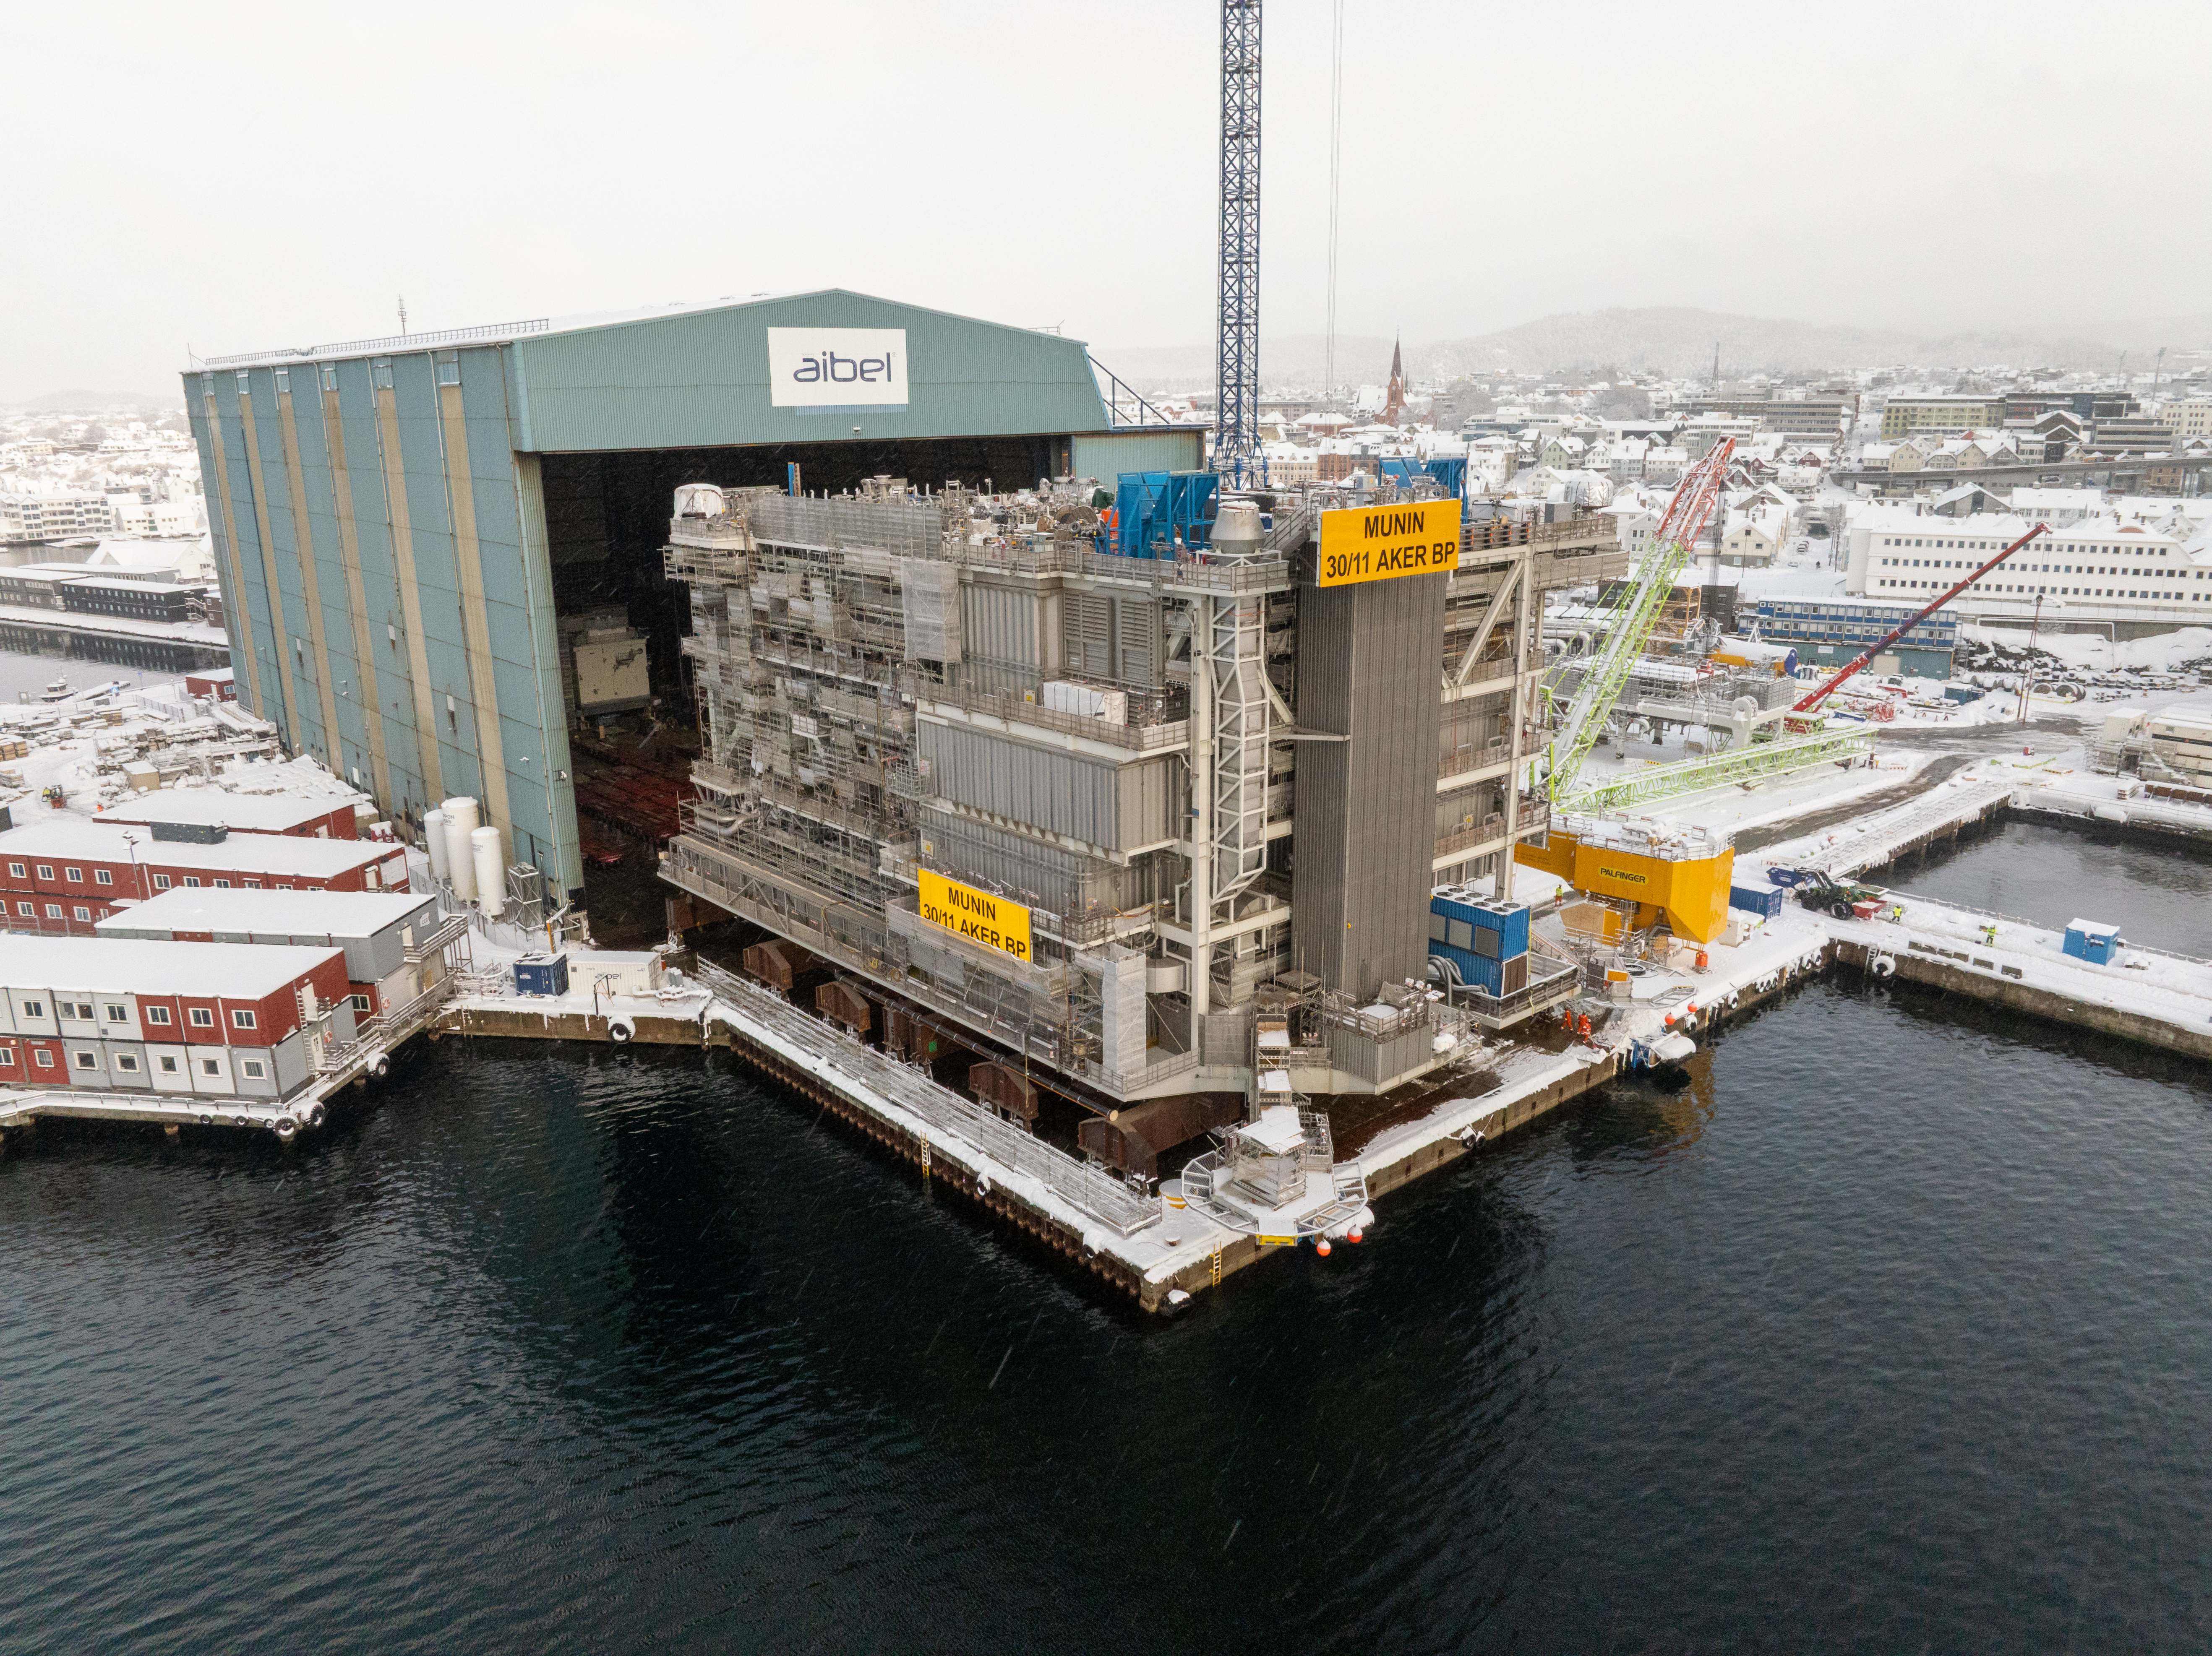
Munin is an unmanned production facility that is part of the Yggdrasil development in the North Sea. (Photo: Aibel/Woldcam)
Digital twins, advanced reservoir monitoring and coordinated operations between facilities provide further efficiency gains. Standardised solutions and sharing of infrastructure across fields contribute to economies of scale and improved capacity utilisation. Overall, this strengthens the basis for cost-effective operation and extended lifetime of the production facilities.
New players revitalise mature fields
In recent years, several new companies have established themselves on the NCS with a clear strategic focus on improved recovery from mature fields and extended lifetime of existing facilities. The companies have often taken over field shares from major international oil companies and specialised in efficient operations, targeted investments and active reservoir follow-up in late-phase fields. In many cases, this has resulted in a higher recovery rate and substantial value creation beyond previous estimates.
Figures 3.9 and 3.10 show the development of remaining reserves in the Draugen and Balder fields before and after the change of operator. The examples illustrate that a change of operator can contribute to improved recovery and extended lifetime for mature fields.
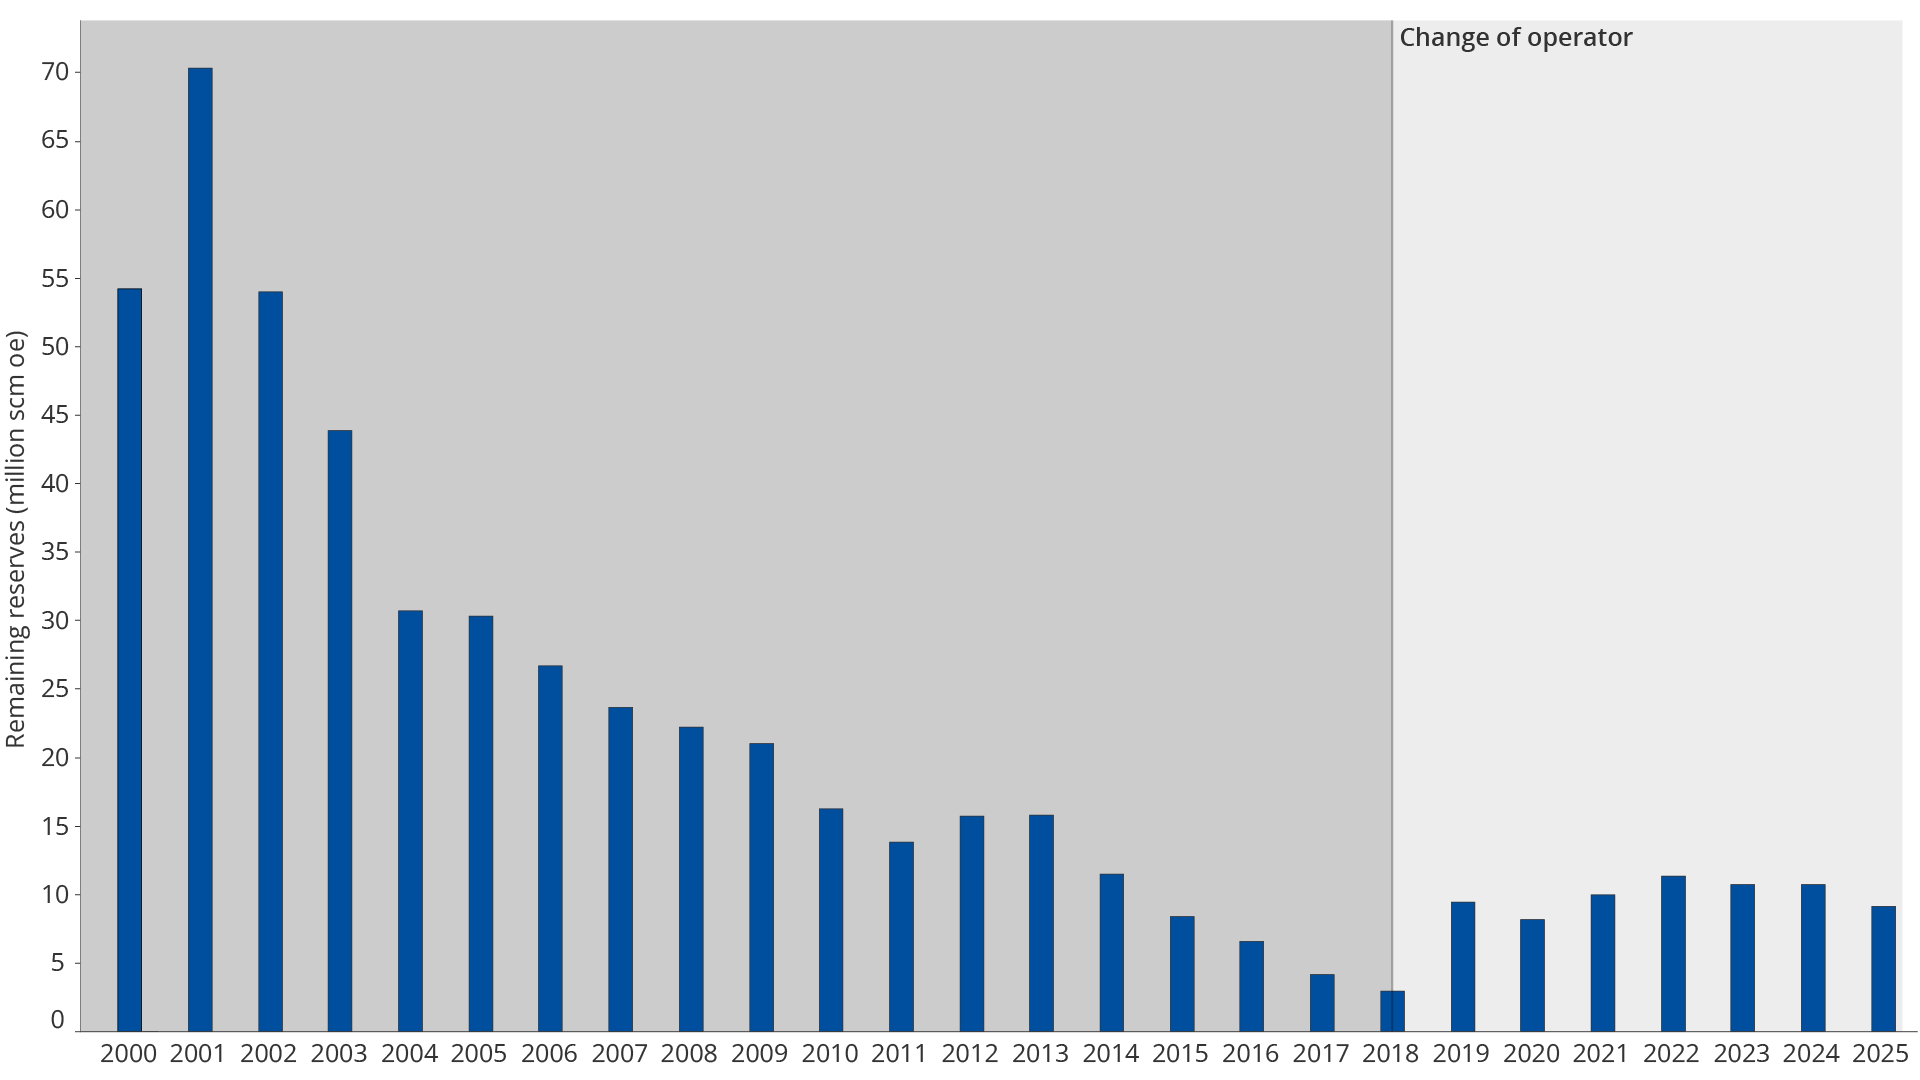
Figure 3.9 Development in remaining reserves for the Draugen field before and after change of operator
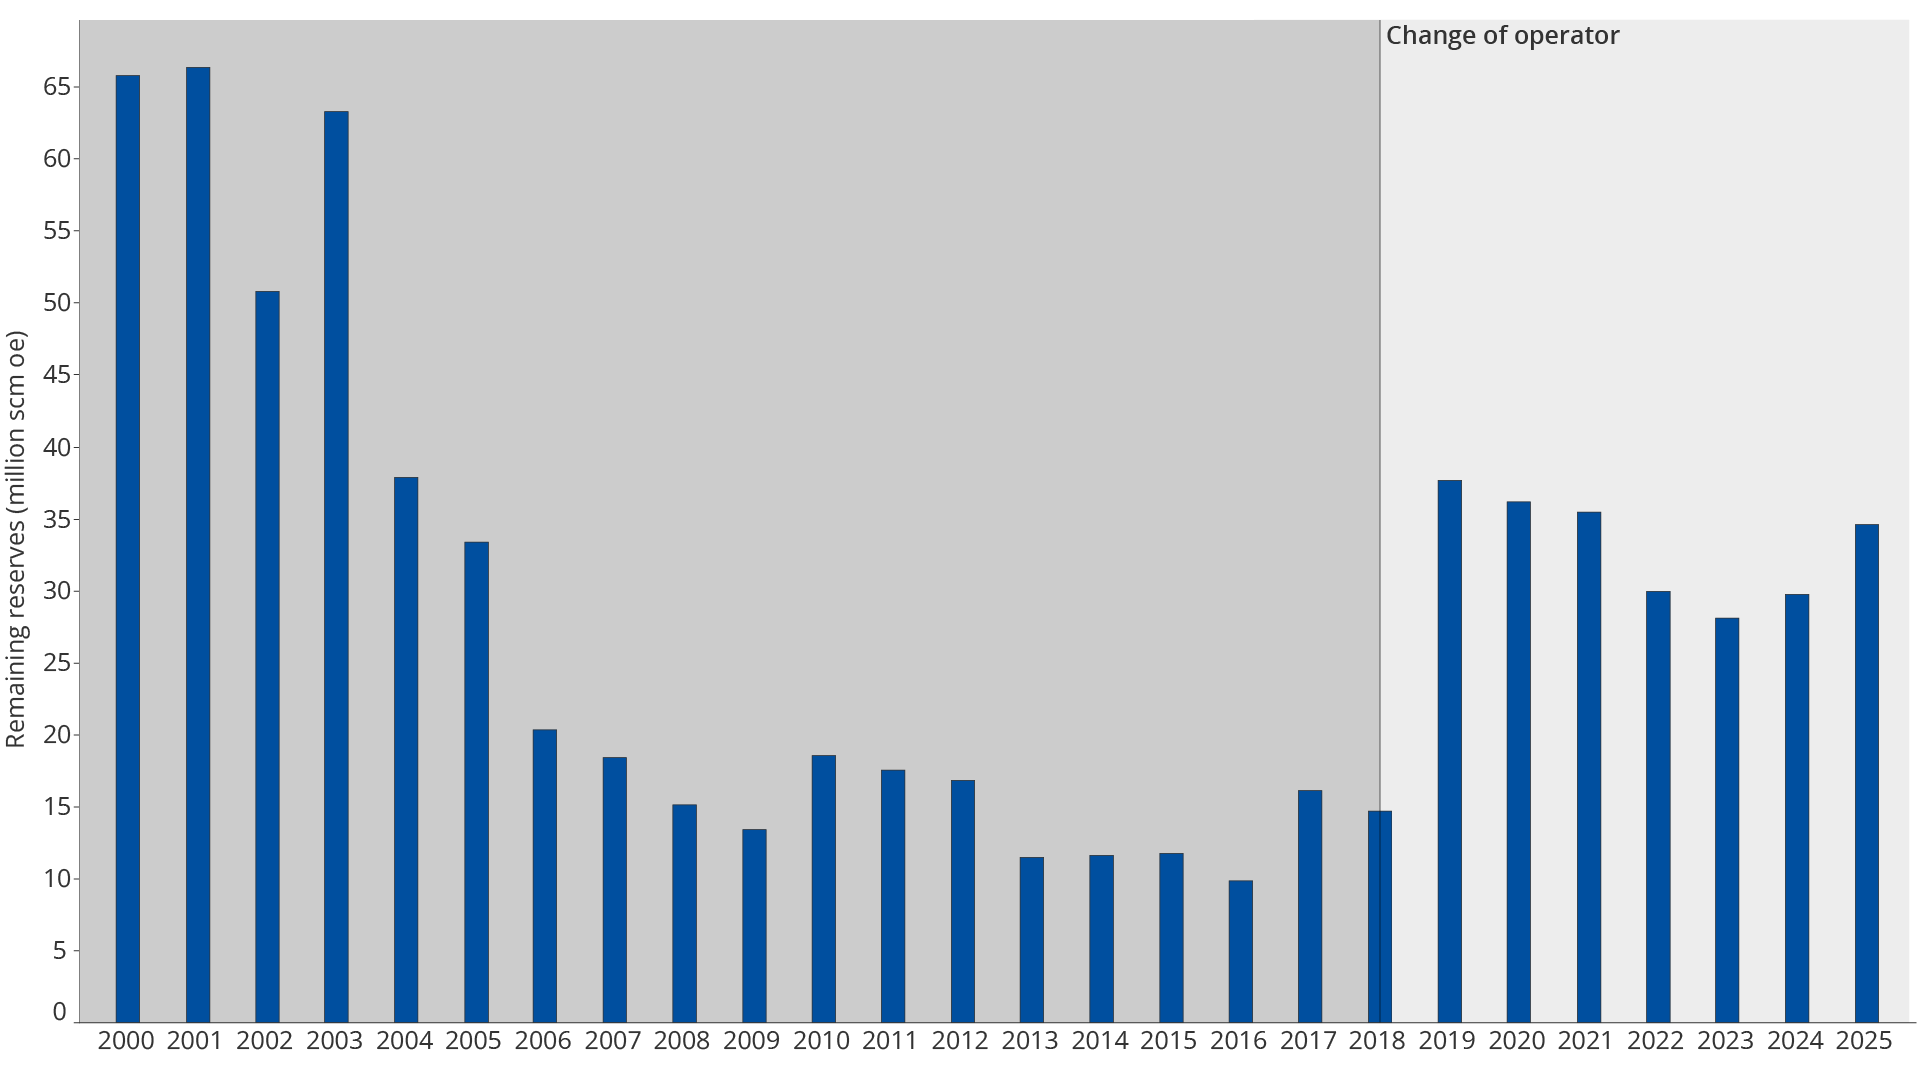
Figure 3.10 Development in remaining reserves for the Balder field before and after change of operator
New opportunities in shut down fields
Reopening of shut down fields may become more relevant as technology develops, cost levels are reduced and existing infrastructure is better utilised. Such projects can provide access to resources that would otherwise have been left behind.
Historically, this practice has not been widespread on the NCS, but developments in the Greater Ekofisk Area have changed the picture. The Tor field was shut down in 2015 after only around 20 per cent of its resources had been produced and was reopened in 2020. The Tor II project is a simplified subsea development tied back to existing infrastructure (Figure 3.11).
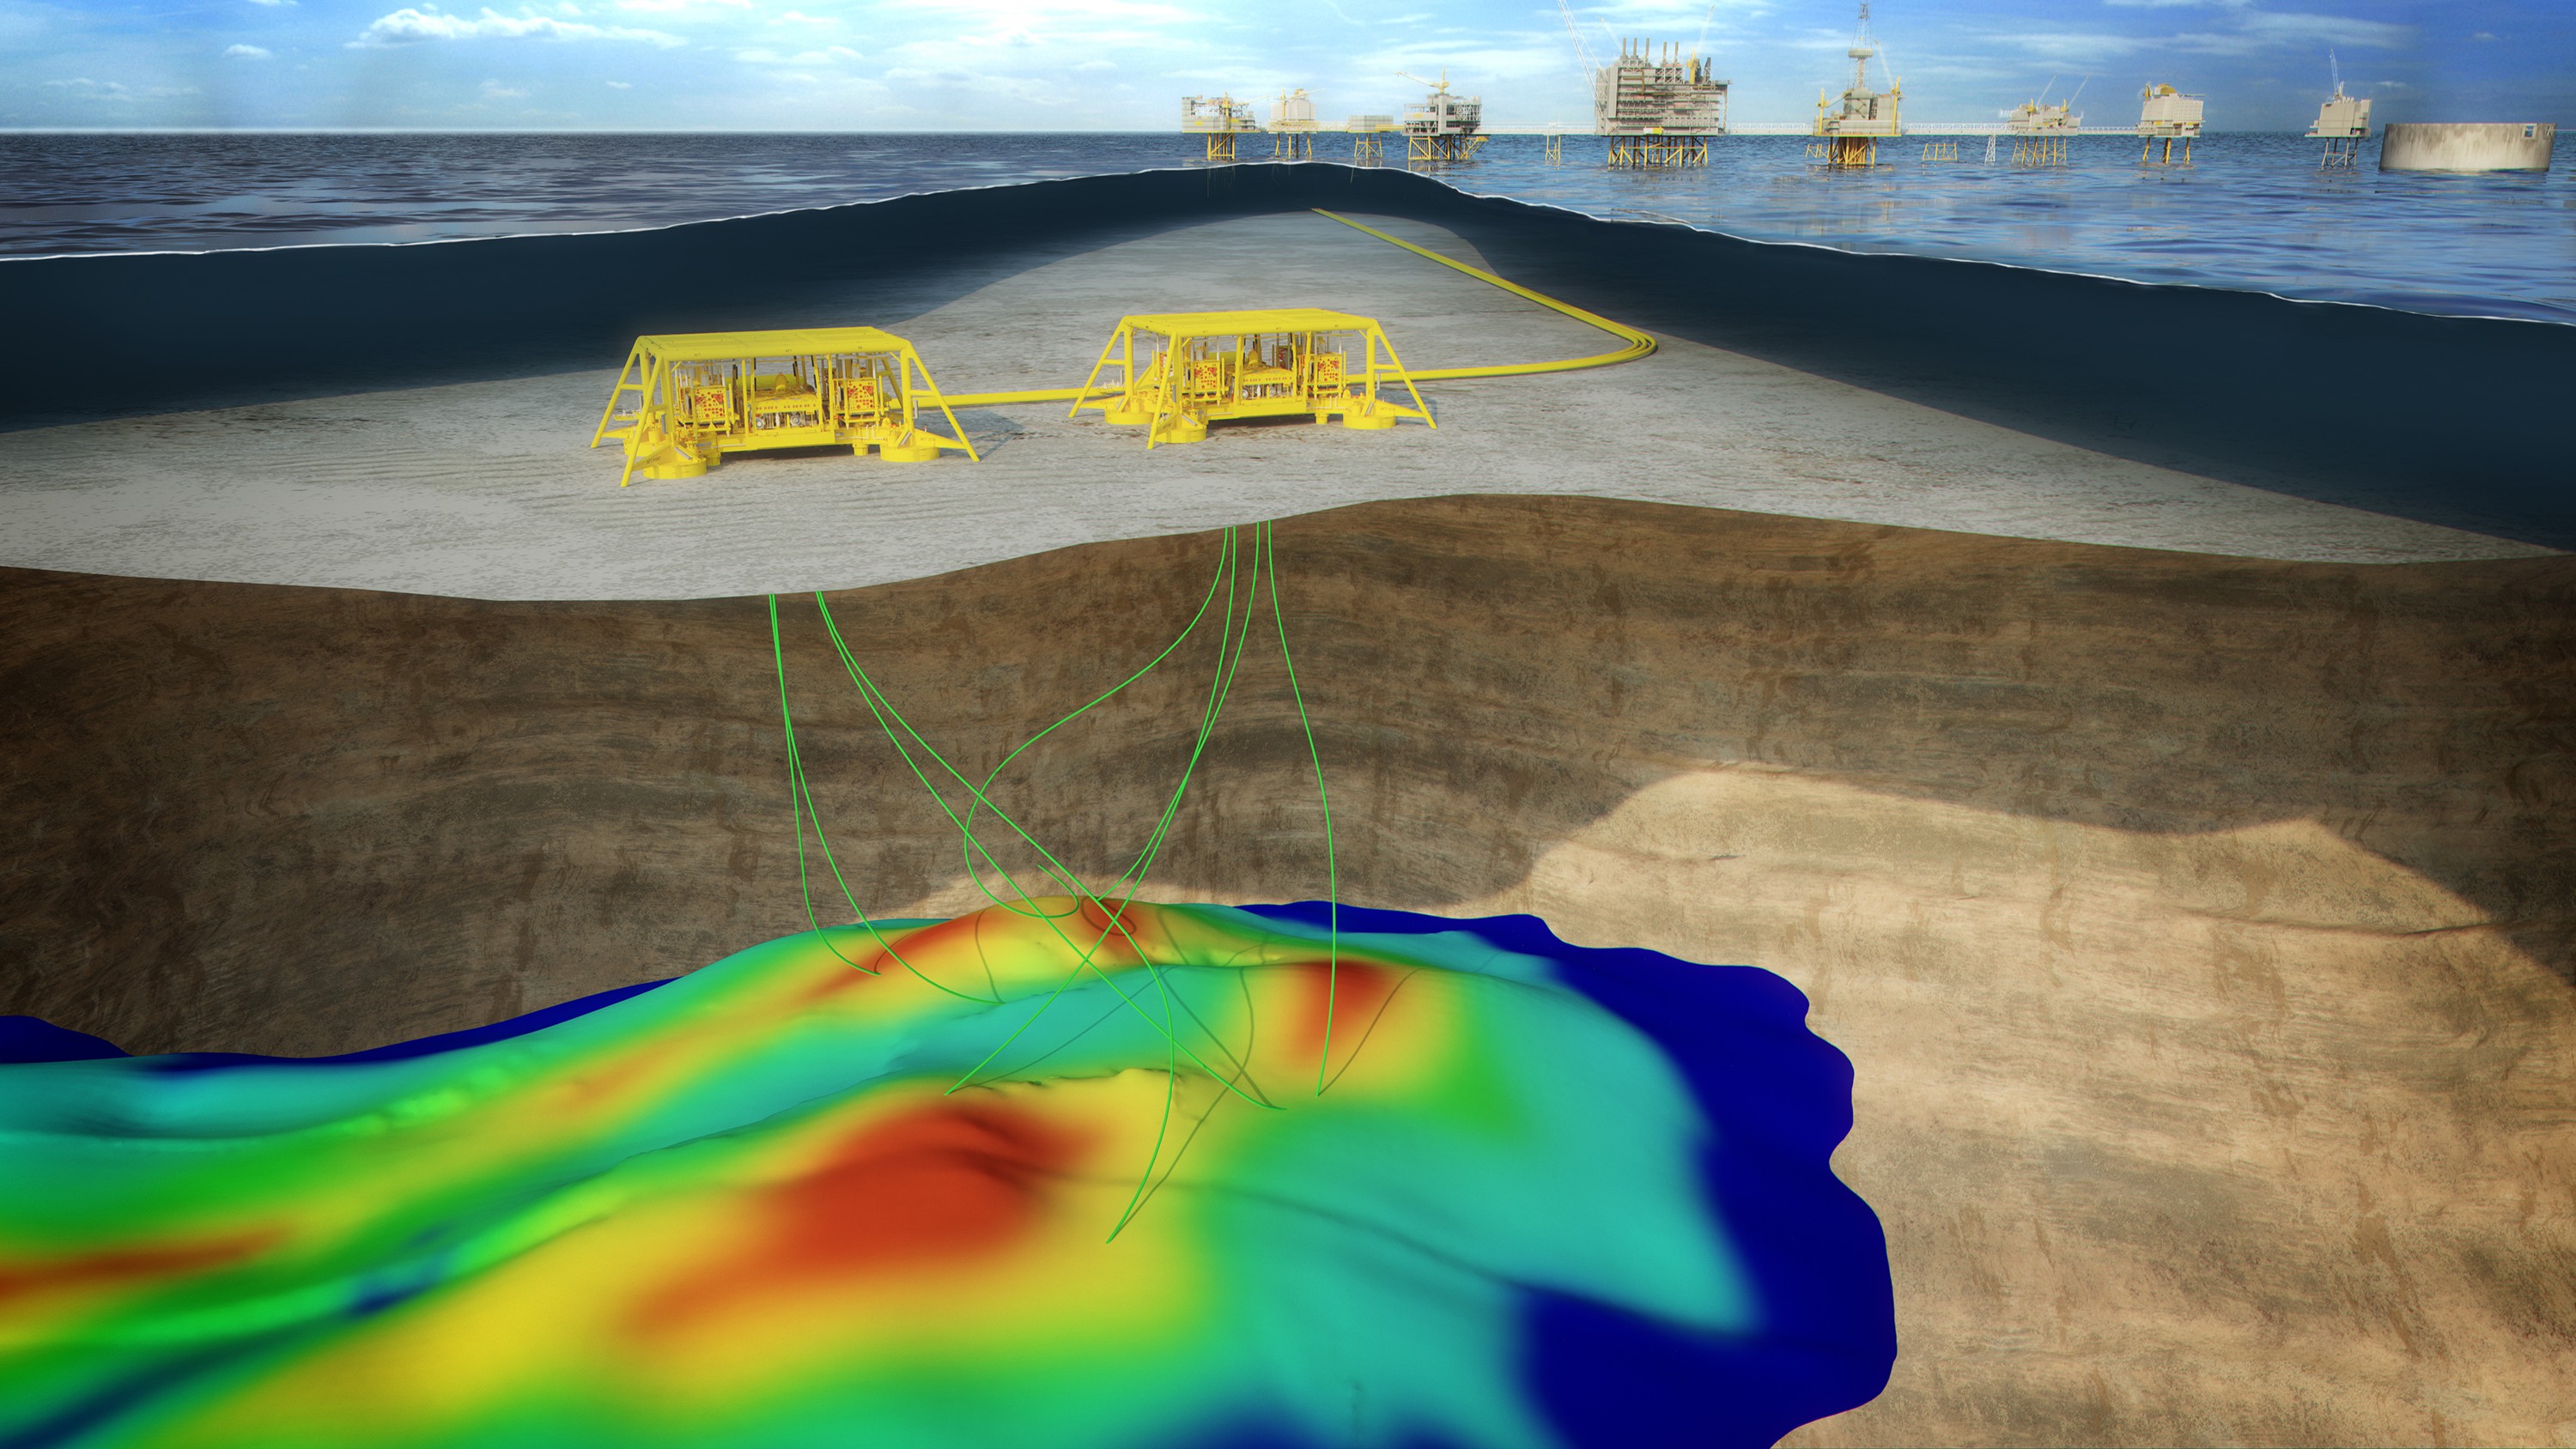
Figure 3.11 Tor 2/4 E. Tor II came on stream on 4 December 2020 from an SPS (Subsea Production System) tied back to the Ekofisk complex. Photo: ConocoPhillips
The experience has contributed to new redevelopments in the area. Albuskjell, Vest Ekofisk and Tommeliten Gamma, all of which were shut down at the end of the 1990s, are set to be developed as subsea installations tied back to the field centre on Ekofisk. In total, the projects may contribute around 14–19 million scm oe, with production planned to start in the period 2028–2029.
Development of resources in discoveries
The discovery portfolio on the NCS currently consists mainly of small discoveries. In total, the discovery portfolio contains 91 discoveries with a total of 526 million scm oe in contingent resources. The main picture is one of many smaller discoveries that are dependent on infrastructure with spare capacity in order to be developed. The largest discoveries are the 7324/8-1 (Wisting) oil discovery in the Barents Sea, the 6406/9-1 Linnorm gas discoveries in the Norwegian Sea and 35/2-1 (Peon) in the North Sea. Figure 3.12 shows all discoveries that have not yet been developed, categorised by size within each sea area.
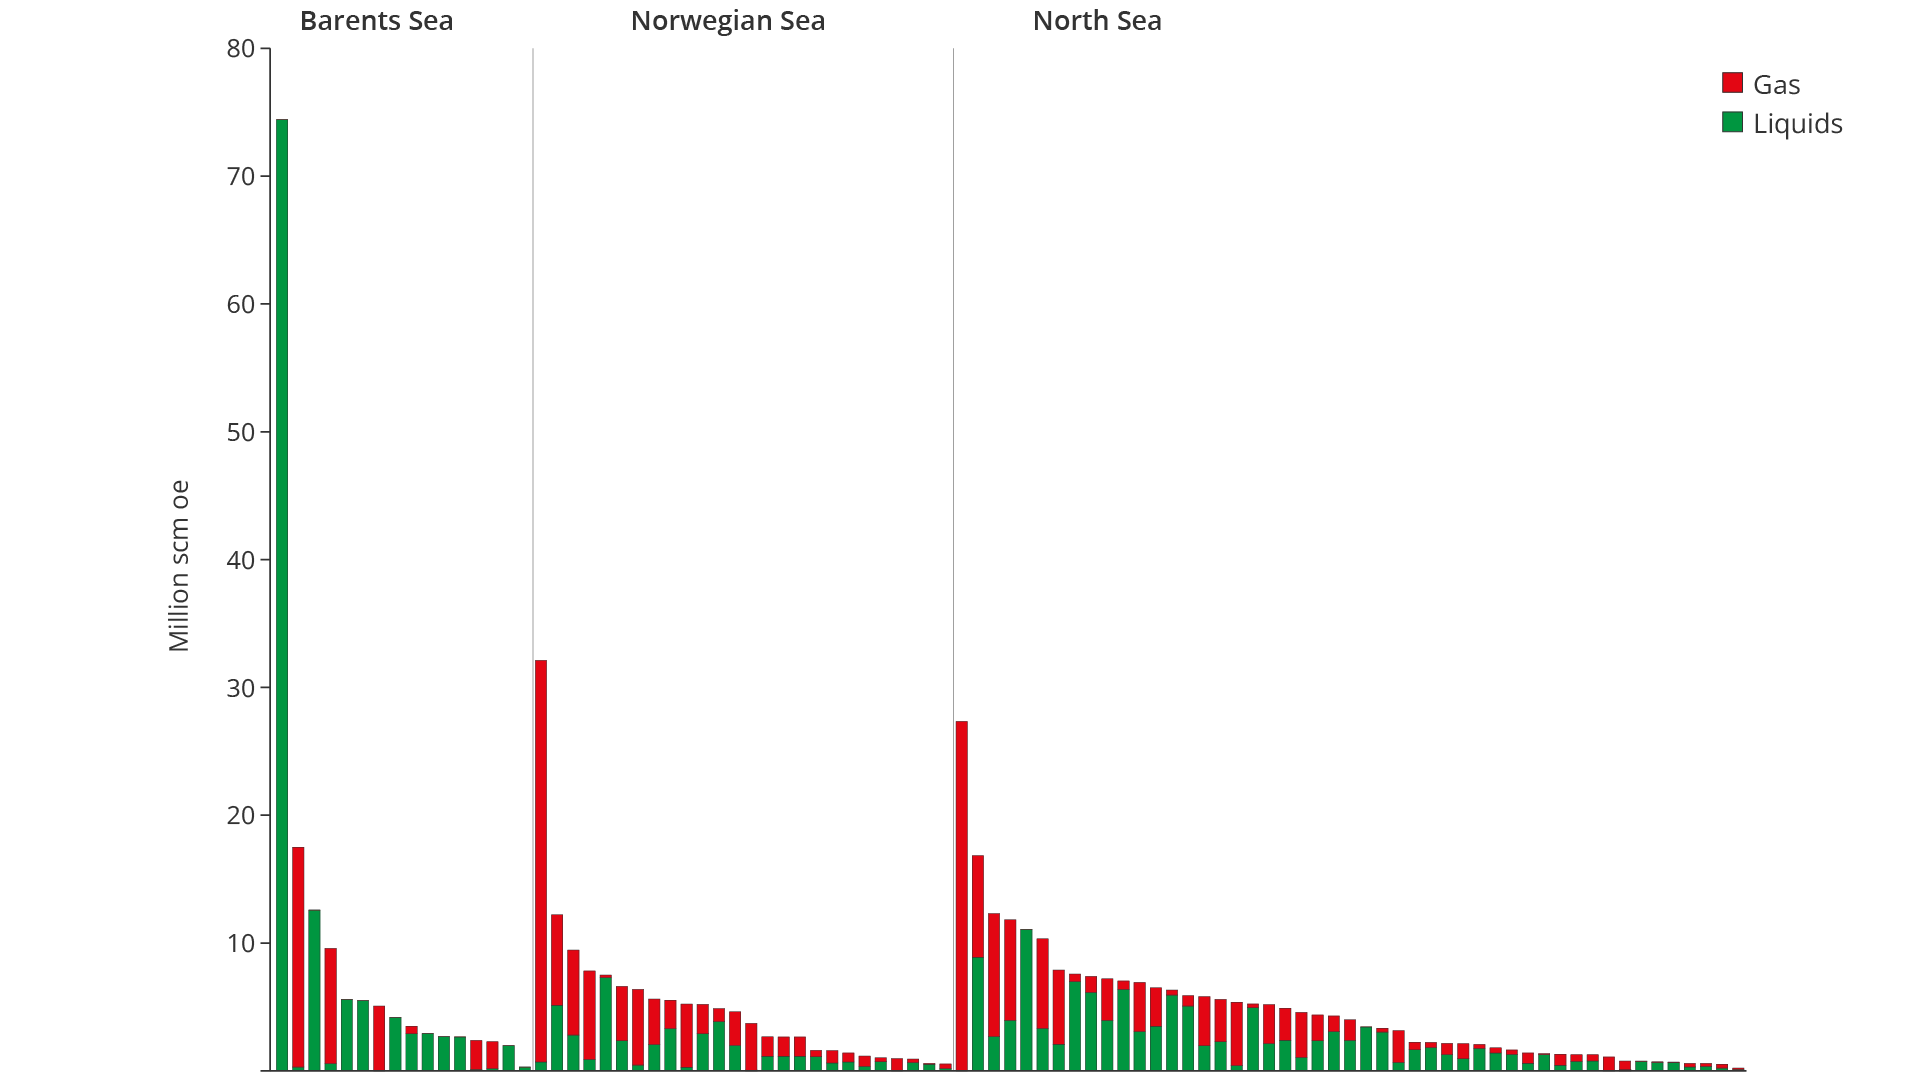
Figure 3.12 The discovery portfolio by sea area as of 31.12.2025
Development of discoveries
Profitable development of the current discovery portfolio largely requires tie-back to existing infrastructure, either as subsea developments or as wells from existing facilities.
Figure 3.13 shows that discoveries on the NCS are primarily planned to be developed as satellites tied back to existing fields.
Satellite developments result in lower investment costs than stand-alone developments and make it possible to recover resources that would otherwise have been unprofitable. This underlines the importance of access to existing infrastructure and spare capacity in host fields to be able to develop many of the small discoveries in the current portfolio.
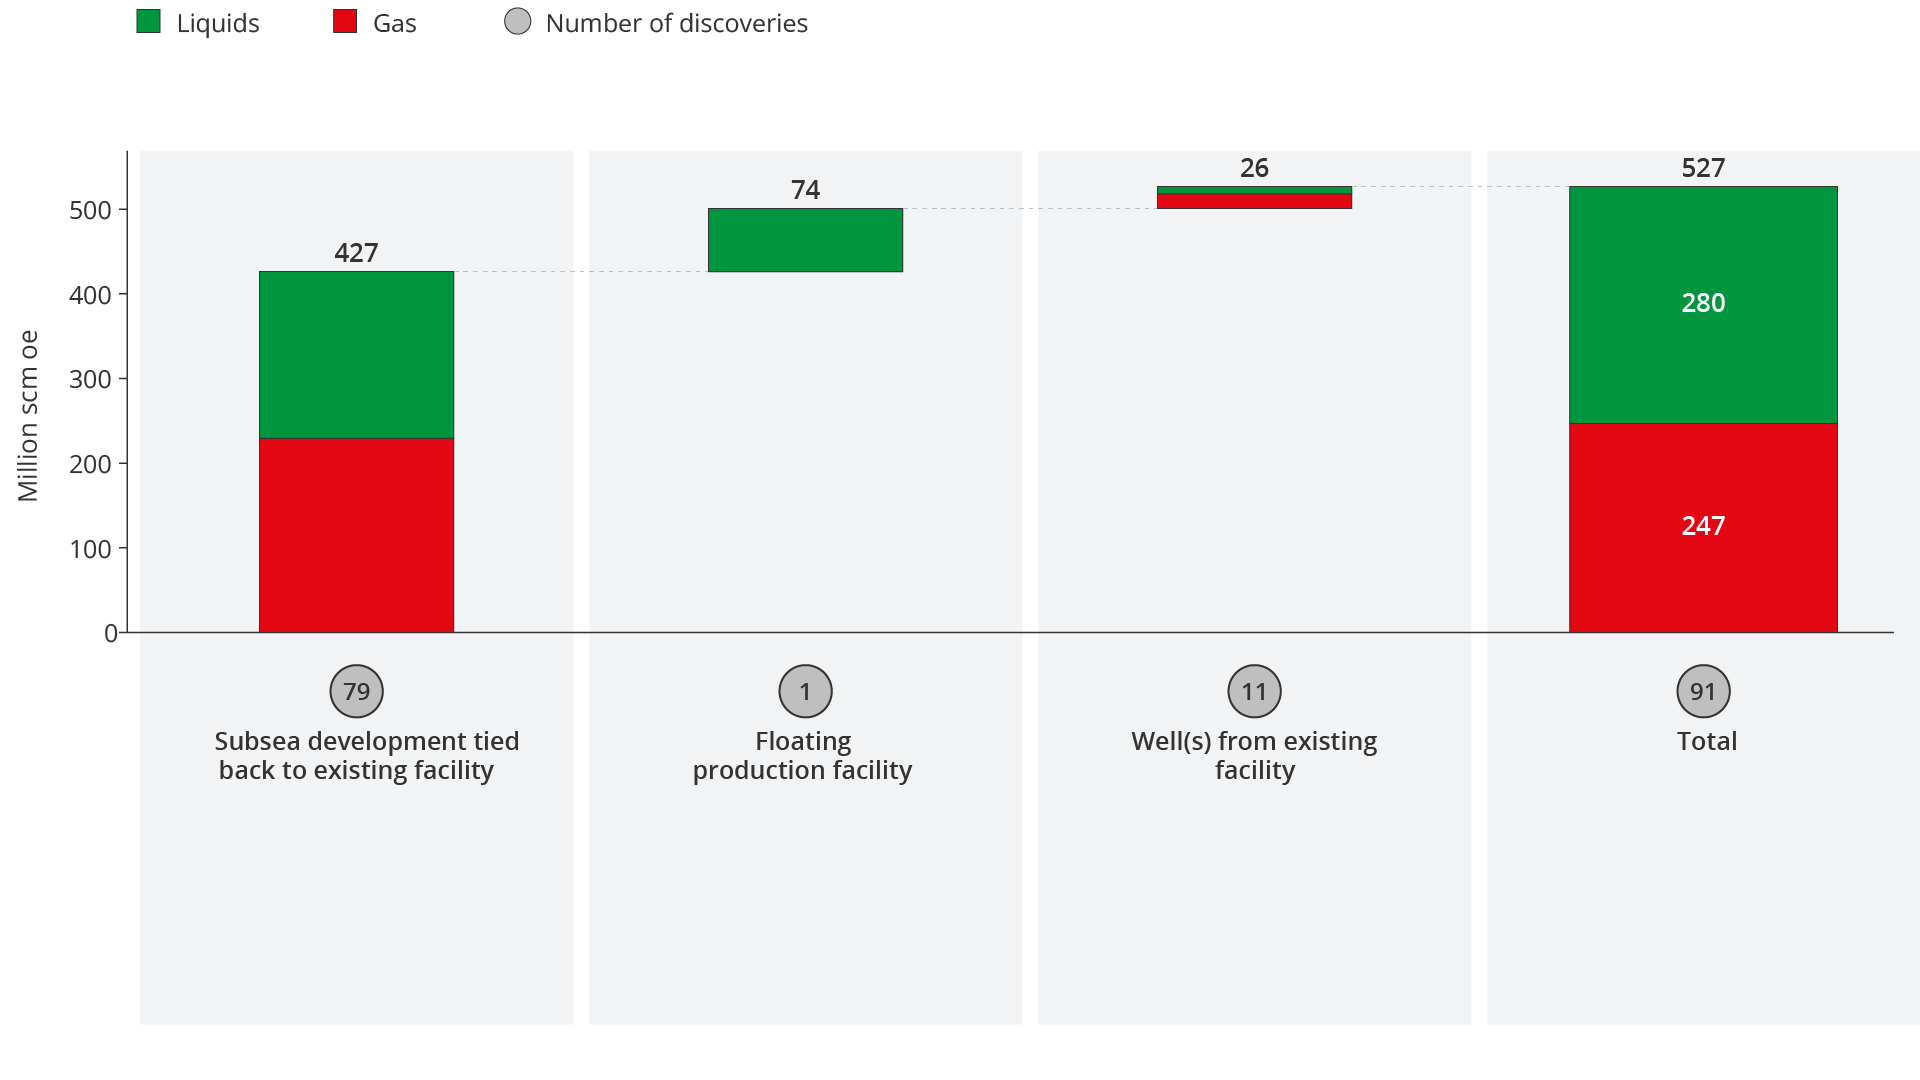
Figure 3.13 Possible development solutions for the development of discoveries
Figure 3.14 shows how tie-in of new discoveries can help lower unit costs and mitigate the decline in production from the host field. This can contribute to extending the lifetime of the field and provide incentives for further exploration in the area.
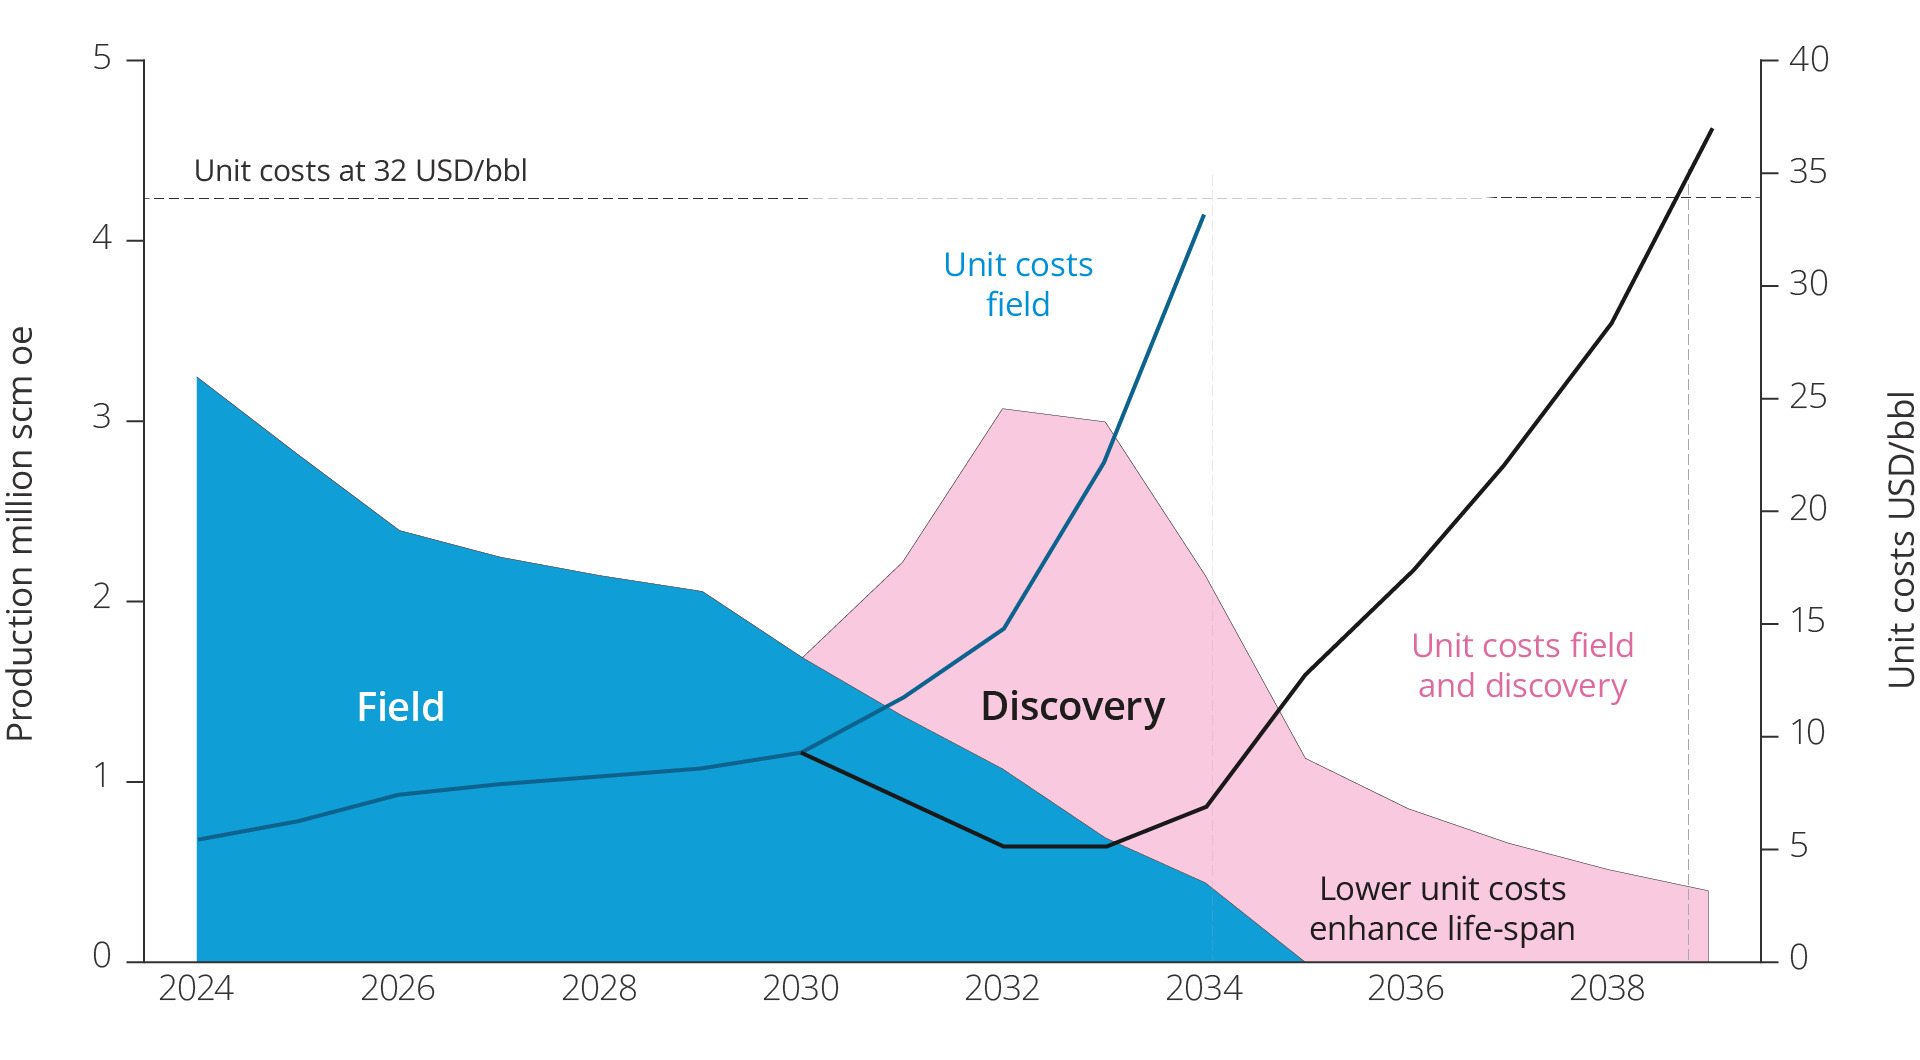
Figure 3.14 The example is taken from the NCS and demonstrates that new discoveries can help keep unit costs down
For subsea developments brought on stream in the period 2010–2025, lead times vary considerably (Figure 3.15). Lead time is defined as the time from discovery to production start-up. The figure shows how long it takes from when a discovery is made until it is in production, broken down into three phases:
- Dark blue: Time of discovery → concept selection (often the longest phase)
- Blue: Concept selection → approved development plan (PDO)
- Light blue: Approved development plan → production start
The most time-consuming phase is the period from discovery to concept selection, which takes an average of around 13 years. The second and third phases are generally shorter and more predictable. The lead time depends on discovery size, reservoir complexity, access to available infrastructure capacity and commercial maturation processes.
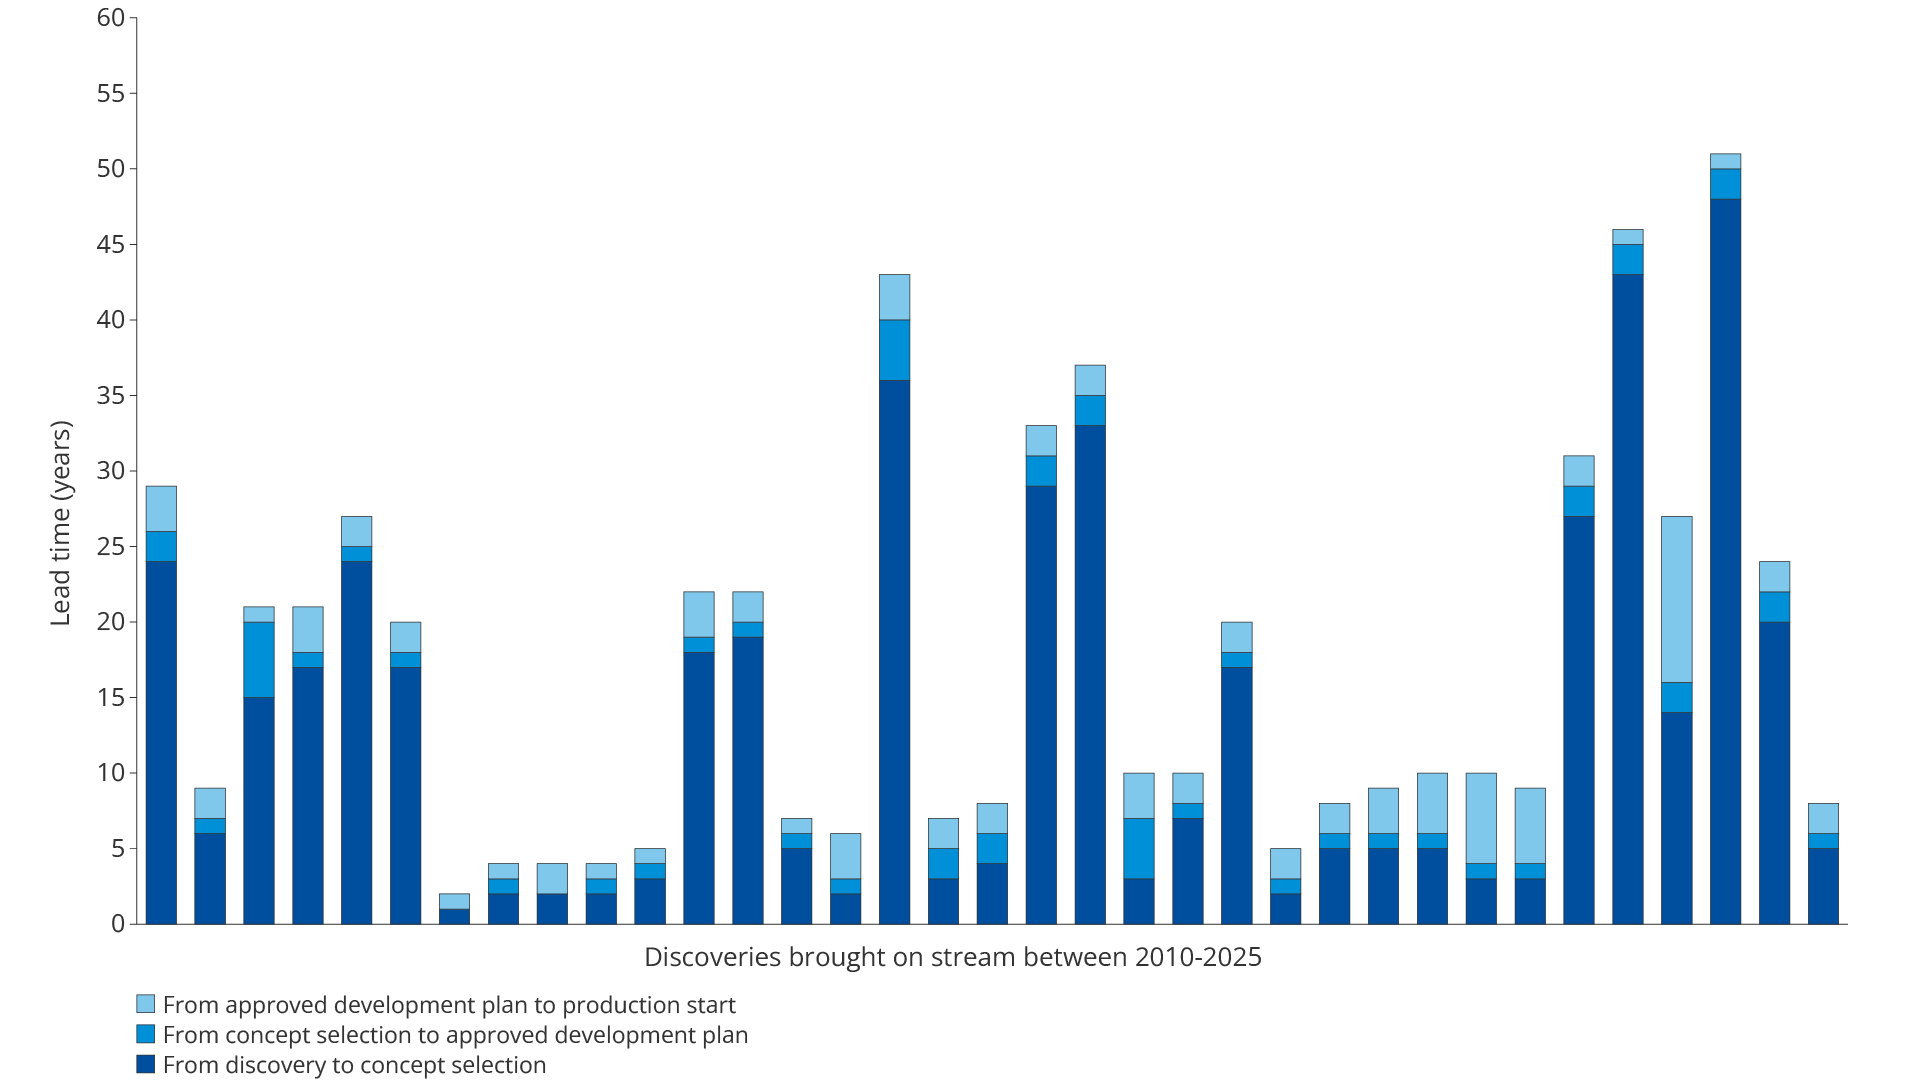
Figure 3.15 Lead time for the discoveries developed utilising a subsea solution and put on stream in the period 2010–2025
The longest lead times apply to discoveries having waited a long time for the right infrastructure, a sufficient resource base or the necessary technology maturity.
Lead time affects profitability via two mechanisms: increased capital tie-up, where discounting over a longer time horizon reduces the present value of future cash flows, and increased exposure to cost and price uncertainty.
The importance of lead time for profitability
A prospect with expected recoverable resources of 2.1 million scm oe is proven through an exploration well. A development decision with subsea facilities gives a total net cash flow of NOK 3.5 billion (dark orange column) at the time of the decision. With a two-year development period, this gives a net present value of approximately NOK 2 billion (light orange column).
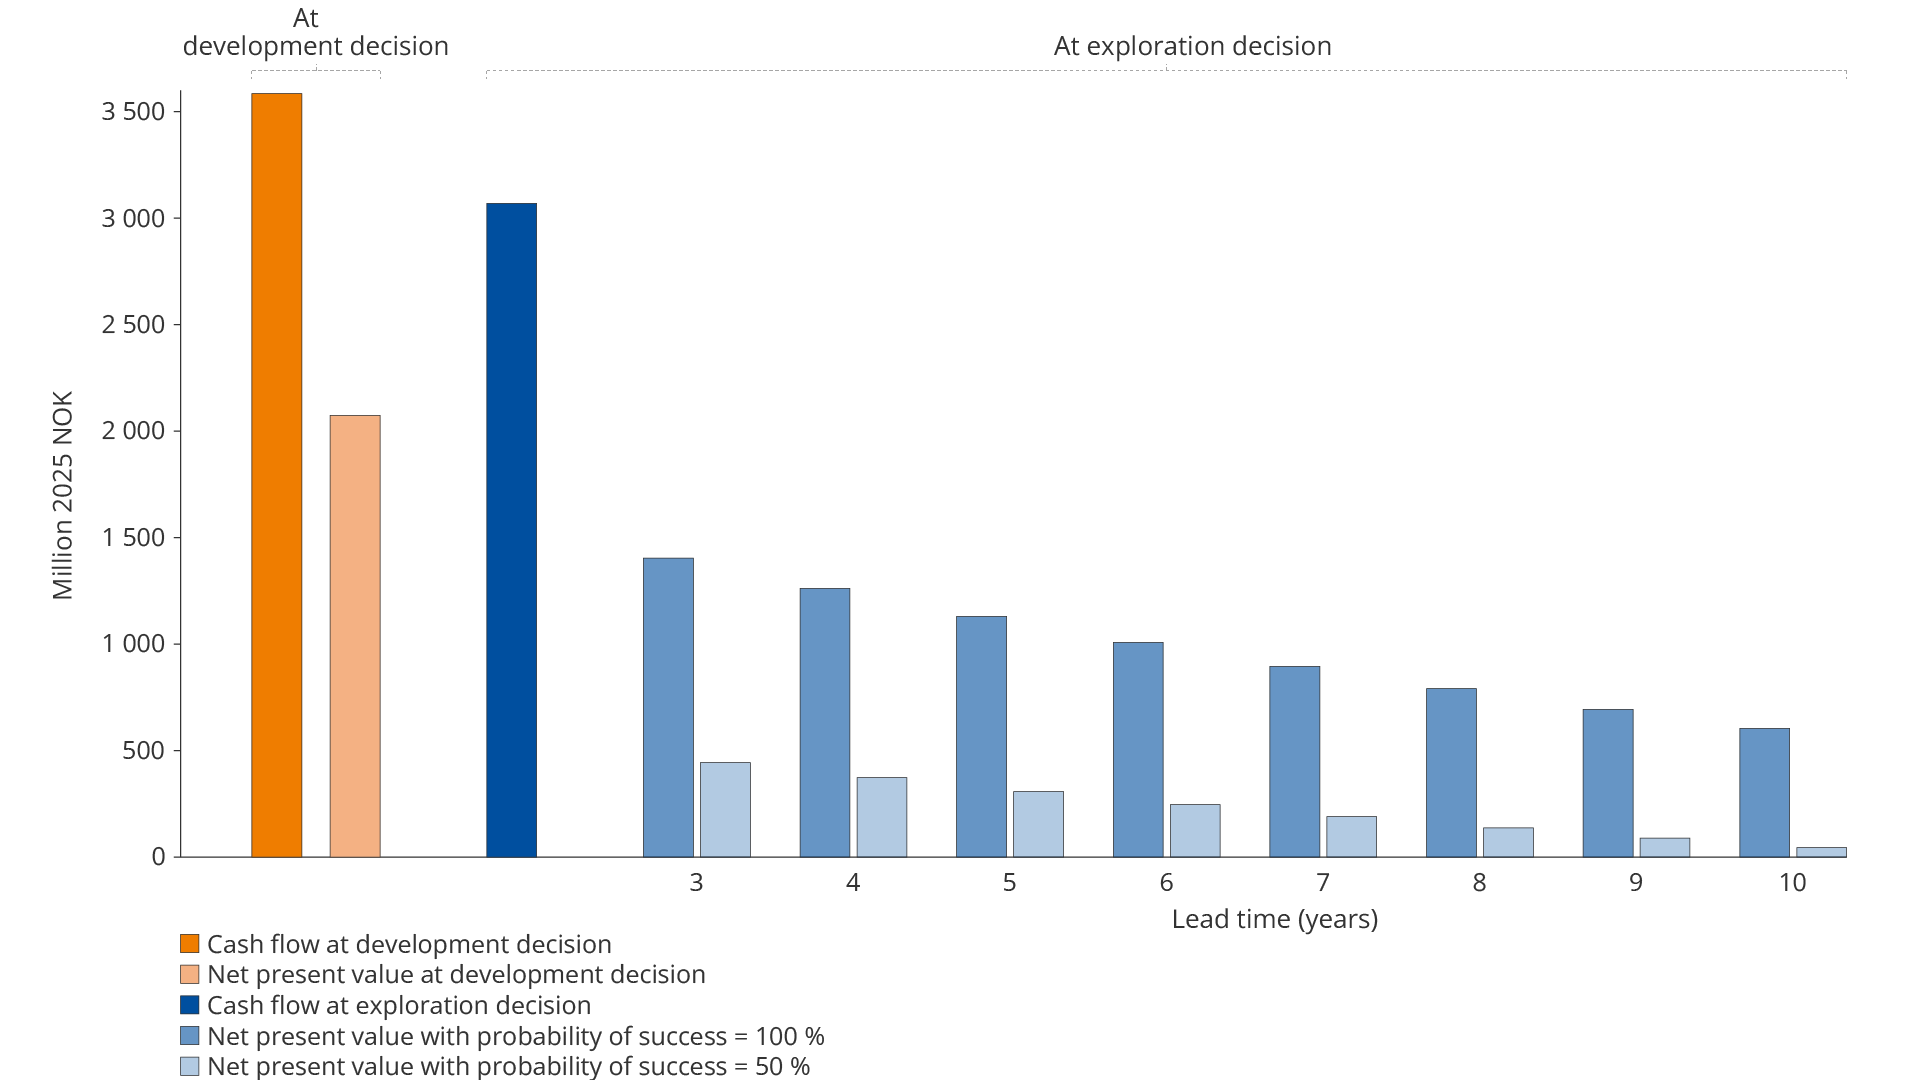
The value of the exploration well decision
When the analysis is moved back to the exploration well decision stage, the net cash flow is reduced to just under NOK 3 billion. The reduction is due to the inclusion of exploration costs (dark blue column).
Two factors further reduce profitability before the exploration well is drilled:
Lead time: A long time from discovery to production results in a lower present value because future cash flows are discounted by an interest rate of 8 per cent (medium blue bars). With a higher discount factor, the present value will be reduced further.
Probability of discovery: If the probability of discovery is reduced from 100 to 50 per cent, the expected present value is halved (light blue bars)
These conditions give an expected net present value of less than NOK 500 million with a three-year lead time, and less than NOK 100 million with a ten-year lead time.
Projects that appear profitable at the development decision stage may be marginal or unprofitable at the exploration well decision stage.
Long lead times, low probability of discovery and high yield requirements pull in the same direction and weaken the incentives for exploration. Shorter lead times may mean that more discoveries can be developed profitably.
Future tie-backs and joint development
The licensees can already in the development phase facilitate future tie-backs, for example through over-dimensioning of control cables and the establishment of tie-in points for new subsea templates. Over time, this can lay the foundation for coordinated area development, where several accumulations are connected to a common solution.
The Alvheim field is a good example of successful area development (see fact box). Such solutions require that the initial development is robust and sufficiently flexible to bear its own costs and facilitate subsequent tie-backs.
Resource development in the Alvheim field
The Alvheim field, located in the central part of the North Sea, demonstrates how long-term area development can result in significantly more production than originally planned. The production increase is due to both higher recoverable resources in the field itself and tie-back of several third-party fields which have contributed new volumes.
The potential in the Alvheim area has still not been fully exploited. A further increase in total production can occur through measures to improve recovery and develop new nearby fields, based on existing infrastructure and shared solutions.
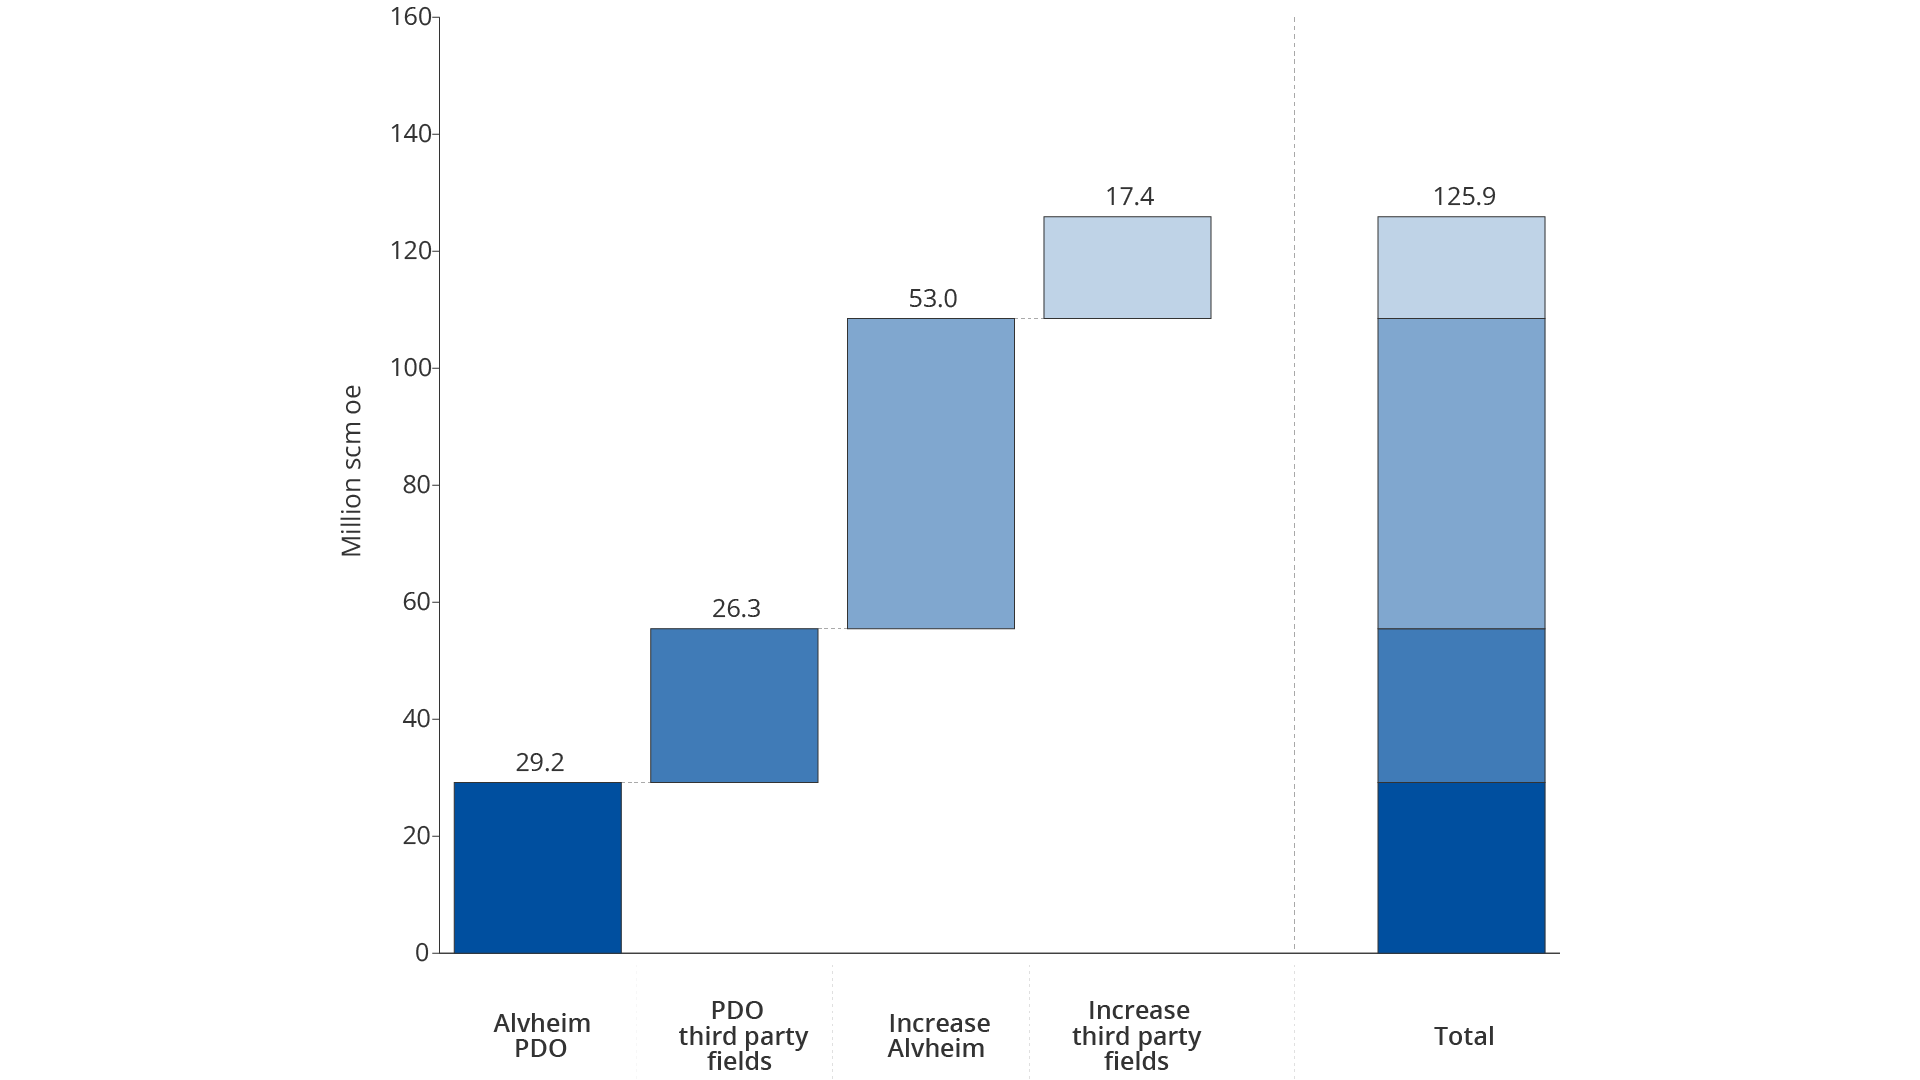
The figure shows resource development in the Alvheim area.
Since the oil price drop in 2014/2015, the companies have set stricter requirements for the development of discoveries, including choice of development solution. This has weakened the incentives to invest in additional capacity(14) .
Joint development of several accumulations is often necessary to achieve sufficient profitability. Joint pipelines and control cables, sharing of modification costs on the host field and coordination of drilling and marine operations result in lower total investment costs than separate developments. Such solutions range from integrated area developments, such as Yggdrasil, to simpler concepts where one production well with multiple wellbores reaches separate accumulations.
However, achieving economies of scale through joint development requires that all parties are willing to invest and share benefits.
Fragmented ownership can make coordination challenging, because it requires agreement between players with different interests, time horizons and cost structures. A balanced ownership distribution results in convergence of interests in recovery and capacity utilisation and reduces the need for special allocation agreements.
At the same time, increased consolidation may exacerbate conflicts of interest related to third-party access, because fewer companies control a larger share of the infrastructure. Section 4-7 of the Petroleum Act(15) gives the authorities the possibility to impose coordination when it is clearly rational to do so to ensure sound resource management.
Fast-track development process
Shorter lead times from discovery to production can contribute to increased value creation. More resources can then be realised within the lifetime of the host field, whilst simultaneously extending production.
The industry is working on several specific measures to compress the planning and execution time(16), so-called fast-track developments. This includes simplified development solutions, standardised concepts and closer cooperation between exploration, development and operations environments.
Since most discoveries today are relatively small, and there is often only one relevant host facility, in-depth multi-year concept phase studies are rarely appropriate. Fast-track developments are therefore not only a cost-reducing measure, but also a value-adding measure directly affecting which discoveries can be developed profitably.
Key measures:
- Standardization and early investment in subsea equipment. Standardised specifications and component inventory management with long lead times can reduce both procurement time and costs.
- Merging milestones in the concept selection phase. When options are limited, planning and activities can be carried out more quickly to reduce the time to decision.
- Keeper wells. Exploration wells can be planned and dimensioned from the start as future production wells, so that the exploration and development phases partly overlap.
Merging planning milestones can involve, inter alia:
- Carrying out activities in parallel which are normally sequential. For example, drilling and installation of subsea equipment can be planned in parallel with the completion of the concept selection, instead of waiting for final PDO approval.
- Merging decision points. Milestones which are normally separate can be merged or shortened when there is only one relevant host facility and one realistic tie-back solution.
- Re-use and pre-decisions. Standardised and pre-procured subsea equipment can be ready before the discovery is matured, and keeper wells allow exploration and development decisions to overlap in time.
Fast-track developments must be weighed against the need for prudent area solutions. What is profitable for one discovery is not always the best option for overall resource utilisation in an area.
Prudent area solutions require coordination over time between operators, licensees and infrastructure owners. Such processes cannot always be accelerated.
Fast-track developments should therefore be a supplement to, not a substitute for, integrated area planning. The scheme is best suited to small discoveries with simple solutions, and less suited to large and complex developments.
Interdependence between discoveries, fields and infrastructure
The close interdependence between fields and infrastructure means that individual decisions can have major consequences for entire areas.
In well-explored areas, fields, discoveries and infrastructure are closely linked. When a field shuts down, process plants can lose so much oil and gas that further operation is no longer profitable. This in turn could threaten the lifetime of infrastructure upon which other fields and discoveries depend, thereby amplifying the production decline in the area (17) (Figure 3.16).
Since the infrastructure ties fields and discoveries together, it is not sufficient to assess shutdown based on the individual field's economics alone. Overall consequences for entire areas must be incorporated into the decision-making. Long-term and viable infrastructure is a prerequisite for active resource management.
Interdependence also means that passivity has a cost. Decisions on processing plants and pipelines affect which resources can be developed over time. Coordinated planning across fields and operators, applying an area and shelf perspective, is necessary to avoid infrastructure lifetime limiting resource extraction earlier than necessary.
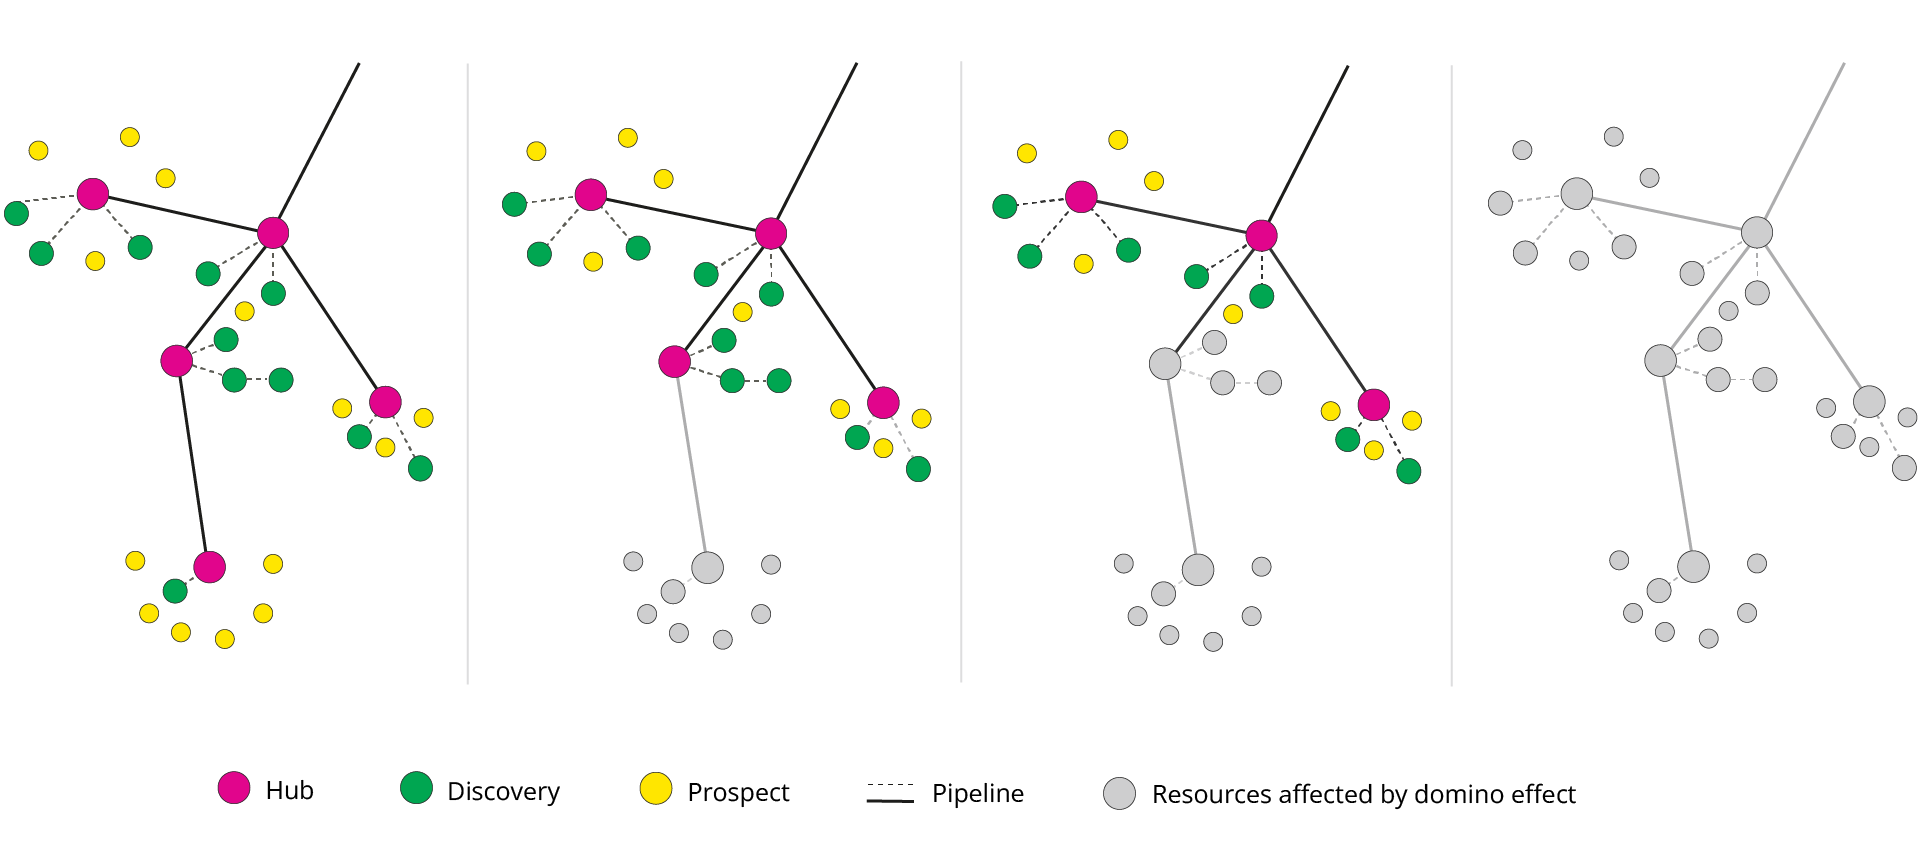
Figure 3.16 Interdependence and the domino effect
Development of resources in tight reservoirs
Tight reservoirs have such low permeability that oil and gas do not flow to the well at sufficient rates. Producing from such reservoirs requires technical measures that increase the flow and make the resources available.
There are large quantities of oil and gas in tight reservoirs on the NCS, both in discoveries and in fields. Figure 3.17 shows mapped oil and gas volumes in place in such reservoirs with associated uncertainty ranges. Despite a significant resource base, several of the discoveries have still not been developed, and tight reservoir zones in producing fields remain undrained.
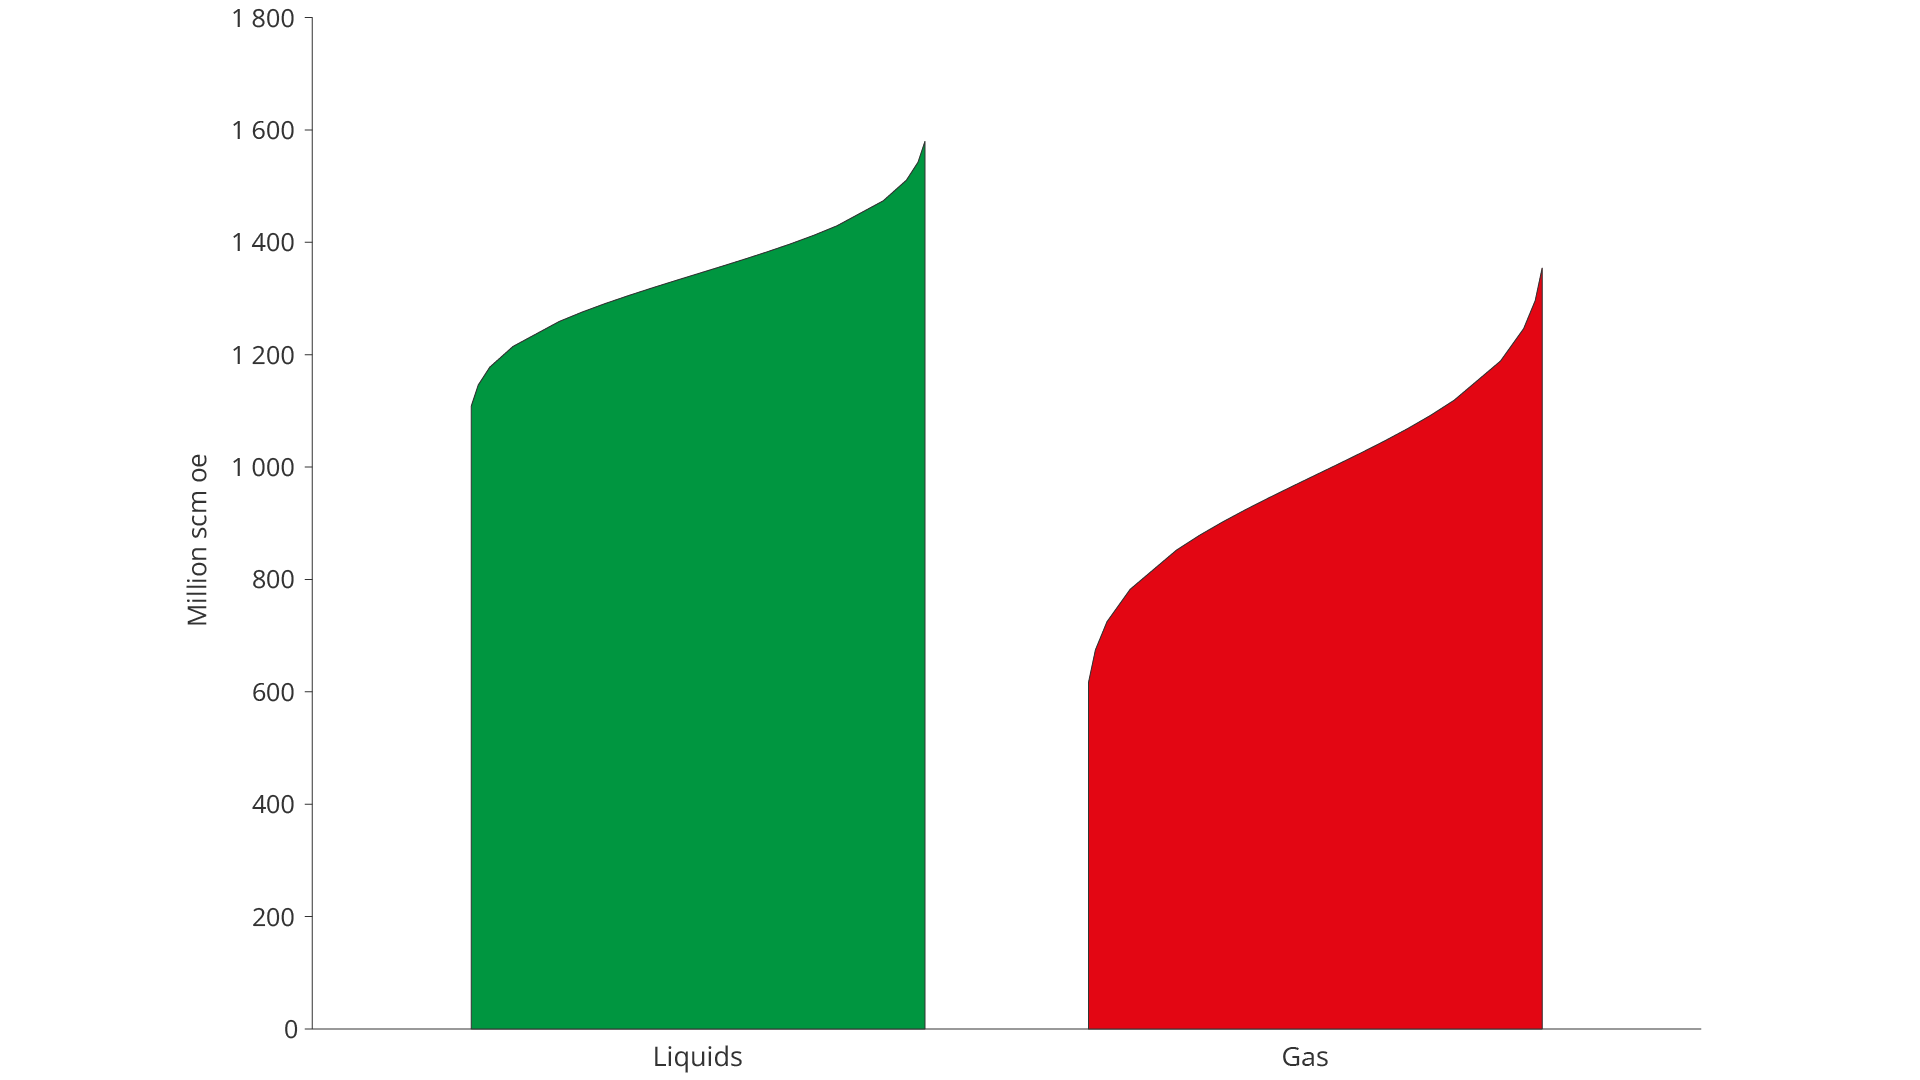
Figure 3.17 Mapped resource potential (resources in place) in tight reservoirs divided into liquids and gas. Uncertainty in the total estimates is illustrated by a low estimate (P90) to the left and a high estimate (P10) to the right in each bar.
Tight reservoirs are challenging to produce from. They result in low flow, high technical risk and the need for expensive solutions, all of which weakens profitability.
Hydraulic fracturing, slim-hole drilling, fishbone drilling technology and coiled tubing drilling can increase the contact surface between well and reservoir and result in higher production. Such measures can make development profitable in discoveries that would not otherwise have been developed.
Development of resources in tight reservoirs is time critical. Profitable development requires tie-back to existing infrastructure before it is taken out of operation. Once infrastructure is decommissioned, costs increase significantly. The resources can then be left without a commercial solution.
Early planning, cooperation between companies and the use of advanced technology increase the likelihood of successful production from tight reservoirs within the technical lifetime of the infrastructure.
Victoria is a large and challenging gas discovery
The 6506/6-1 (Victoria) discovery in the Norwegian Sea was made in 2000 and is one of the largest gas discoveries yet to be developed. Estimates show that the discovery may contain 140 billion scm of gas resources in place. The discovery is located at a depth of approximately 400 metres, and the gas is located approximately 4,800 metres below the seabed.
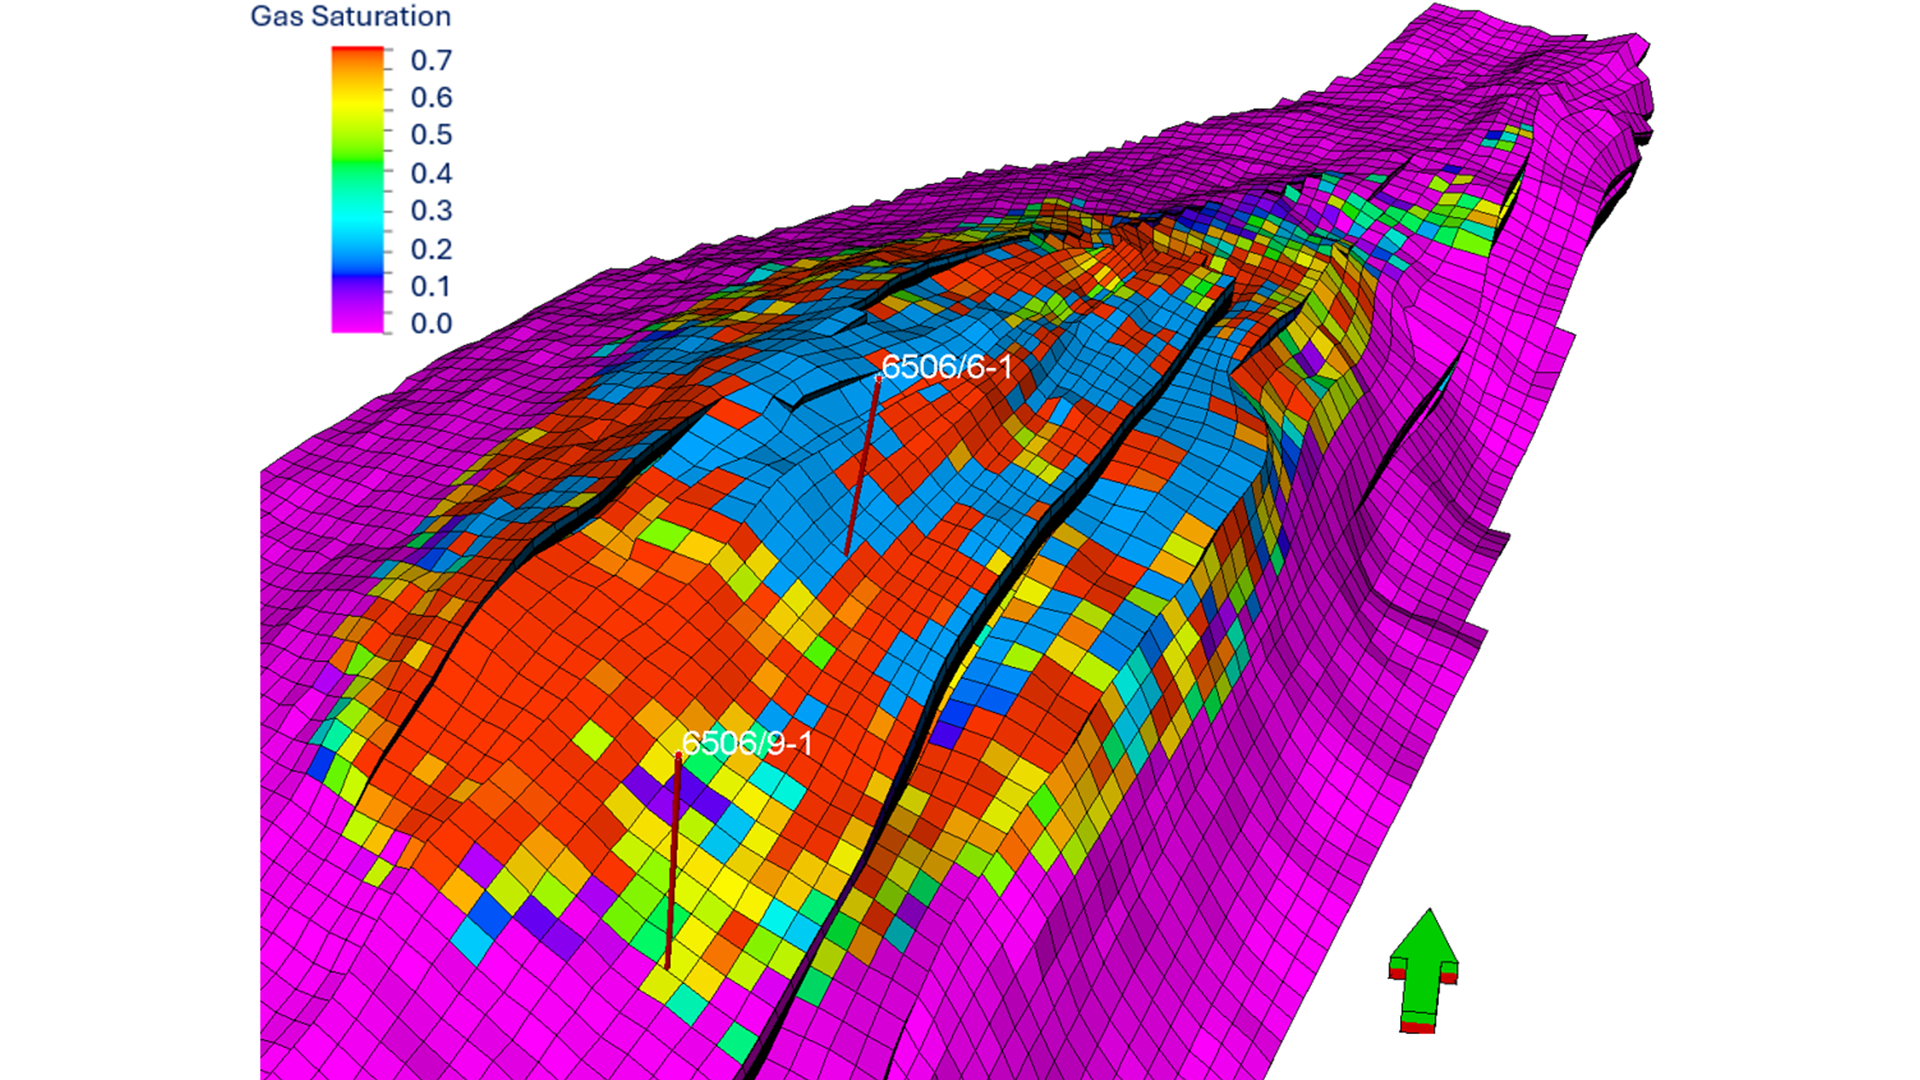
The figure shows a simulation model of the Victoria reservoir with large variations in gas saturation. The colours illustrate uneven distribution, indicating low permeability and limited communication between the reservoir zones. The map shows the Victoria discovery's position in the Norwegian Sea.
Recovery from Victoria is challenging because the reservoir is tight with high pressure, high temperature and high CO₂ content. These conditions have previously rendered development unprofitable. However, recent studies show that technology can pave the way for the development of the discovery. Using today's well technology, combined with hydraulic fracturing, it is estimated that around 29 billion scm of gas can be recovered.
Potential development is time critical. Nearby infrastructure, such as the Heidrun and Åsgard facilities, provides good tie-back opportunities, but only for as long as these facilities are in operation (2045–2050).
Exploration
In this chapter:
- Exploration is crucial
- Exploration activity between 2000 and 2025
- Near-field exploration
- New technology increases the value of a unique database
- Great opportunities in underexplored areas
- Unopened areas – a sea of opportunities
- Profitability of exploration 2000–2025
Exploration is crucial
Production on the NCS is in decline as the large fields mature and deplete. As production declines, a significant proportion of the expected production up to 2050 must come from future discoveries. To ensure sufficient resource growth, it is therefore necessary to follow two parallel tracks in the exploration industry (see fact bocx).
Well-explored and underexplored areas
Well-explored areas have a sufficient knowledge base established on seismic, well data and documented discoveries, as well as the most significant plays to be tested. Uncertainty about the resource base is therefore relatively low compared with the original potential. The delimitation refers to how much information there is, seen in relation to the geological complexity of the area.
Underexplored areas are areas where exploration activity has been low in relation to the assumed geological potential.
The first track is swift and efficient near-field exploration This extends the life of existing infrastructure and contributes to production in the coming decades. The second track is targeted exploration in underexplored areas, where the potential for large discoveries is greatest. Both tracks are necessary to support future production.
Exploration activity between 2000 and 2025
Exploration activities on the NCS in the period 2000–2025 have been crucial to maintaining a high production level. New discoveries have added resources which counteract the decline in production from mature fields, and a significant proportion of future production will come from resources proven during this period (Figure 4.1).
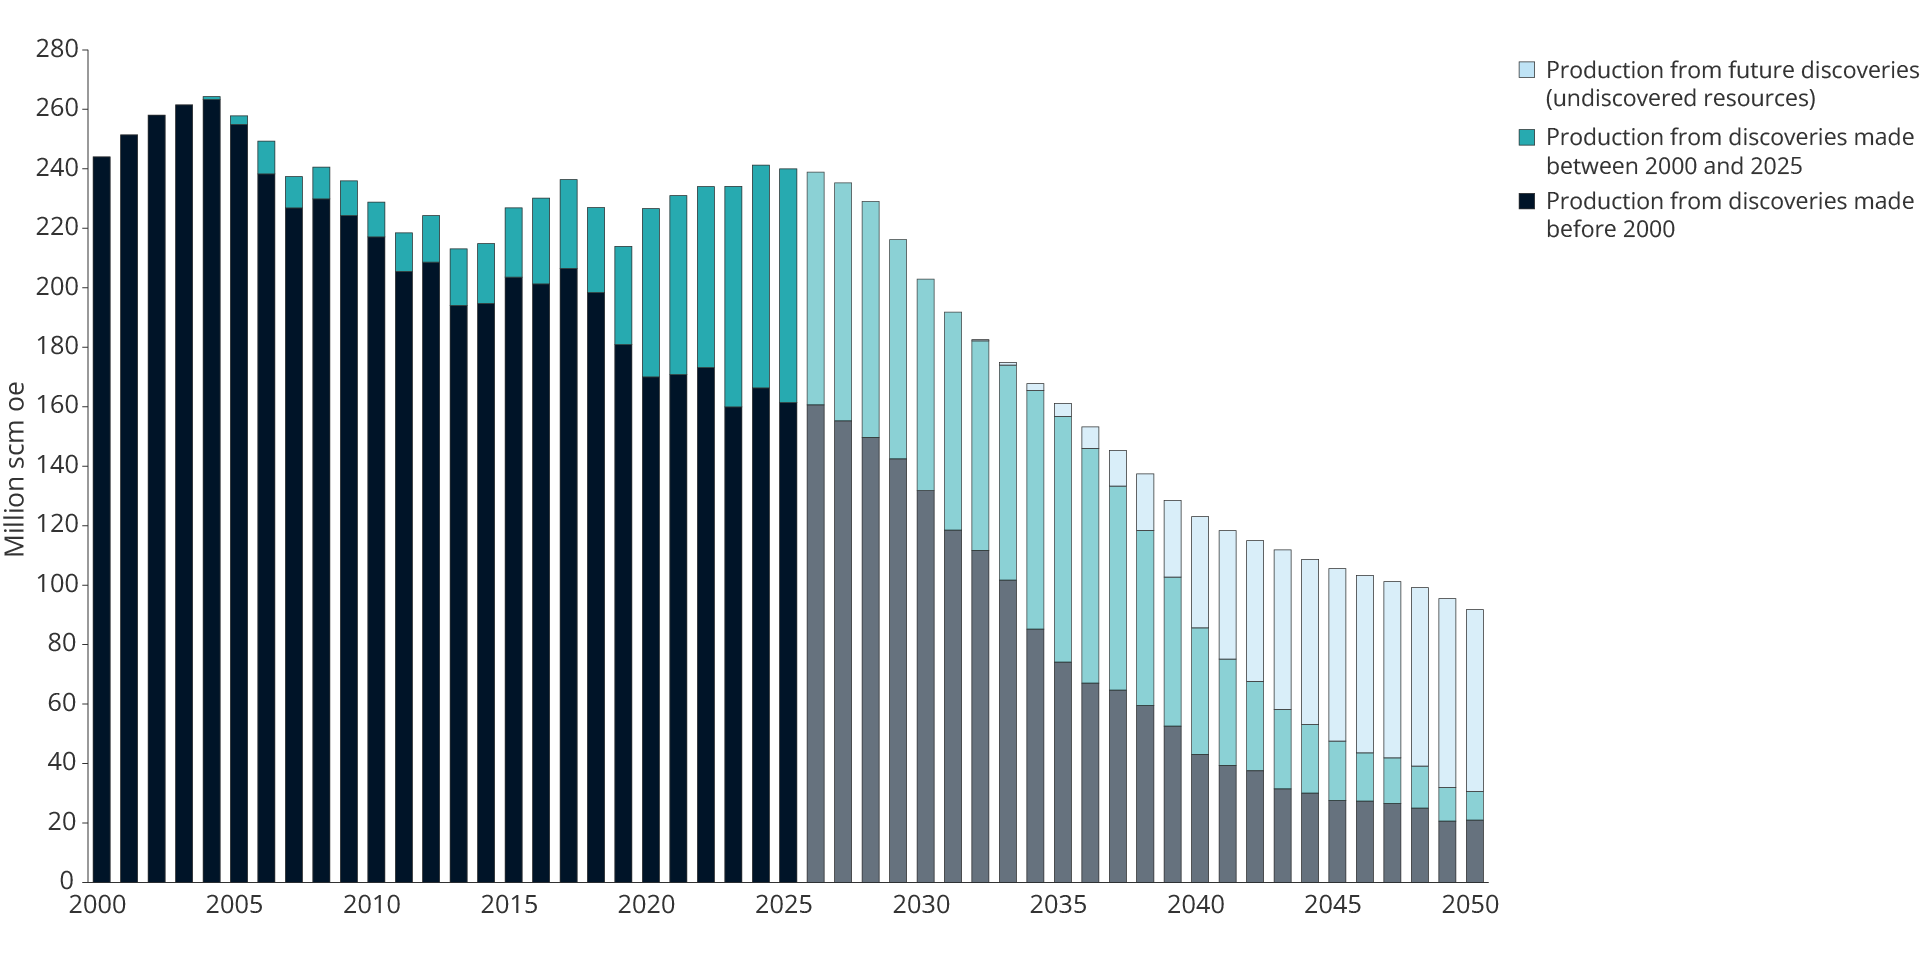
Figure 4.1 Production contribution from discoveries made during different periods
Oil prices have been the single most important factor for developments in exploration activity throughout the period (Figure 4.2). The relationship between price levels and activity is well documented. At the same time, the overall picture shows that exploration activity is also affected by other factors, including framework conditions, access to prospective acreage, the player landscape and the companies' assessment of future prospects and strategies.
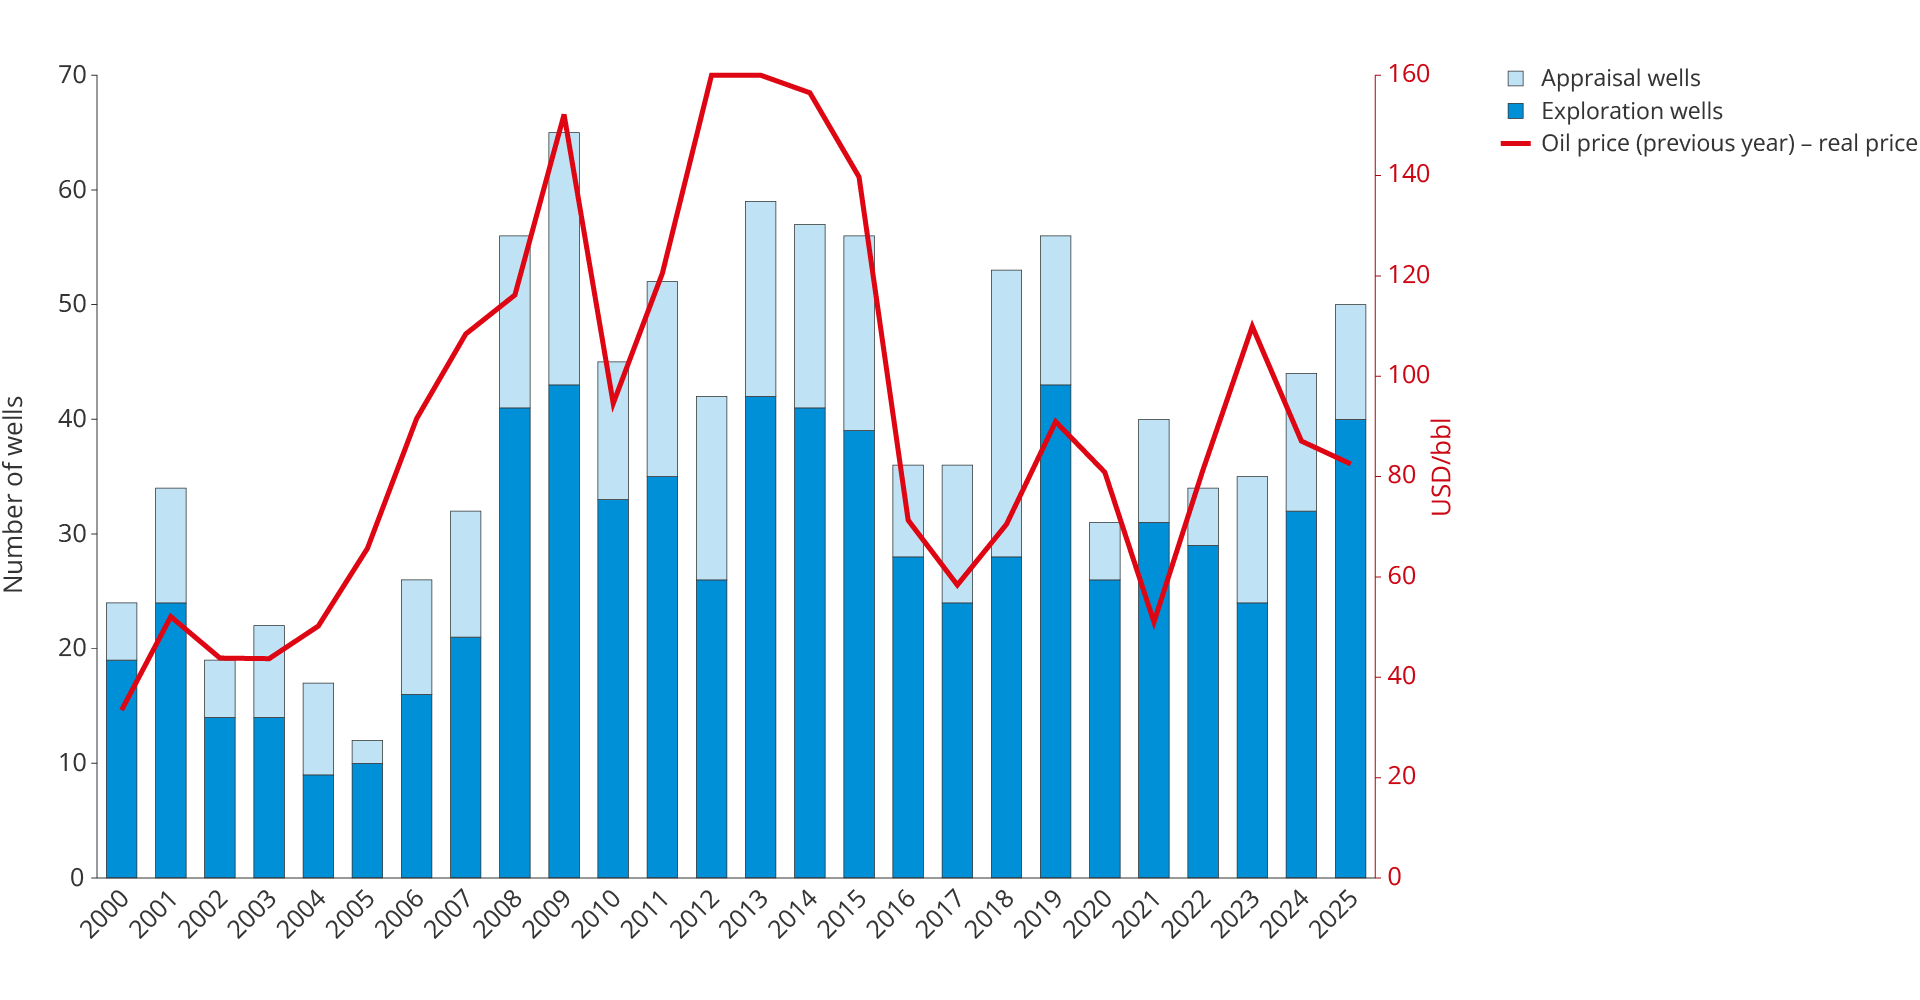
Figure 4.2 Number of spudded exploration wells per year and oil price (previous year)
The government measures implemented in the early 2000s, including the Awards in Predefined Areas (APA) scheme, prequalification and the exploration reimbursement scheme, lowered the entry barriers and helped attract new and smaller companies to the NCS (see fact box).
Measures for more exploration
In the period 2000–2005, the authorities implemented three measures to lower entry barriers and attract more companies to the NCS.
The prequalification scheme (2000) gives companies the opportunity to assess whether they are suitable for participation on the NCS before they commit resources to specific applications. The scheme reduces the threshold for new players and has received great support since it was introduced.
Awards in predefined areas, APA (2003), were introduced as a supplement to numbered licensing rounds to circulate exploration acreage in mature areas. APA replaced the North Sea awards in 1999, 2001 and 2002. Acreage returned by one company becomes available to other companies with innovative ideas. The scheme ensures that active exploration is carried out and that acreage is not left unused.
The exploration reimbursement scheme (2005) gave companies still without taxable income from the shelf the right to be reimbursed 78 per cent of their exploration costs. Companies with taxable income obtained the same tax benefit through ongoing deductions. The scheme ensured equal tax treatment and removed a significant financial barrier for new and smaller companies. The scheme has been discontinued and replaced by cash flow tax in 2022.
The effect of the government measures extended far beyond what oil prices alone can account for. These measures contributed to the extraordinary exploration period from 2005–2014, characterised by an extremely high level of activity, a wide spectrum of companies and major discoveries, including the Johan Sverdrup and Johan Castberg fields.
The drop in oil prices in 2014–2015 was a turning point. Exploration investment was halved and has since remained at a lower level (Figures 4.3 and 4.4). The decline post 2015 was due to fewer companies, lower activity and a lower cost level, partly due to a significant fall in day rates for the lease of drilling rigs.
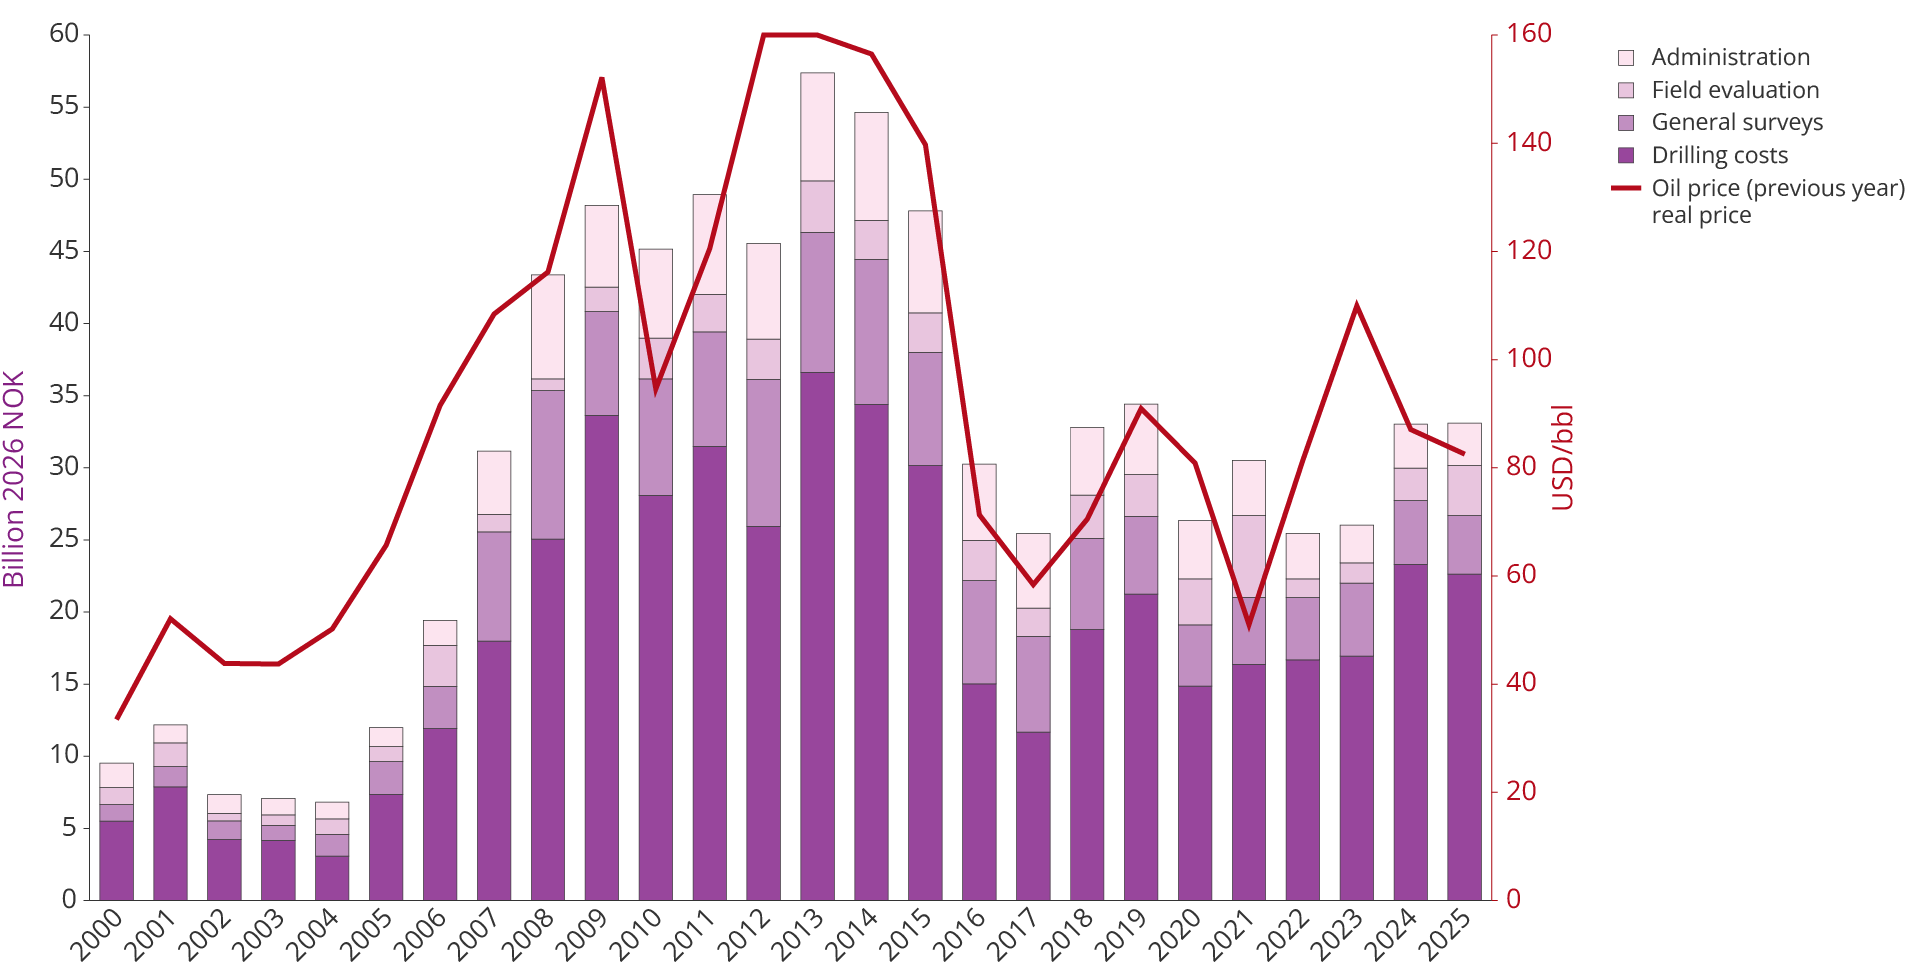
Figure 4.3 Total exploration investment by cost element and development in oil prices (previous year)
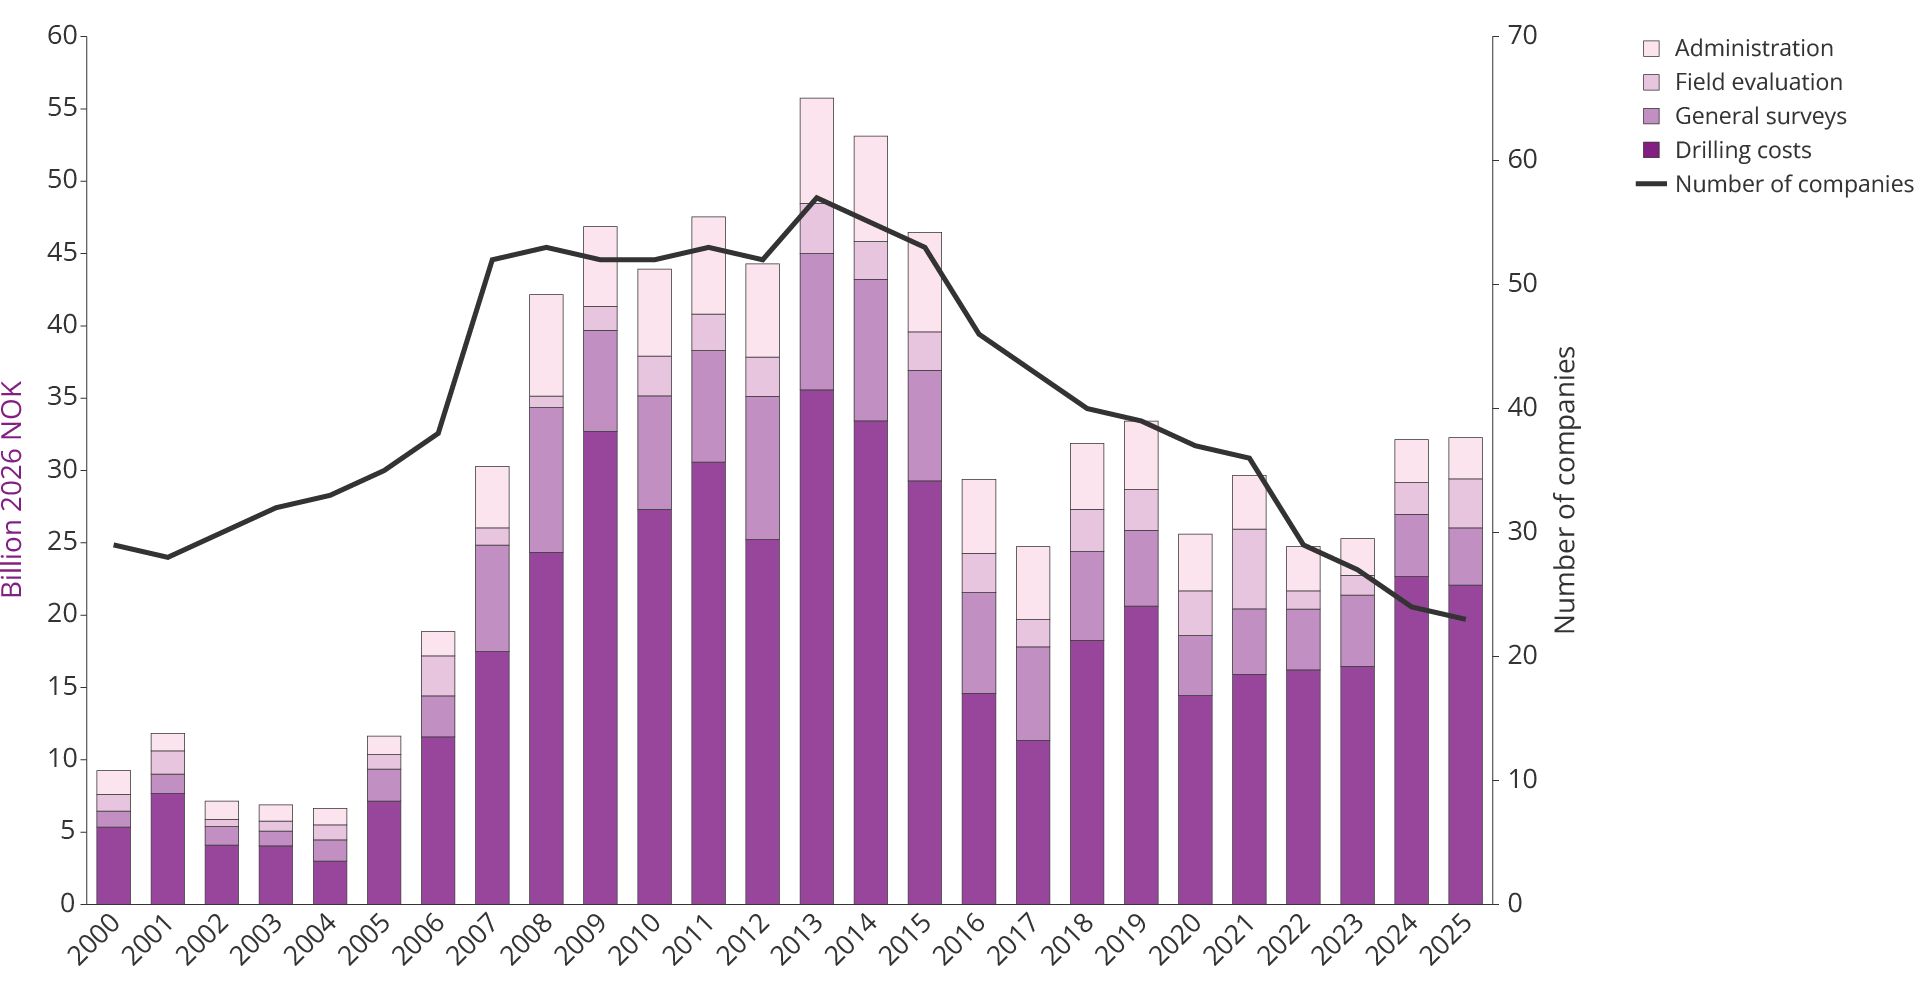
Figure 4.4 Total exploration investment by cost element and development in the number of companies on the NCS
Pressure from the capital markets for cost cuts and predictable cash flows (see fact box) led to a change in the companies' exploration strategies. Exploration became increasingly focused on prospects close to existing infrastructure, with a higher probability of discovery and shorter lead times to production. Near-field exploration became the dominant strategy post-2014 (Figure 4.5).
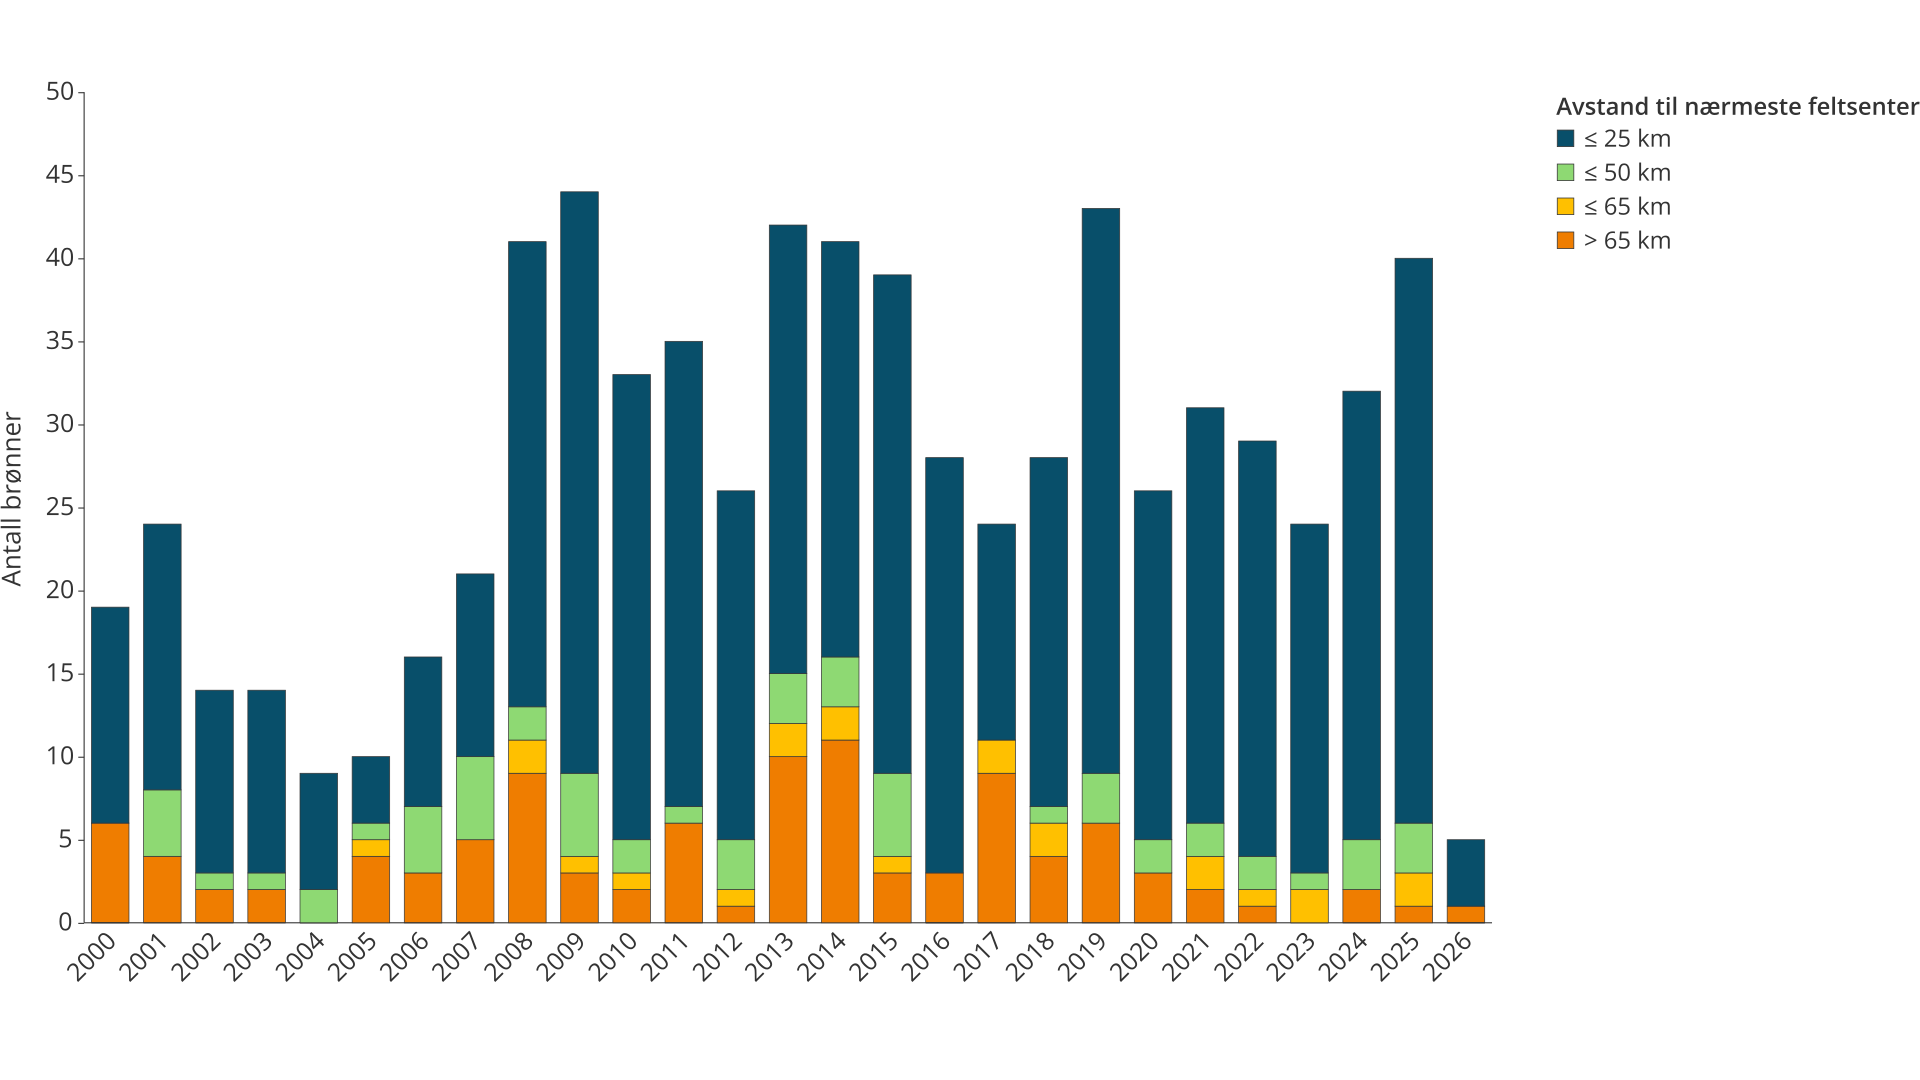
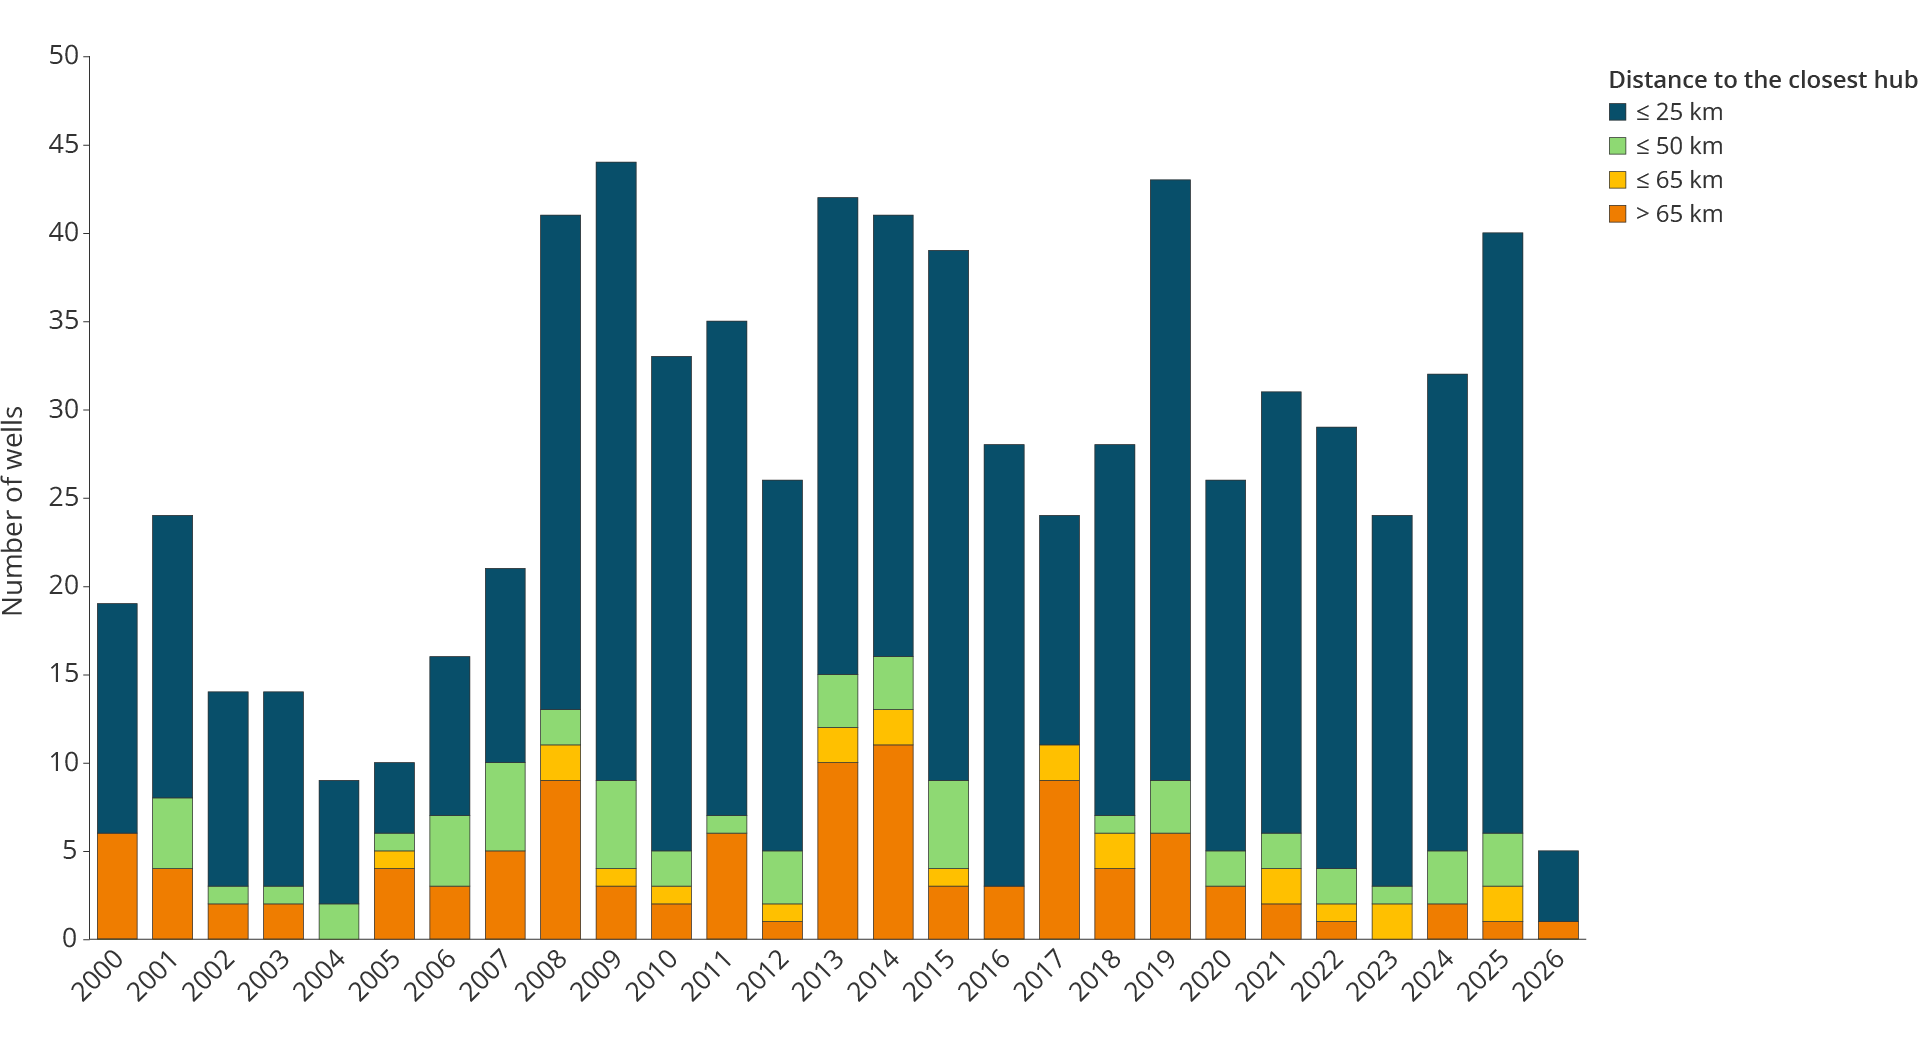
Figure 4.5 Development in the number of exploration wells over 65 km
Capital discipline and willingness to explore
Following the drop in oil prices in 2014–2015, international oil companies were exposed to increased pressure from owners and capital markets to reduce costs, strengthen their balance sheets, increase shareholders dividends and ensure more stable cash flow. This led to a clearer emphasis on capital discipline in the companies' strategies.
Capital discipline affects exploration activity by companies prioritising prospects close to existing infrastructure, which can result in rapid production start-up and short payback time.
The geology of mature areas is better mapped, reducing exploration risk. Proximity to infrastructure also contributes to lower risk in other ways. Wells can be drilled from existing facilities, and discoveries can be quickly phased into existing facilities.
The result is a more cost-effective and selective exploration activity. However, exploration becomes more short-term oriented and less focused on prospects with the potential for large discoveries. Historically, this has been important for resource growth on the NCS.
The consequence is a clear decrease in the average discovery size and fewer large discoveries (Figure 4.6), and resource growth from exploration no longer contributes sufficiently to counteracting the decline in production from existing fields (Figure 4.7). This trend is not only due to the maturity of the shelf. It also reflects the companies' exploration strategies.
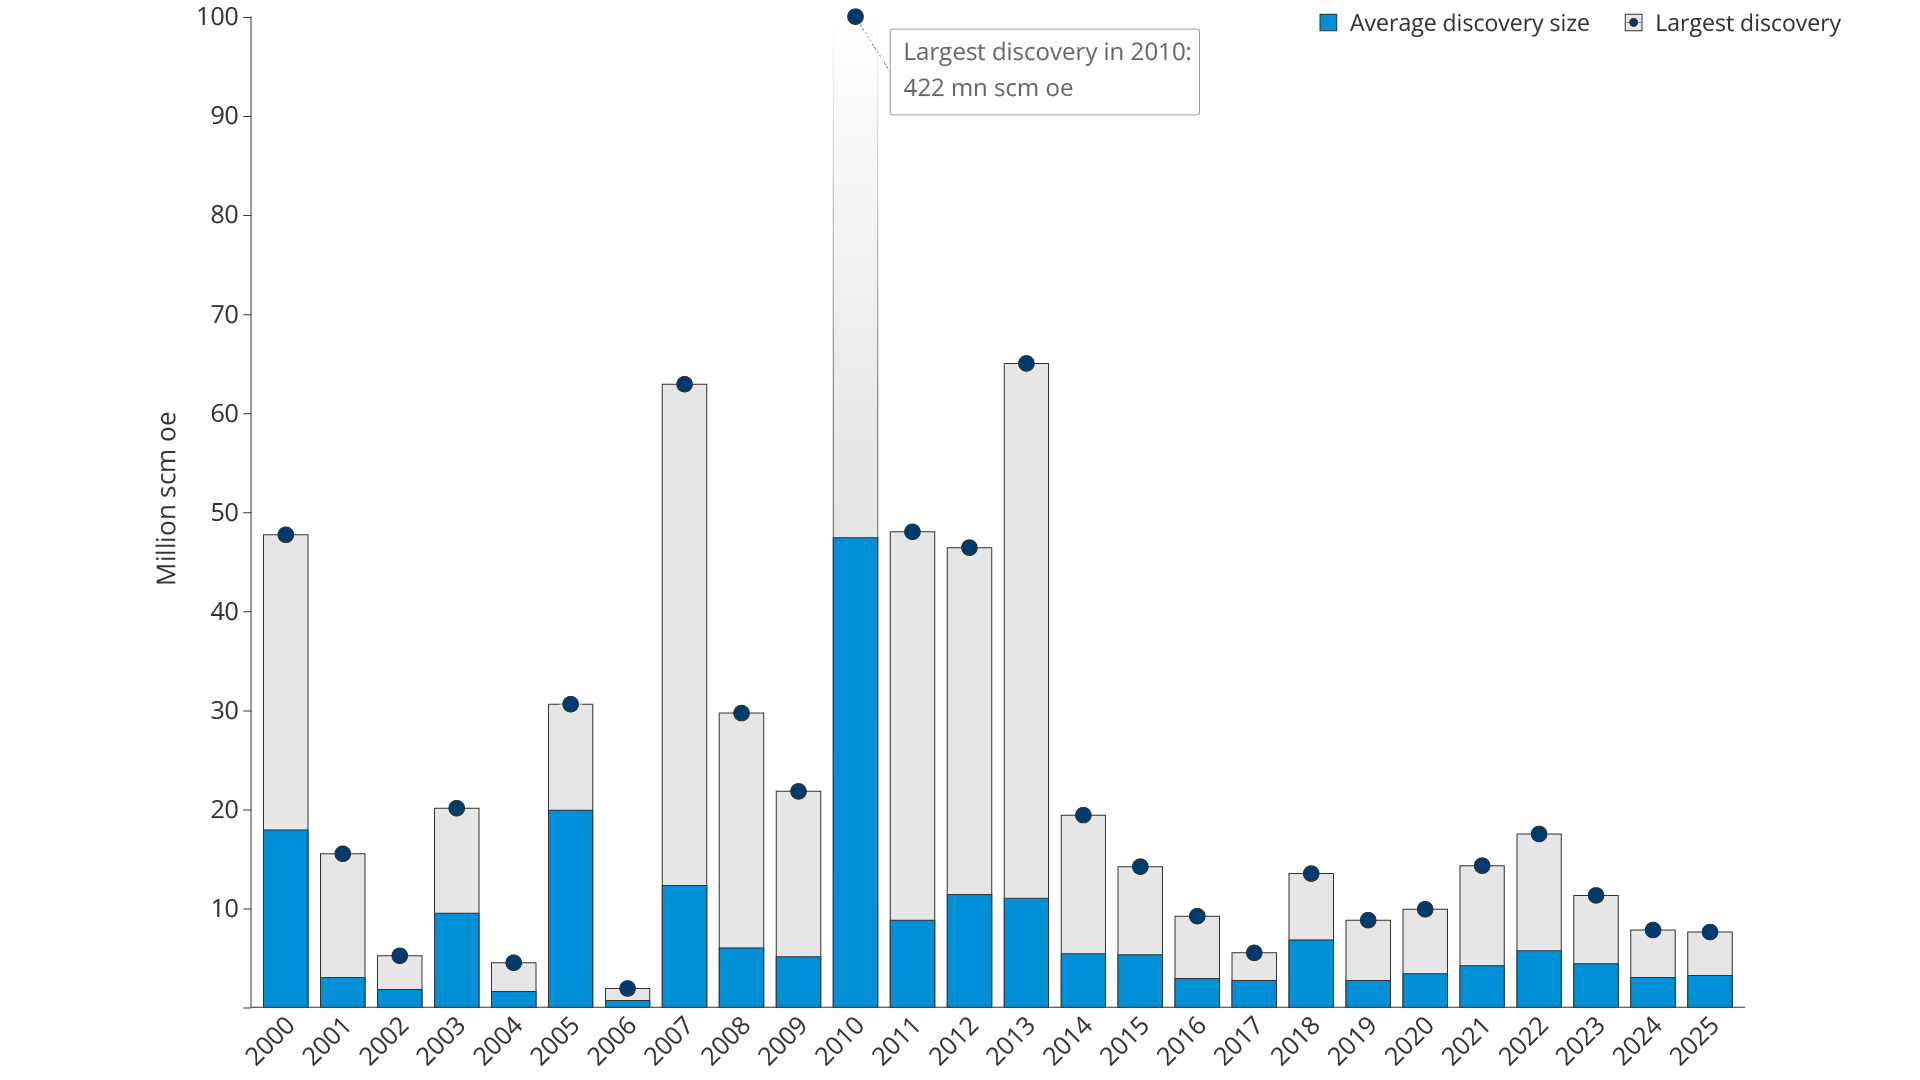
Figure 4.6 Average discovery size and largest discovery per year. Resource class 6 (RC 6) is not included
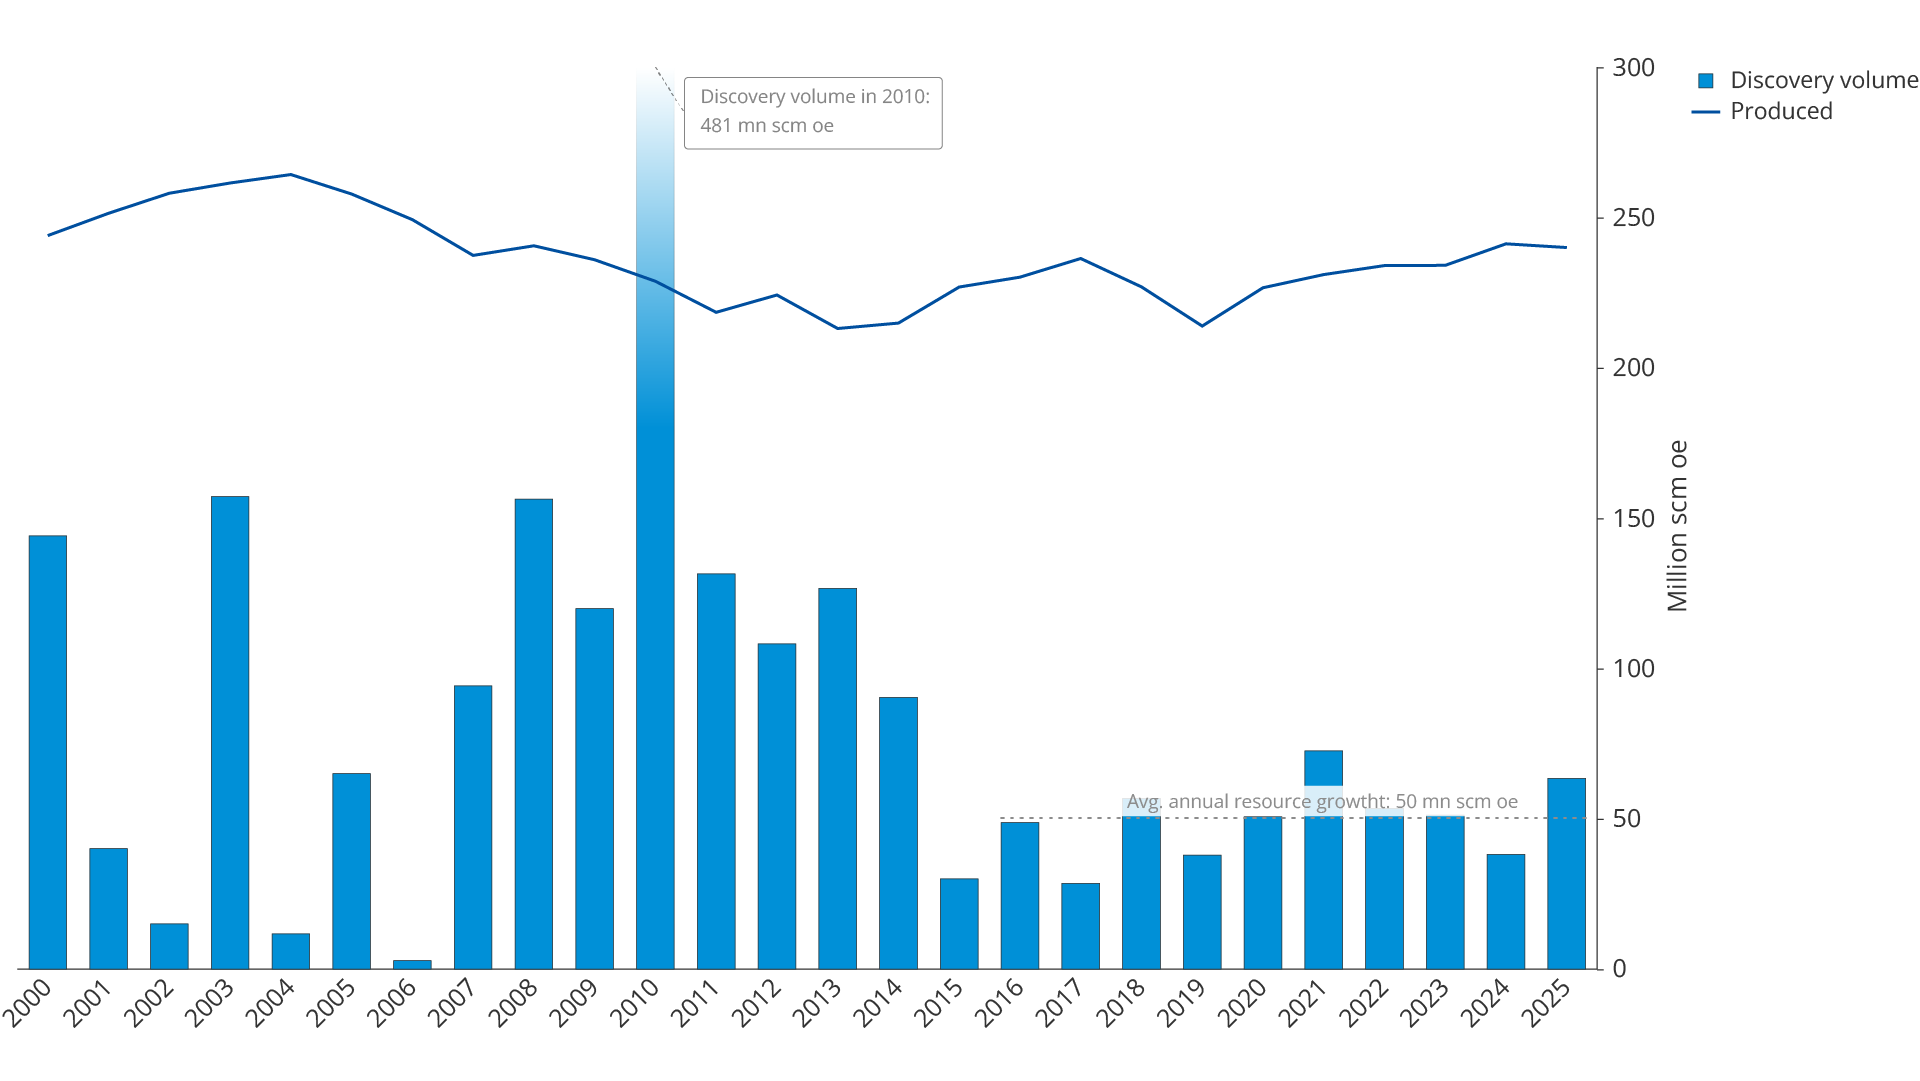
Figure 4.7 Annual discovery volume (including RC 6) and production
Near-field exploration
2025 was the best exploration year in ten years, excepting 2021. 40 exploration wells were completed, and 21 discoveries were made (Figure 4.8). The discoveries have a preliminary total resource estimate of 67 million scm oe.
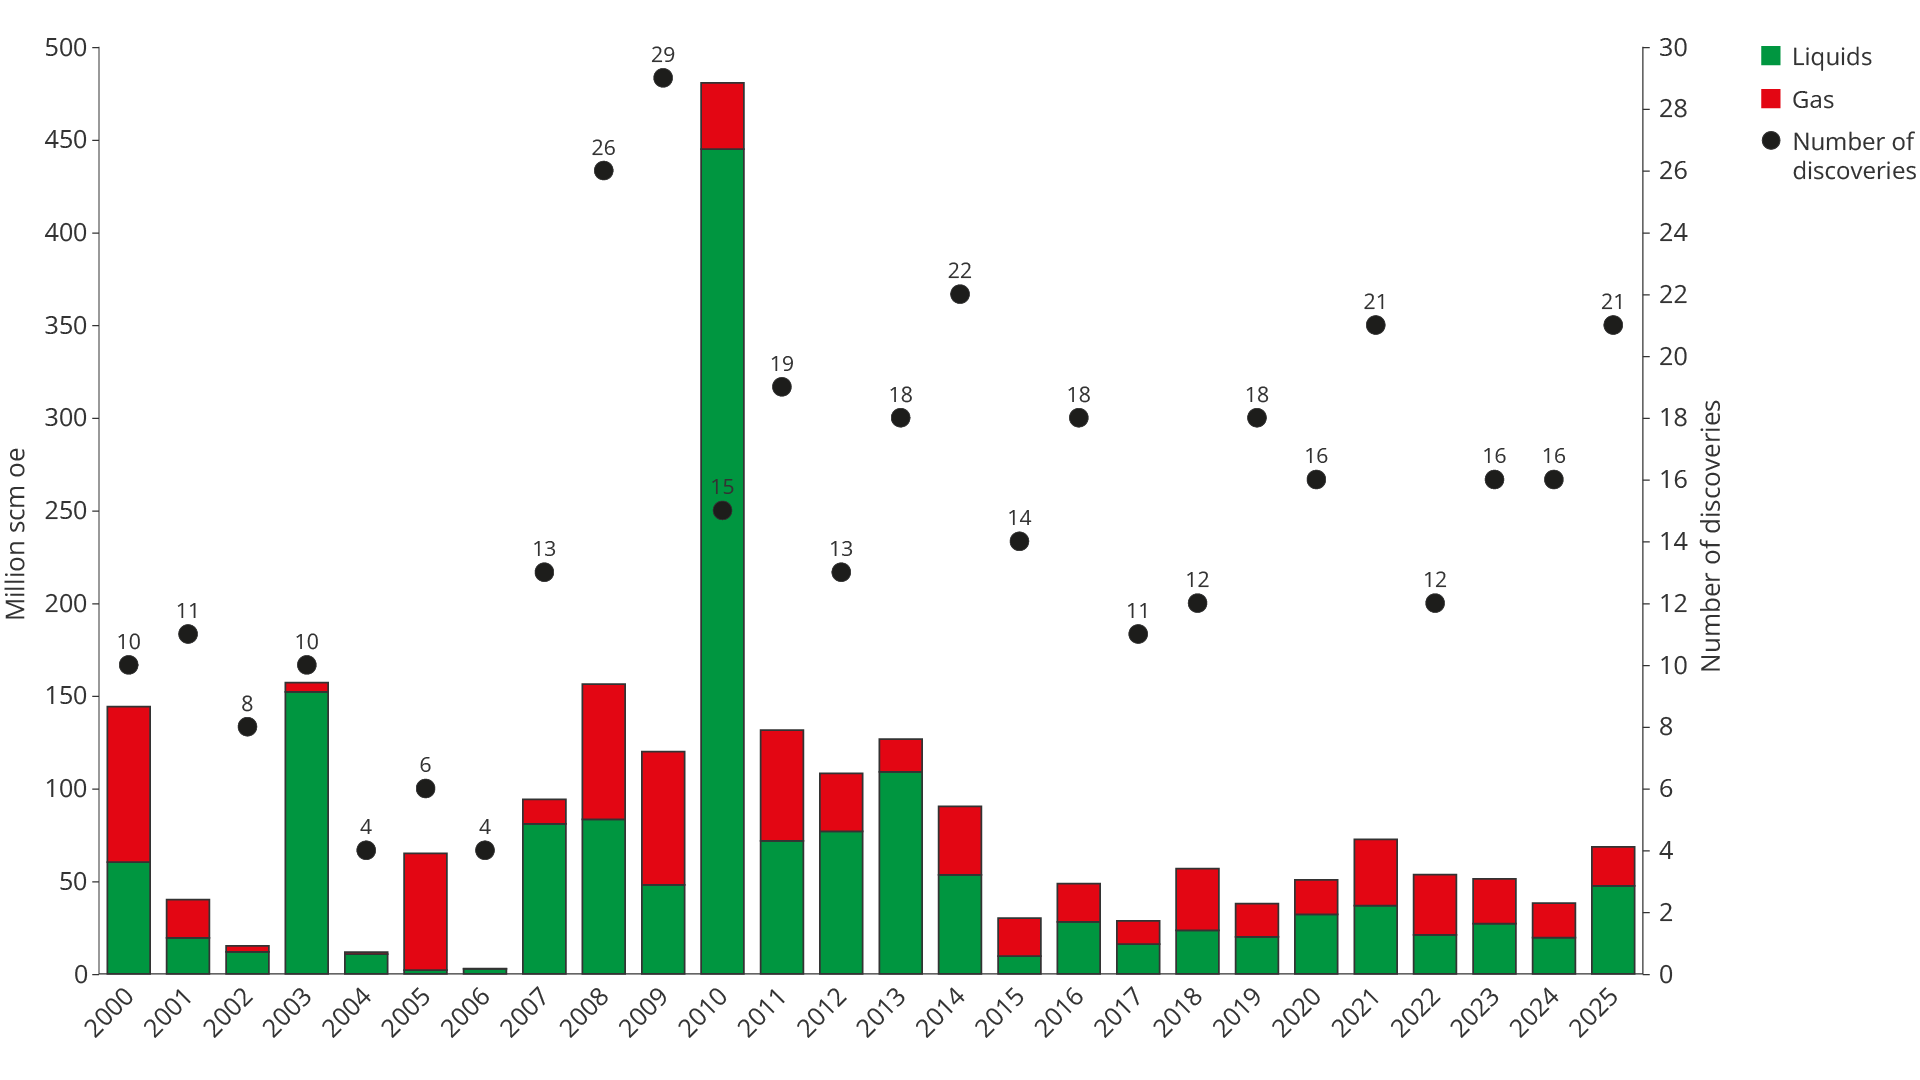
Figure 4.8 Number of discoveries and discovery volume per year
Several discoveries have been made following the implementation of new and advanced technology in seismic imaging, processing and drilling. One example is the exploration campaign "Omega Alfa" (see fact box), which demonstrates how advanced drilling technology provides greater flexibility and makes it possible to test several exploration targets in one and the same well.
"Omega Alfa" in the old Frigg area
Aker BP drilled the "Omega Alfa" exploration campaign with wellbores 25/1-14 and sidetracks A–G around the previously producing fields Frigg and Øst Frigg (the Yggdrasil area in the North Sea). The Frigg area is one of the most mapped areas on the NCS, where the Frigg and Øst Frigg gas fields were developed and later shut down over 20 years ago.
Traditional exploration was long considered to be over. The wells target thin oil columns in the Frigg formation, often below or between old gas contacts, which were historically considered non-commercial or too difficult to prove.
The main objective was to prove and delineate the remaining petroleum accumulations in the Frigg formation, particularly oil that had re-migrated into the Frigg reservoir following previous gas production and depressurisation.
Long horizontal wellbores and multilateral drilling were used, with up to several tens of kilometres of total reservoir exposure – far beyond the norm for exploration wells. Advanced geosteering and real-time data made it possible to keep the wells within thin oil zones with good reservoir quality over long distances.
Discoveries were made in four of the wells, within five accumulations) of the prospects "Omega", "Alfa", "Sigma", "Sigma NE" and "Pi", while "Alfa Sør" was dry. "Sigma NE" (25/1-14 C) was the largest single discovery on the shelf in 2025. The licensees consider the discoveries to be part of the Yggdrasil development (18).
The "Omega Alfa" wells were special because they proved significant volumes of oil in a previously shut down and "fully explored" gas field, by using new precision drilling and long horizontal wellbores. The wells proved thin, remigrated oil zones which can be produced profitably.
The exploration results in 2025, such as the 15/5-8 S (Lofn) and 15/5-8 A (Langemann) discoveries (see fact box), and the "Omega Alfa" exploration campaign (25/1 14 A-G), demonstrate that technological developments have strengthened the companies' ability to exploit the existing knowledge base on the NCS.
«Lofn» and «Langemann» – discoveries in explored terrain
In the Sleipner area, one of the most explored areas on the NCS, hydrocarbon-bearing sandstones were proven with the help of analyses of new, improved seismic data and the re-analysis of old core samples. Wells 15/5-8 S (Lofn) and 15/5-8 A (Langemann) in production licence 1140 have proven remaining resource potential in the area.
The discoveries consist of gas and condensate in high-quality sandstone reservoirs in the Hugin formation (Middle Jurassic) and are classified as HPHT discoveries. Recoverable resources are preliminarily estimated at 5–18 million scm oe (19). Proximity to existing infrastructure provides the potential for efficient phasing-in, low development costs and relatively low emissions per unit produced.
Artificial intelligence (AI) and machine learning (ML) can help increase exploration efficiency. This applies particularly to more rapid seismic interpretation and more systematic analysis of existing well data. In well-explored areas with high data coverage, this can help uncover overlooked potential for oil and gas and re-evaluate previously downgraded prospects.
Most of the discoveries in 2025 were made in well-explored areas. This concentration of exploration in known areas reflects good returns, through lower technical risk and shorter lead times to production. However, the trend of little exploration in underexplored areas means that the potential for resource growth through larger discoveries becomes less likely, even though well-known areas can also turn up trumps, such as the discovery of Johan Sverdrup.
Exploration activities on the NCS in 2025 and partly in 2026 thus follow an established Norwegian and international trend. Most activity is concentrated in well-explored areas, reflecting the increased emphasis on capital discipline.
Internationally, a debate is underway about whether the accelerating "natural decline rate" globally (20) is forcing major oil companies to dissolve their capital discipline and thus open up for more "frontier exploration"(21)(22).
New technology increases the value of a unique database
The NCS is one of the world's most thoroughly mapped petroleum provinces, underpinned by decades of continuous seismic acquisition (Figure 4.9). Following many years of systematic exploration, the amount of data is abundant (see fact box) and the geology in large areas of the North Sea and the Norwegian Sea is well mapped.
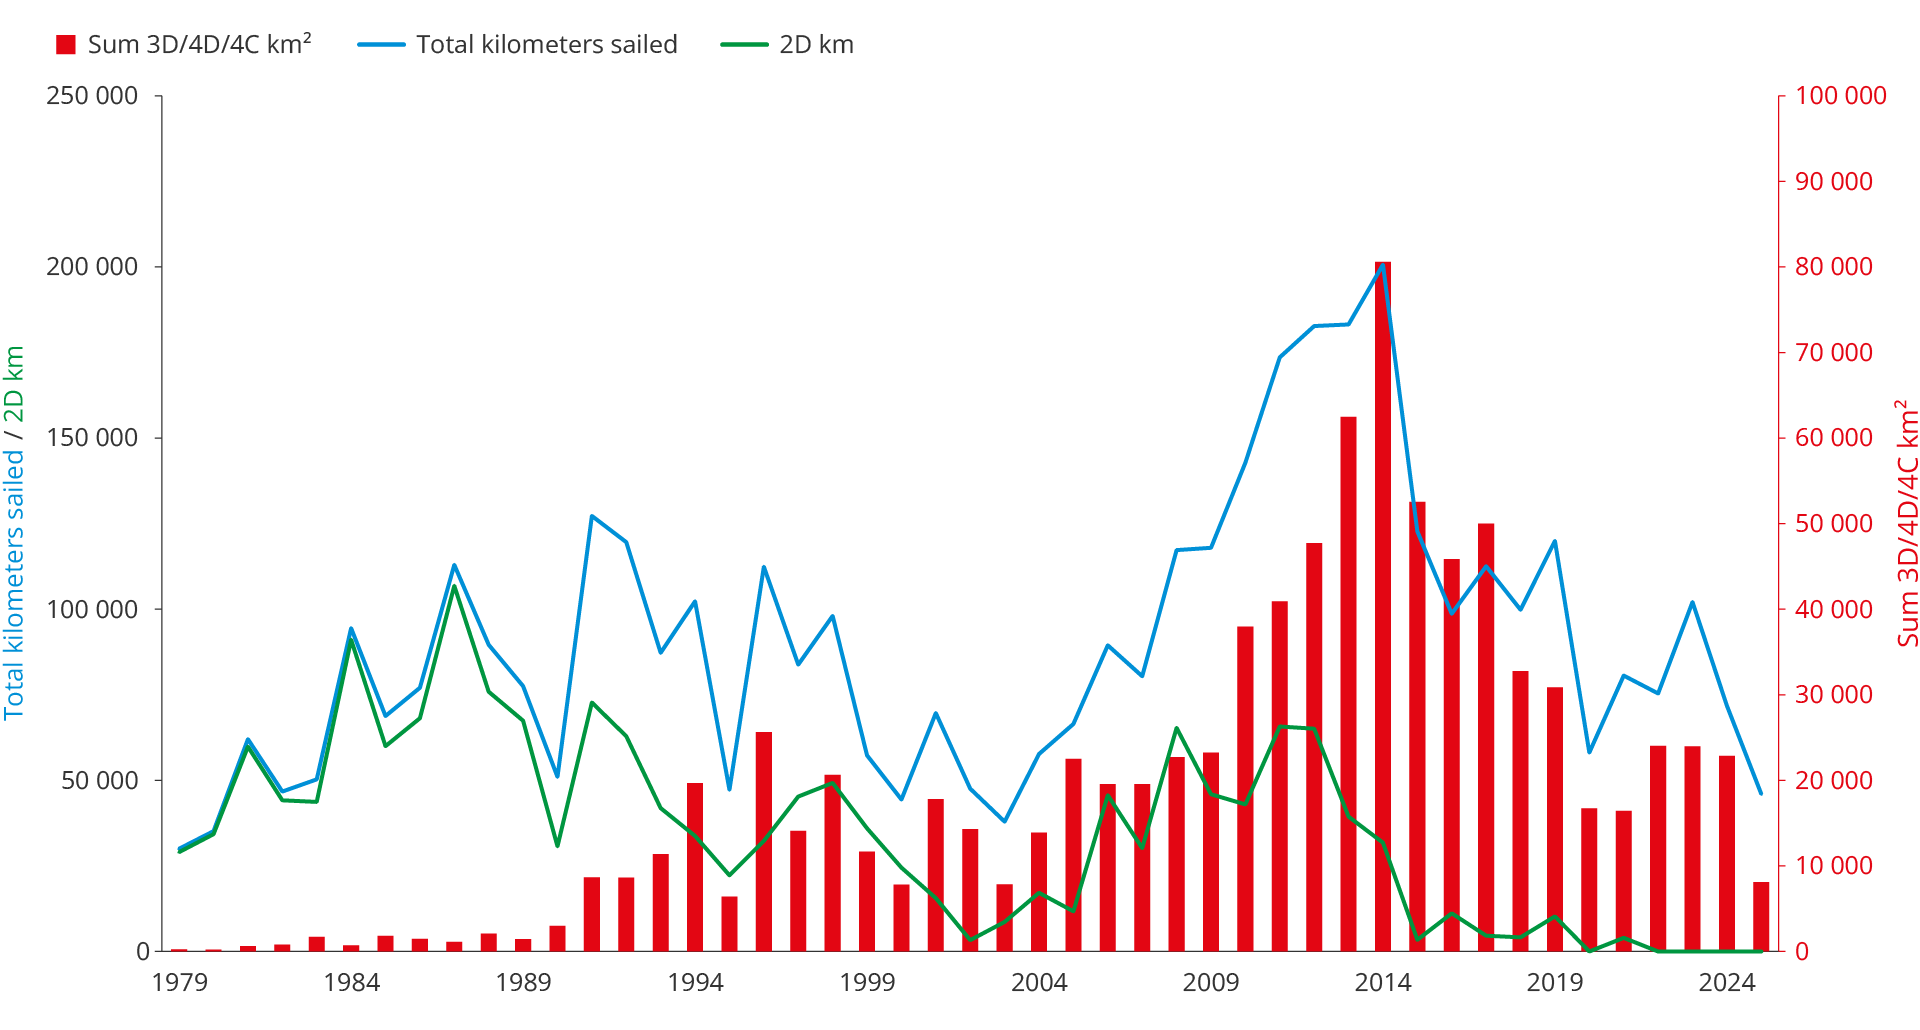
Figure 4.9 Historical acquisition of seismic data (1979–2025)
Diskos: 30 years of systematic data collection, storage and sharing
In 2025, Diskos (23) marked its 30th anniversary. The database was established in 1995 as a joint industrial archive for seismic data and well information from the NCS and has since grown to become one of the world's most comprehensive and publicly accessible petroleum databases.
The amount of data increased from around 16 petabytes in 2023 to around 22 petabytes in 2025 (24), a growth reflecting both increased activity and improved standardization of data formats.
For 30 years, Diskos has contributed to making the NCS one of the world's most data-intensive petroleum provinces. Systematic acquisition, storage and sharing of seismic, well data and reservoir information has resulted in a knowledge base garnering international attention (25). The combination of high data quality, vast geographical and geological variation and long timeseries of data makes Diskos a resource to which few other petroleum provinces have access.
Once the confidentiality period for a dataset has expired, the data becomes available to Diskos members. The database currently contains over 1,300 public seismic surveys with a total of over 24,000 data sets from the early 1980s up to the present. This is what makes the NCS unique: nowhere else in the world has so much seismic data been gathered in one place, nor been made accessible in this way.
In 2025, it became even clearer that this data base is an ideal starting point for training AI models adapted to Norwegian conditions, even though the data structure can be better adapted (26). AI and machine learning enable qualitatively different processing of large data sets, from seismic interpretation to well planning and reservoir simulation.
Measuring quality in AI models
It is challenging to assess how well an AI model answers complex academic questions. To measure the quality of responses to geoscientific and petroleum engineering issues on the NCS, the Force (27) consortium has published an open dataset with 1,100 questions and associated answers. The dataset is based on reports and data from Diskos.
The dataset provides industry and other players working on the subsurface on the NCS with a common basis for measuring, comparing and further developing the use of AI in professional analyses.
High well density per unit of area shows areas that are relatively well-explored, while low well density indicates areas that are less explored. The North Sea and parts of the Norwegian Sea are well mapped, with both high well density and good seismic coverage (Figure 4.10).
Layers
Figure 4.10 The map contains several layers which can be switched on and off. The layers show well density (wildcats), time (months) an acreage has been awarded, the number of times acreage has been awarded and the time since the last acreage has been awarded.
Central areas of the North Sea, particularly around Oseberg, Troll, Gullfaks, Sleipner and Ekofisk, are the clearest examples of well-explored areas. The same applies to large parts of Haltenbanken in the Norwegian Sea.
In the Barents Sea, the Hammerfest Basin is approaching a similar level of exploration. Even there, this primarily applies to the Jurassic levels, while deeper plays remain underexplored.
An area may be well-explored for known plays whilst still being stratigraphically underexplored. The central North Sea, for example, is well mapped in the Middle and Upper Jurassic, while pre-Jurassic and Palaeozoic levels have not been widely tested.
In mature areas such as the North Sea and parts of the Norwegian Sea, extensive conventional seismic data has been acquired, which has been reprocessed for better imaging. Near to existing infrastructure, seabed seismic is used to improve imaging and where acquisition of conventional seismic data is not possible.
Over the past ten years, technological developments have made seabed seismic more widespread. Increased processing capacity provides a better basis for decision-making than previously and enables larger surveys both for imaging reservoirs in the field and discoveries, as well as exploration opportunities (prospects).
Seismic methods in infrastructure-dense areas
Conventional streamer seismic and its limitations
In conventional marine seismic, sound pulses are sent from air gun arrays, while the signals are recorded by hydrophones in long cables (streamers) which are towed behind the vessel. The method is area-efficient and covers large areas per survey. Near infrastructure, streamer seismic is challenging, because the vessels must manoeuvre around fixed facilities. This restricts access to certain areas. Streamer seismic illuminates the subsurface in one direction, which can reduce image quality in areas with complex geology.
Multi-azimuth data (MAD) for better imaging
In areas with complex geology, it is advantageous to illuminate the subsurface from several directions. By combining streamer datasets collected in different directions, the processing can provide significantly better imaging than data collected in one direction. On the NCS, companies have in recent years acquired large data sets which are processed together with older seismic data, collected in other directions, to improve data quality.
Seabed seismic – two primary methods
In areas with dense infrastructure, the receivers are moved from near the sea surface to the seabed, while the source moves over the area. In practice, this provides data with a very high degree of flexibility. This approach is called Ocean Bottom Seismic (OBS) and incorporates the primary methods using subsea cable and subsea nodes.
Subsea cable (OBC)
Instrumented cables are deployed on the seabed from a dedicated vessel. This method provides better data quality than conventional seismic in infrastructure-dense areas, but the cable is relatively rigid. This requires careful planning around existing facilities and provides limited flexibility. Today, subsea cables are used less frequently. The industry has largely switched to subsea nodes.
Subsea nodes (OBN)
OBN uses self-contained, battery-powered instrument packages that are placed individually on the seabed using an ROV or special vessel. The nodes record data over a defined period and are then retrieved. The loose deployment provides high flexibility and makes it possible to place receivers close to facilities, pipelines and other subsea facilities. Data density and geometry can be adapted to the purpose, while the source vessel operates with greater room for manoeuvre.
Full-waveform inversion
Full waveform inversion (FWI) utilizes the entire seismic signal, allowing for improved and more detailed imaging of the subsurface. This leads to less geological uncertainty and more precise drilling decisions. Seabed seismic yields very good results in full-waveform inversion, because the data basis is abundant and provides imaging in all directions. This makes it easier to identify and develop even smaller prospects in mature areas close to existing infrastructure.
4D seismic and repeatability in producing fields
4D seismic, repeated seismic recordings over time, is a key tool for monitoring producing fields. The method is used to follow fluid movements, identify remaining resources and assess the effect of injection measures. On the NCS, 4D seismic is widespread in mature fields such as Ekofisk, Gullfaks and Oseberg.
For reliable 4D results, repeatability is essential. Large fields often have permanent reservoir monitoring (PRM) which gives the best repeatability. OBN also provides particularly favourable conditions because the nodes can be placed in the same location with high precision during repeated recordings. This provides more consistent data than with conventional seismic and makes OBN the preferred method in large, mature fields with a lot of infrastructure.
Advanced seismic technologies make it possible to detect small, complex or previously overlooked accumulations close to existing infrastructure. Examples are "Lofn" and "Langemann", which were discovered in 2025 in well-explored areas. The discoveries were made based on, inter alia, interpretations of new seabed seismic data and updated geological interpretations. This proves that there is potential also in areas considered to be well-explored.
Such findings are important, not only because they add resources, but also because they provide new knowledge. Better data quality, improved imaging technologies, AI and new geological hypotheses can change the understanding of the subsurface, even in the most explored areas.
Great opportunities in underexplored areas
Exploration close to existing infrastructure alone is unable to provide sufficient resource growth over time. A balanced exploration strategy must therefore combine continued activity in well-explored areas with measures that stimulate geological innovation and increased efforts in areas with higher resource potential and the possibility of larger discoveries.
Even in areas that have been opened for petroleum activities, there are still large areas of underexplored territory. This applies to large parts of the southern Barents Sea, parts of the deep-water areas and coastal areas in the Norwegian Sea and some areas in the North Sea. Such areas provide greater opportunities for major discoveries.
Underexploration is usually understood geographically, relating to areas with few wells, limited seismic coverage and immature play understanding. However, this approach does not capture the fact that even deeper stratigraphic levels and alternative plays within well-explored areas may be as little tested as areas that are geographical underexplored.
Areas may be poorly explored because they lack access to infrastructure, have not been opened for petroleum activities or incur high costs, for example, due to challenging distances and deep or complex reservoirs, making exploration less attractive.
Stratigraphic underexploration is largely due to technological limitations. Limitations in seismic imaging, immature play understanding and the operators' exploration strategy are particularly important factors. Capital discipline and a low risk appetite mean that companies often prioritise known plays with proven profitability rather than testing deeper or alternative stratigraphic levels, even in well-explored areas.
Knowledge externalities also contribute to certain areas being underexplored. Exploration provides knowledge, and the value of results from drilling, seismic data and geological models extends far beyond the benefits to the individual player. This may result in lower exploration activity than is economically efficient from a societal perspective. Government funding of stratigraphic wells, seismic mapping and more efficient data sharing through Diskos can help to reduce this market failure.
Knowledge externalities
Knowledge externalities arise when information generated by one industry player's exploration drilling accrues to other players without full compensation. Knowledge of geology, stratigraphic column, pressure/temperature regime, source rock and reservoir quality is largely non-excludable and non-rivalrous once it has been gathered. The party that drills bears the entire cost; many industry players reap the benefits of learning effects.
New source rocks and immature Plays
Widespread natural seepage on the Norwegian continental shelf
Natural gas and oil seeps are widespread on the NCS (28). Several thousand methane seep sites have been mapped on the seabed, mainly in the Barents Sea. This makes the region one of the world's most active for subsea methane emissions.
Natural oil seepage has also been proven in some places, including off the coast of Svalbard. In addition, oil slicks have periodically been observed on the sea surface in the southern North Sea.
The findings are based on research and surveys by the Norwegian Offshore Directorate and collaborating academic communities in recent years. The purpose has been to understand the underlying petroleum systems.
The surveys show that the seepage is largely controlled by geological conditions. The occurrence is particularly high where previous ice age erosion has weakened overlying cap rocks.
The studies have also revealed a previously overlooked, young source rock west of Svalbard. The discovery is based on geochemical analysis of oil from a seabed seep.
Young source rock in the Norwegian Sea – a possible new play
A young source rock widely distributed in the Norwegian Sea was proven in 2024 (29). The discoveries are based on studies of natural oil seeps and link these to early/mid-Miocene intervals in several scientific wells and exploration wells.
The source rock was deposited in a large delta, which can be compared to how the Niger and Congo deltas off West Africa look today. In many places, the source rock has not been buried deep enough to generate oil.
Basin modelling nevertheless shows that the source rock may be oil-mature where it is buried deeper, for example under Bjørnøyvifta, and may have an impact on exploration opportunities in parts of the existing APA area in the Norwegian Sea.
The Finnmark platform in the Barents Sea – immature plays:
The expanded APA area on the Finnmark platform includes several plays for further mapping. Seismic data show fault structures in the bedrock with possible structural and stratigraphic traps.
Norwegian Sea west – resources beneath the basalt
Available data and geological analyses indicate petroleum potential beneath volcanic deposits on the NCS, including in the western parts of the Møre and Vøring basins (30) . There is, however, considerable uncertainty.
The challenges are of both a geological and technological nature. Imaging beneath basalt layers is currently limited, which makes for considerable uncertainty in the interpretation of the plays.
Further development of geophysical methods can provide a better basis for exploration of these areas on the NCS, allowing the areas to develop into some of the most interesting exploration areas in Europe.
What is the problem with basalt?
Basalt can affect several key elements in a petroleum system and thus increase the overall geological risk. In areas with volcanic deposits, seismic imaging is particularly challenging, both in terms of the basalt layer and the structures below it.
Basalt reflects, scatters and absorbs seismic energy, which can create noise and multiple reflections, and results in very little signal penetrating the basalt and returning to the receivers. Variation between lava flows, breccia and vesicles gives further uncertainty in velocity models and depth migration. The signal is weakened, and the possibility to image deeper structures is diminished.
Heat from basalt and igneous intrusions can shift the maturation of source rocks and disrupt the interaction between hydrocarbon generation, migration, and fault development. Basalt has low permeability and can prevent migration, but cracks and contact zones can create unpredictable leakage pathways. In addition, basalt increases drilling and operational risk associated with hard rocks, low drilling speeds, high wear and reduced predictability in pore pressure and reservoir depths.
New seismic technology, better processing tools and AI-driven interpretation can help uncover plays currently unidentified. This applies particularly to deepwater areas in the Norwegian Sea and the marginal zone of established exploration activity, including in the Barents Sea.
Plays of this nature cannot be quantified with existing tools, because what is being searched for is unclear. They lie outside the current methodological and conceptual framework, not due to a lack of data, but because they require conceptual breakthroughs rather than the gradual collection of more data. Resources associated with such models are often referred to as unforeseen Resources (31) or "unknown unknowns", the ones we don’t know we don’t know (32).
Knowns and Unknowns
"Known knowns" are known fields and reserves in production. "Known unknowns" are undiscovered resources within established geological models which are included in resource calculations. "Unknown unknowns" are resources associated with plays that have not yet been conceptualised, and which therefore fall outside the existing estimation framework.
A fourth category is "unknown knowns"(33), which refers to knowledge which is implicitly present, but not explicitly articulated or problematized. In oil and gas exploration, this may refer to unspoken assumptions about which play concepts are "realistic", which reservoir types are considered commercial, or which provinces are perceived as mature. In practice, such guidelines form the basis for screening, interpretation and decisions, without necessarily being included in explicit models or estimates.
"Unknown unknowns" refers to the limits of what is conceivable, while "unknown knowns" refers to what is not challenged. Historically, new technology and geological innovation have shown the capacity to move resources from "unknown unknowns" to "known unknowns", and in some cases, all the way to discoveries. Important breakthroughs have also surfaced when established assumptions - what "everyone knows" - are challenged. In this respect, innovation in exploration activity is not only about discovering the unknown, but also about highlighting and revising the unreflected in the known.
Barents Sea – limited gas export capacity
The High North has the largest remaining resource potential on the NCS. Large parts of the Barents Sea are still underexplored, and significant areas have not been opened for petroleum activities. Realising this potential requires the development of infrastructure, particularly gas export capacity.
Hammerfest LNG – the only export capacity
Hammerfest LNG at Melkøya is currently the only operational infrastructure for gas exports from the Barents Sea. The facility is fully utilised by the Snøhvit field and is expected to be filled with proven resources until around 2050 (Figure 4.11).
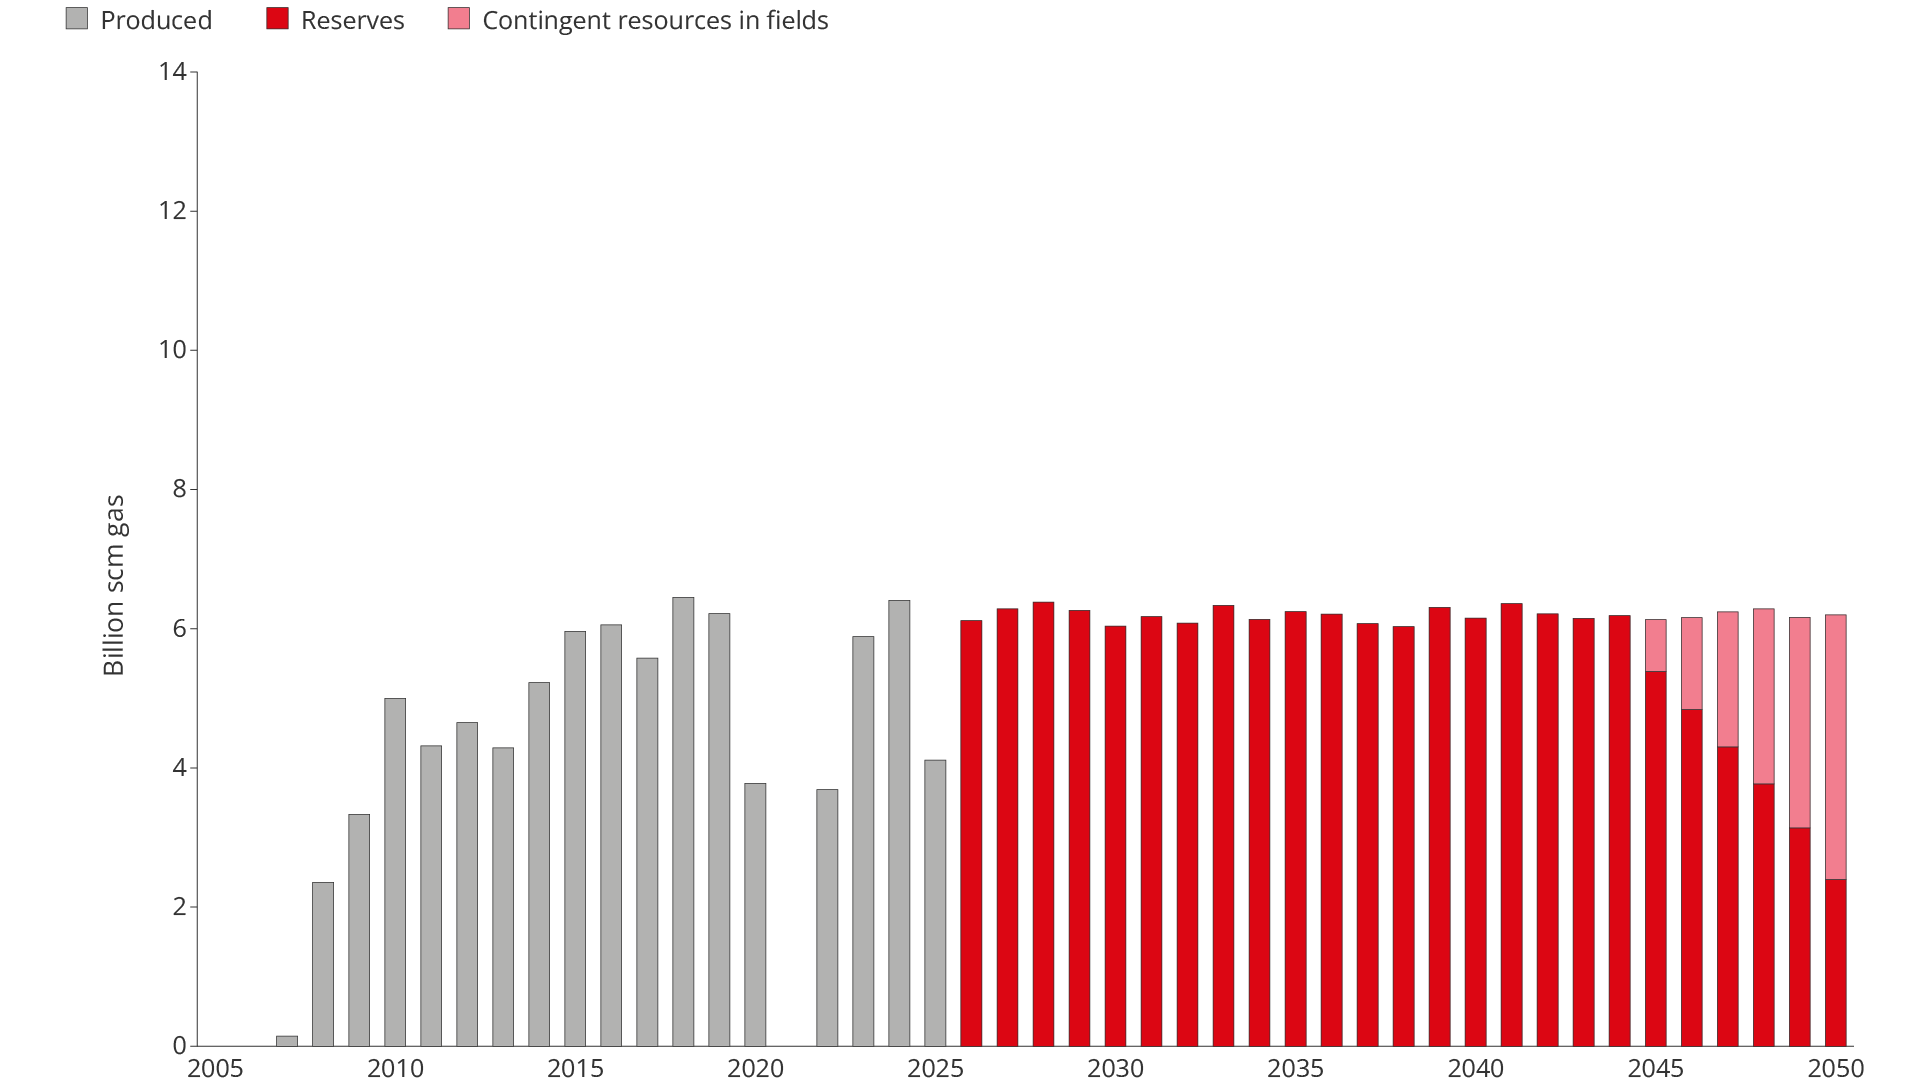
Figure 4.11 Possible trajectory for gas exports from the Barents Sea, given current export capacity
Remaining proven gas resources in the Barents Sea stand at approximately 230 billion scm, but limited gas export capacity (around 6 billion scm per year) is slowing down development.
The limited gas export capacity in the Barents Sea means that all resources in the area must compete for the same infrastructure. This applies to fields in production, discoveries under assessment and future discoveries. The result is a deferred income and weaker profitability. Without increased gas export capacity, there is a risk that significant resources with high value potential will be left behind, meaning that they will not be explored.
For oil fields with associated gas, increased gas export capacity enables more efficient operations. Surplus gas that is not needed for injection to increase oil recovery can be exported and sold. Wells that are currently being choked back due to a high gas proportion can produce close to their actual capacity, and the fields can be operated with more efficient drainage strategies.
Increased export capacity makes it possible to produce gas in line with the wells' actual delivery capacity, without being limited by available infrastructure. Gas discoveries can thus be put into production earlier and with a higher production rate from start-up.
Increased export capacity can contribute to faster development of the Barents Sea as a petroleum province in a period when the North Sea and the Norwegian Sea are in structural decline.
As illustrated in Figure 4.12, increased export capacity may result in spare capacity for proven resources and new discoveries up to 20–30 years earlier than under current limitations. This can secure a major value uplift for both oil and gas in the Barents Sea.
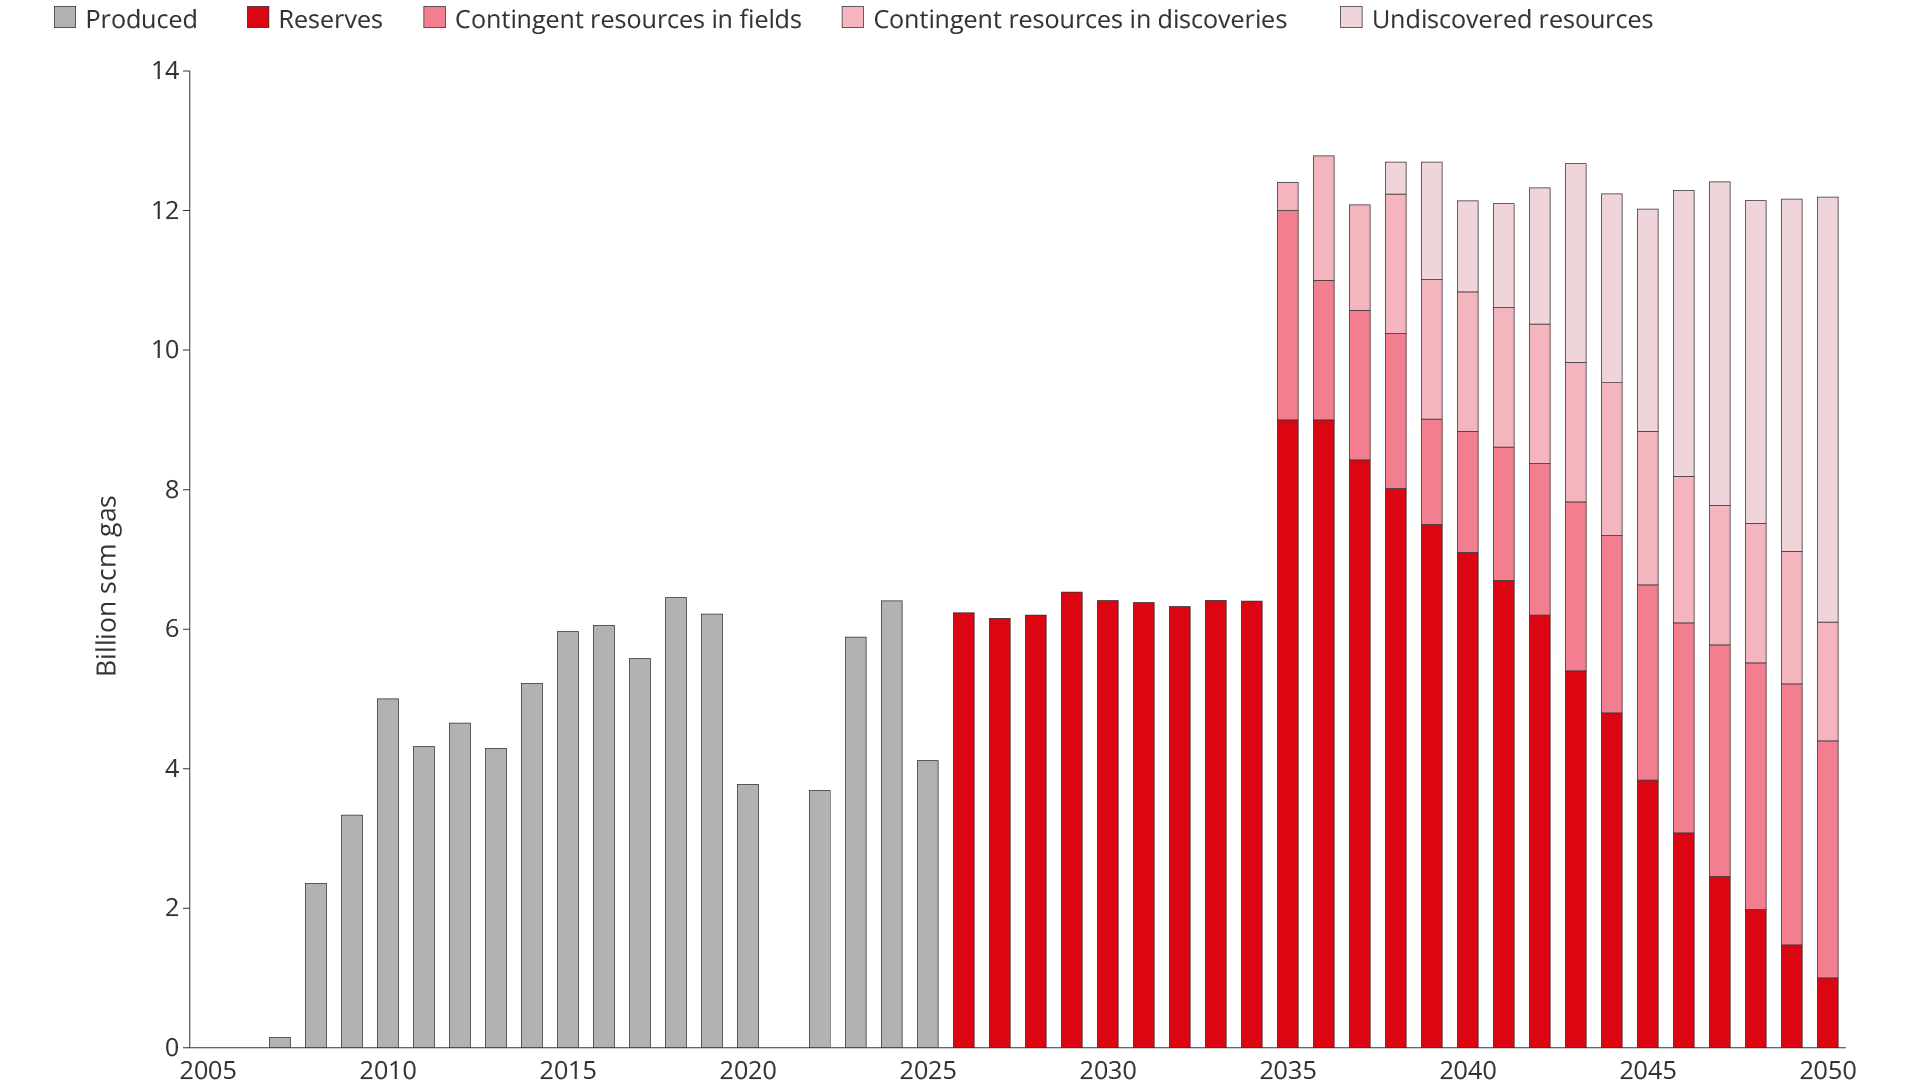
Figure 4.12 Possible trajectory for gas exports from the Barents Sea, exemplified by doubling export capacity
Gassco and the Norwegian Offshore Directorate have over several years analysed the basis for increased gas export capacity from the Barents Sea.
The 2023 study showed, inter alia, that increased gas export capacity can provide faster development of proven resources and be economically efficient from a societal perspective under given conditions (34). The analyses were based on a conservative resource base for both proven and undiscovered resources and did not include the effects on oil production.
In 2025, Gassco continued its work on assessing possible gas export solutions for the Barents Sea, resulting from the previous studies (35). Work was later paused pending increased resource growth from exploration.
Unopened areas – a sea of opportunities
The potential for making large discoveries is greater in unopened areas than in those already opened for petroleum activities, as these areas may contain new and unconfirmed plays here.
Historically, the first exploration wells in a new province have a systematically higher probability of proving large accumulations than wells in mature areas.
This is also the experience on the NCS. Ekofisk, Statfjord and Troll were all made at an early stage. The most attractive structures in a play are drilled first, and the discoveries are often far larger than those made subsequently in the exploration process.
An unopened province thus represents a different risk distribution; not necessarily a higher expected value, but a distribution with a greater probability of large discoveries.
The unopened areas on the Norwegian shelf are Skagerrak, Trøndelag I, Nordland IV–VII, Troms II, the western Norwegian Sea, the Western Margin, Barents Sea North and Jan Mayen (Figure 4.13). The areas cover large acreage and represent a wide spectrum of geological provinces, from coastal areas to deep-sea basins and Arctic regions.

Figure 4.13 Area status Norwegian continental shelf
Common to the unopened areas is that they are poorly mapped compared with areas open for exploration activity. The geological knowledge is derived mainly from scarce seismic data, shallow drilling, onshore surveys and experience from nearby open areas and comparable geological provinces. Data coverage varies and data quality is highly variable, resulting in consistently high geological uncertainty. The datasets are old and fail to meet the standard and quality of new datasets from opened regions.
In some areas, particularly in the northern Barents Sea, available data and mapped structures show considerable resource potential. However, plays and petroleum systems are largely unconfirmed, as no exploration wells have been drilled.
In other areas, such as Skagerrak and the most coastal parts of the Norwegian Sea, the resource potential is considered limited.
For the Western Margin and the western part of the Norwegian Sea, there is currently insufficient data to carry out quantitative resource assessment. New observations and ongoing studies of natural oil and gas seepage nevertheless indicate that active petroleum systems may be present. Further data acquisition is needed to reduce uncertainty and to provide a more robust basis for resource assessments.
The Jan Mayen area differs from other unopened areas due to extensive volcanism and complex geology. The resource assessments are therefore particularly uncertain, even though there are indications of potential plays in sedimentary sequences beneath and between volcanic rocks.
Profitability of exploration 2000–2025
In the period 2000–2025, exploration activity on the NCS has been extensive. More than 1,000 exploration wells have been drilled, of which around 730 are exploration wells and around 300 are appraisal wells. Total exploration costs in the period are estimated at close to NOK 800 billion. The costs include both successful and dry wells.
Methodology
The Norwegian Offshore Directorate's profitability analysis is based on revenues from discoveries made in the period 2000 to 2025, less all costs, including exploration costs and shutdown costs. Exploration costs include both exploration that has yielded discoveries and exploration that has not proven resources.
The income and cost basis is based on historical figures up to and including 2024. Future revenues and costs are based on the Revised National Budget for 2026 and the Ministry of Energy's calculation-based prices for oil and gas.
The cash flow has been discounted to the same year (2026), where a 7 per cent future discount rate and a 4 per cent historical discount rate have been Applied (36).
The exploration wells have resulted in approximately 370 discoveries, which corresponds to a technical discovery rate of around 50 per cent.
Of these discoveries, around 240 have either come on stream or are expected to be developed. Around 100 are already on stream, around 40 have received development approval and 100 are expected to be developed. The remaining discoveries are considered not profitable under current conditions, partly due to limited size or demanding conditions.
The developable discoveries represent total recoverable resources of close to 2,000 million scm oe. Total investments in development, as well as costs for operation and shutdown for the discoveries made during the period, are estimated at approximately NOK 2,700 billion. Total revenues from these discoveries are estimated at over NOK 9,000 billion (Figure 4.14).
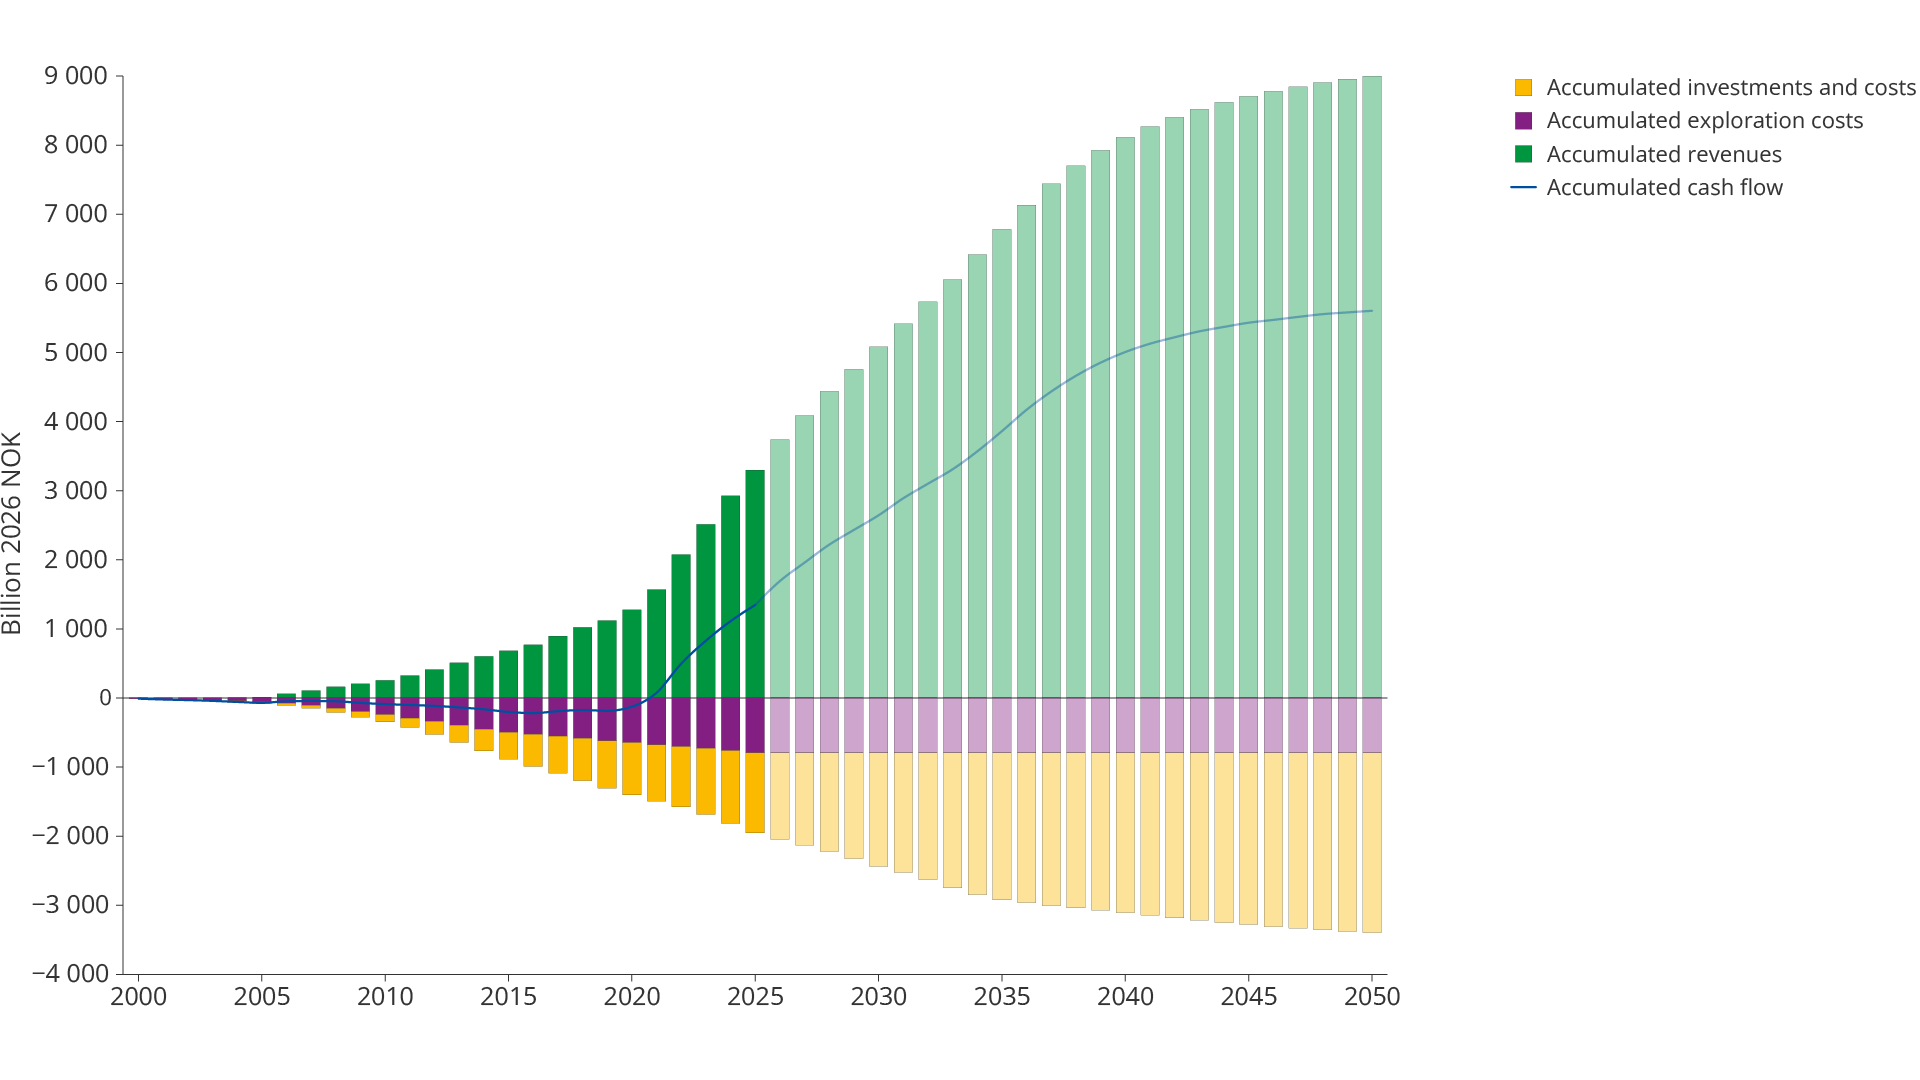
Figure 4.14 Estimated cumulative cash flow from exploration activities in the period 2000–2025
When all costs, including exploration costs, are deducted, this gives a total net cash flow of approximately NOK 5,500 billion. With a discount factor of 7 per cent, this corresponds to a net present value of almost NOK 4,000 billion (Figure 4.15). The figure shows that oil and gas exploration on the NCS during this millennium has been highly profitable.
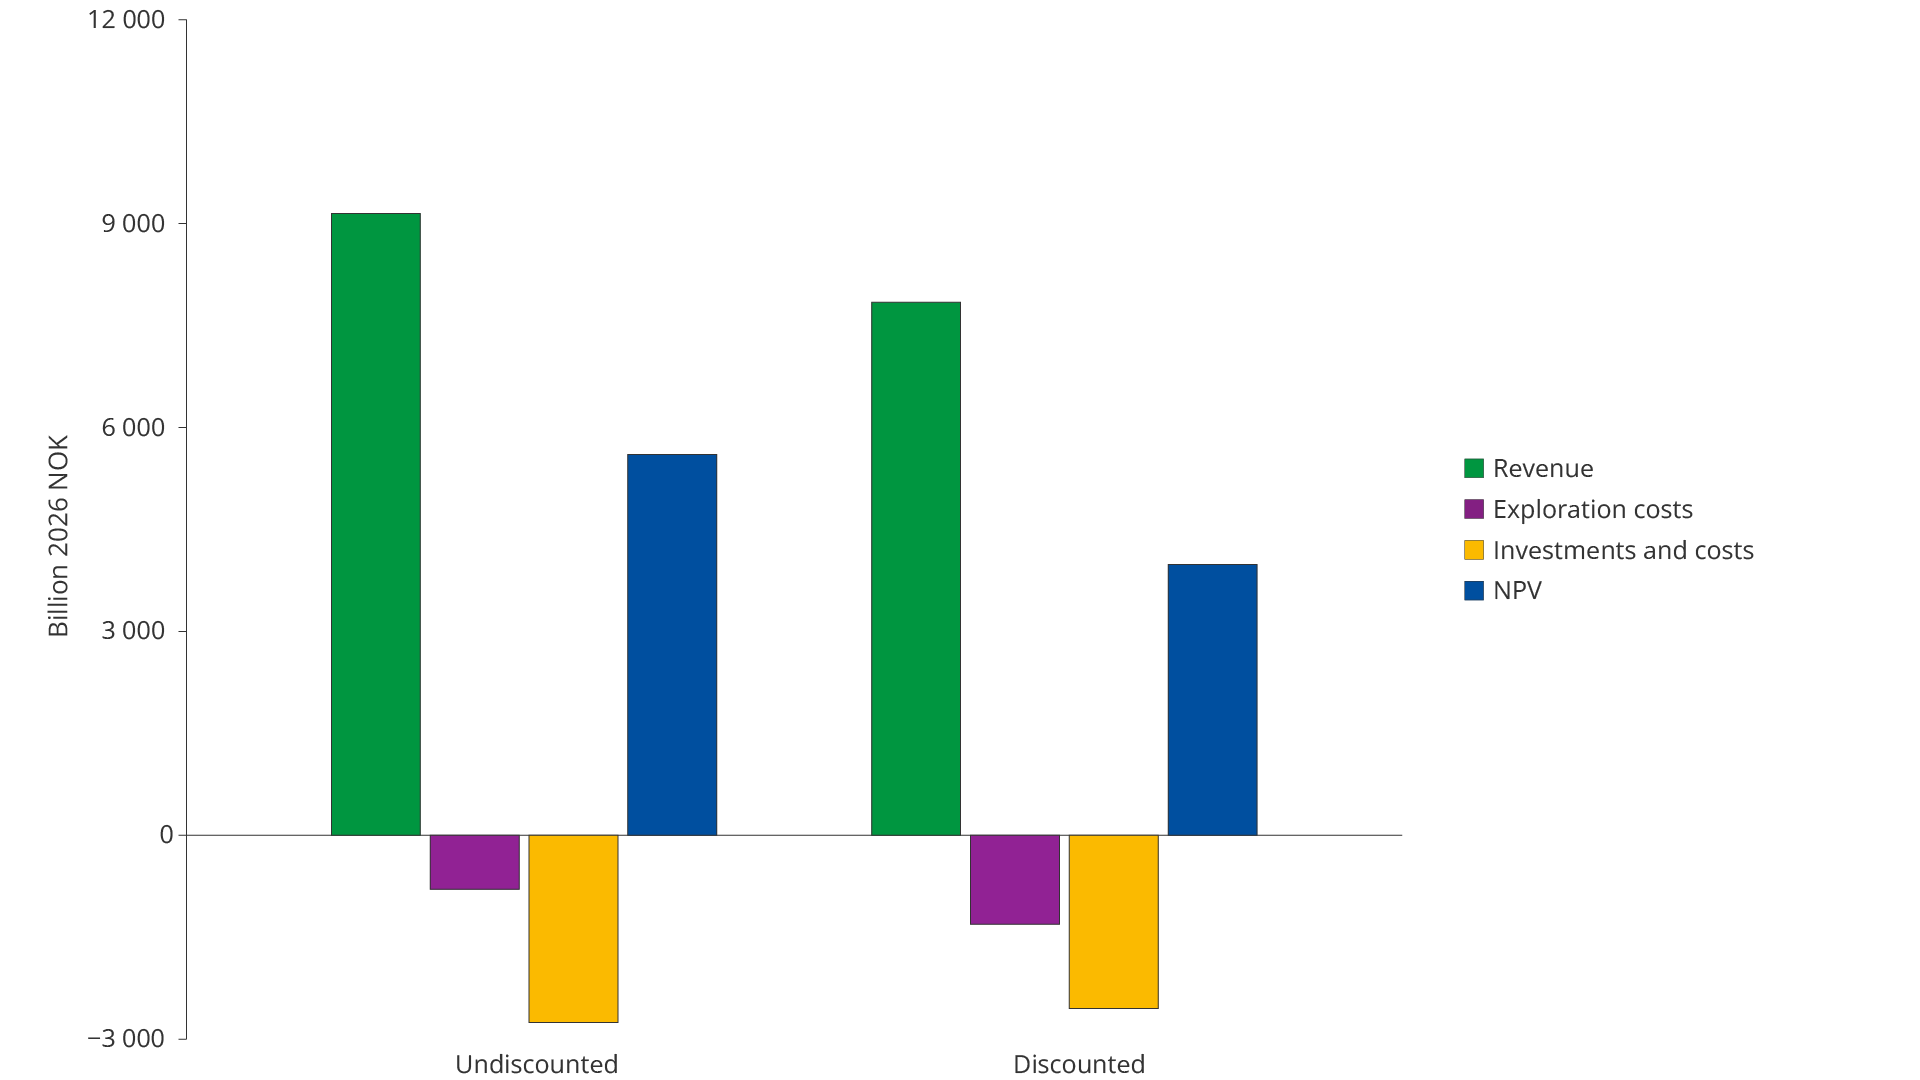
Figure 4.15 Net present value with revenues and costs related to exploration activities in the period 2000–2025
In Figure 4.16 profitability per krone spent on exploration is illustrated.
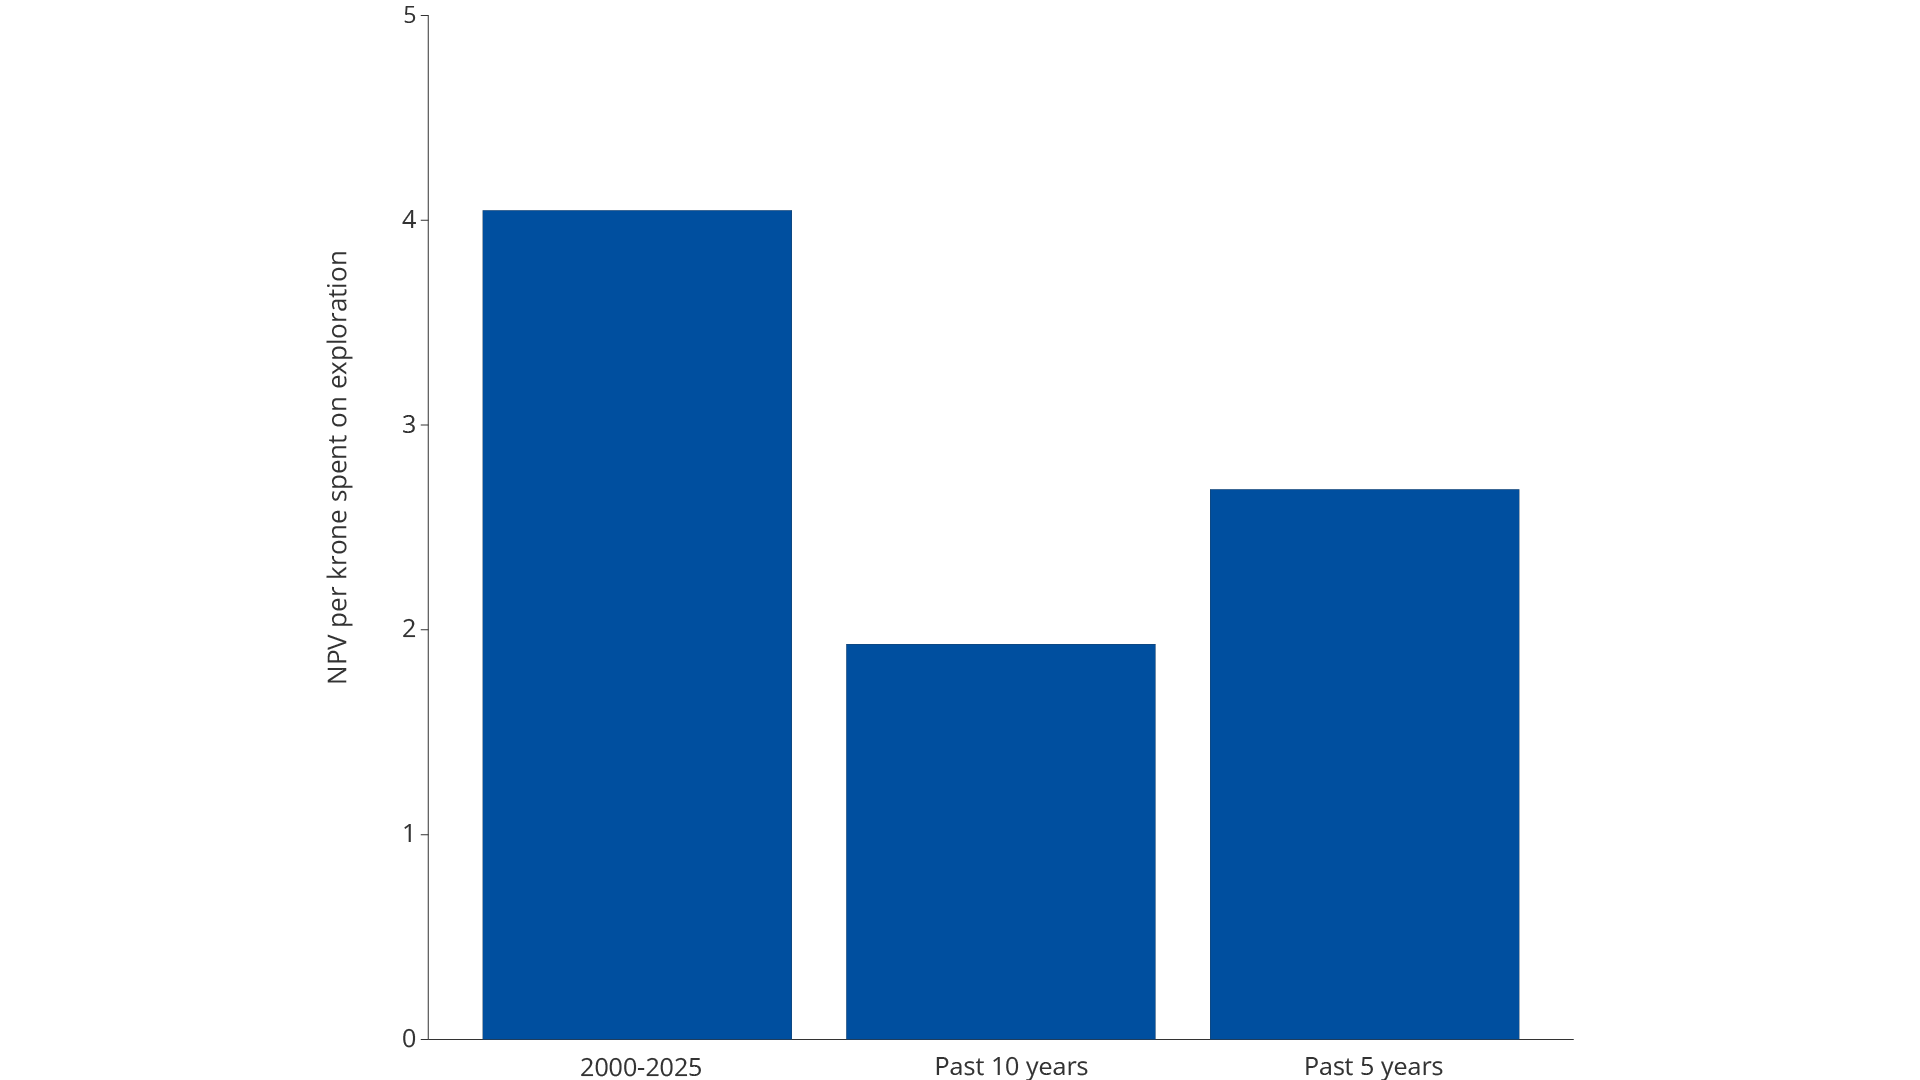
Figure 4.16 Profitability per krone spent on exploration
Every krone invested in exploration in the period 2000–2025 has returned approximately NOK 4. Several large discoveries in the first half of the period laid the foundation for highly profitable developments.
The last ten years have been characterised by higher discovery costs and smaller discoveries. Although these discoveries yield lower net present values than the large discoveries earlier in the period, they contribute to positive profitability from exploration activities overall.
Exploration on the NCS over the past ten years has returned close to NOK 2 per krone invested in exploration. Good exploration results and lower discovery costs over the past five years have increased profitability to over NOK 2.5 per krone invested in exploration.
The Norwegian Offshore Directorate's calculations show that exploration activities are profitable in all sea areas on the NCS (Figure 4.17). In the North Sea, each krone invested in exploration has returned just over NOK 5. The high profitability is related to the fact that the North Sea is a mature area with well-developed infrastructure and several large discoveries during the first half of the analysis period, including 16/2-6 Johan Sverdrup.
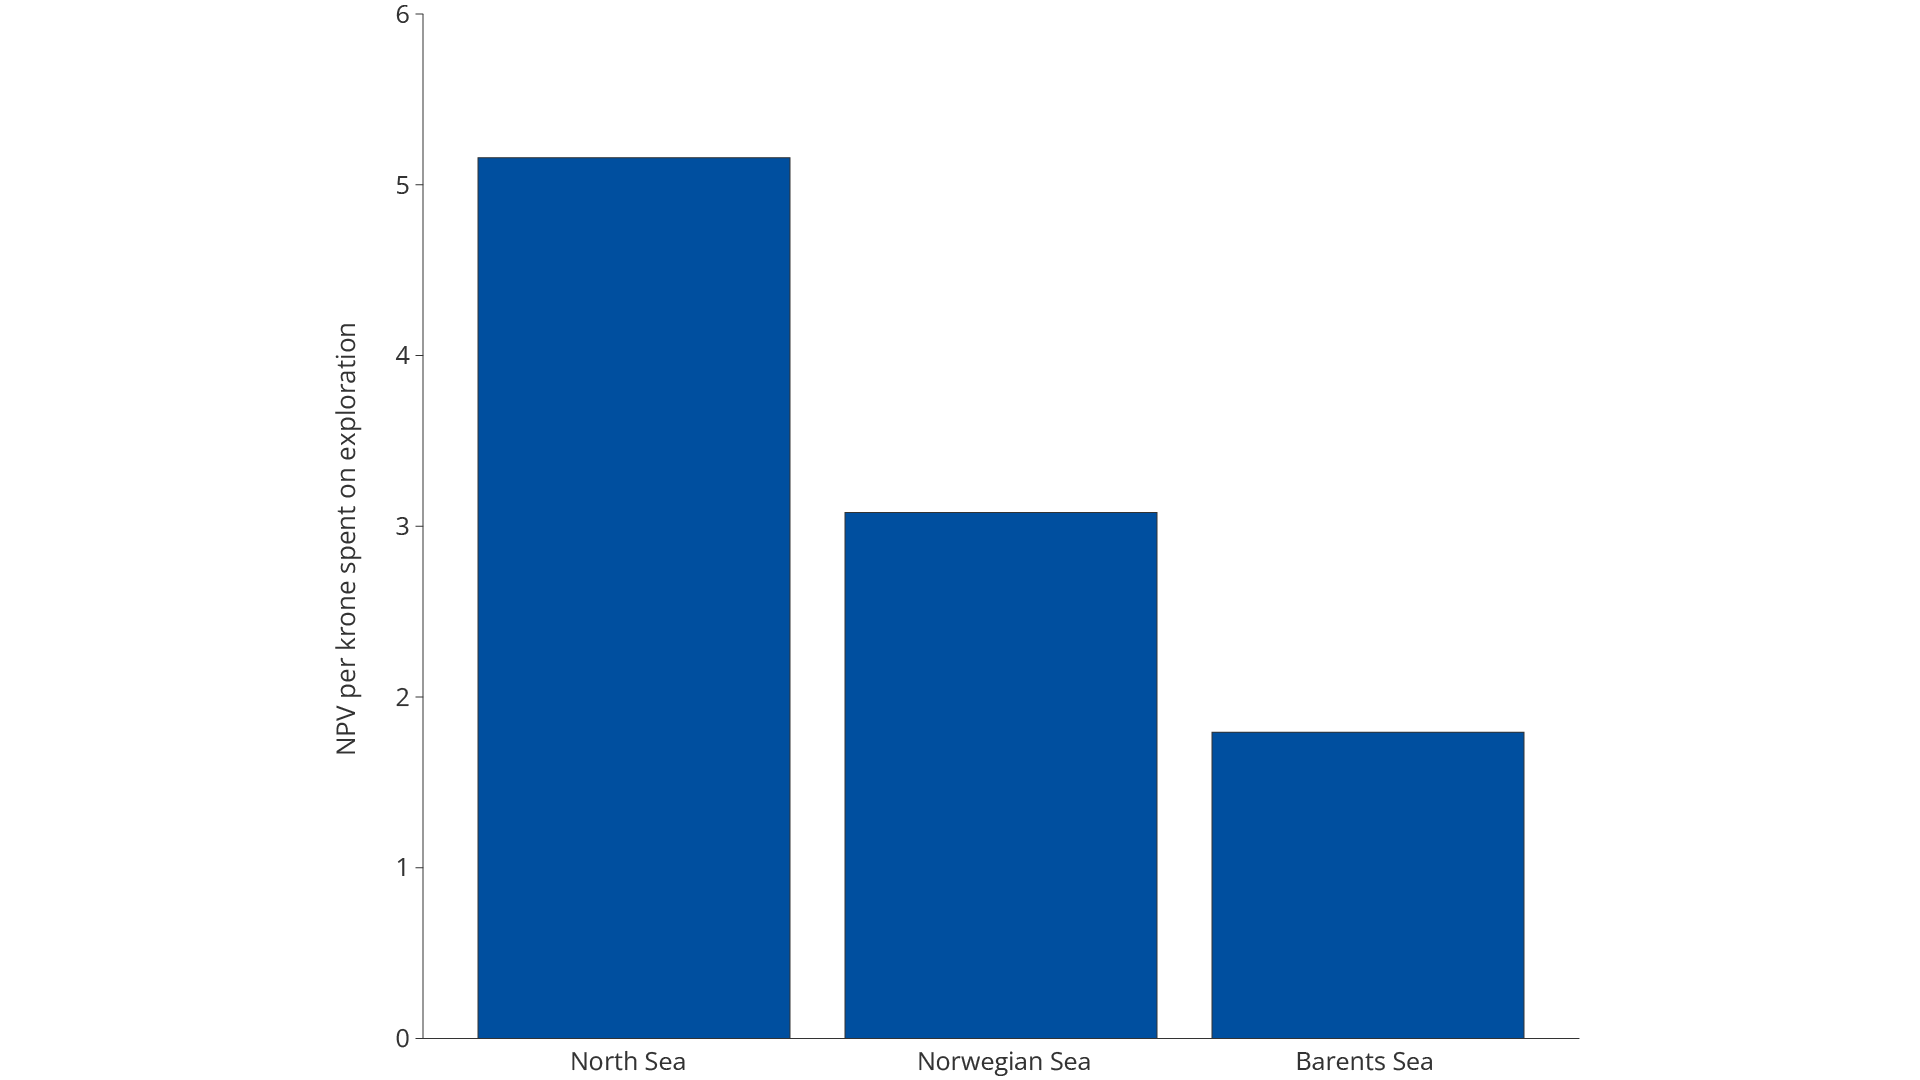
Figure 4.17 Profitability per krone spent on exploration by sea area in the period 2000–2025
In the Norwegian Sea, exploration returns approximately NOK 3 per krone invested in exploration. In the Barents Sea, the return is lower, but still positive, with a return of almost NOK 2 per krone invested.
Total exploration costs compared to the recoverable resources proven through exploration activities give an average discovery cost of approximately NOK 400 per scm oe. This equates to approximately USD 6 per barrel oe.
Additional values
The profitability analysis of exploration activities in the period 2000–2025 shows the direct economic costs and the direct financial revenues from discoveries made during the period.
Direct revenues include total revenues from recovery and sale of oil and gas, which in turn is determined by production volumes and prices of oil, gas and NGL (natural gas liquids). Similarly, direct costs will include investments, use of equipment, labour and energy for exploration, development and operation of the projects.
There are several additional values from exploration activities beyond the direct value of the profitable discoveries. These are not included in the profitability calculations. For example, most discoveries made today are not large enough to be developed as stand-alone projects but are valuable as satellites for existing facilities.
These additional volumes can make it possible to extend the field's lifetime significantly, which in turn can add considerable value. The longer a field is in production, the more resources it will produce, and the more new discoveries can be tied back to the field.
New discoveries can also postpone a costly shutdown of facilities on host fields, which can also be of significant value to surrounding discoveries and exploration opportunities. New discoveries also help to maintain a resource base for common infrastructure. The discoveries can keep pipelines, process plants and terminals operating longer and reduce unit costs for all users.
These are indirect additional economic effects, which in this context are revenues and costs not reflected in the basis for calculating the profitability of exploration.
The player landscape
In this chapter:
The companies are grouped by strategy and business area, including size (in terms of market value), geographical origin, placement in the value chain and interests in production licences. See a more detailed description of the company categories in the table below.
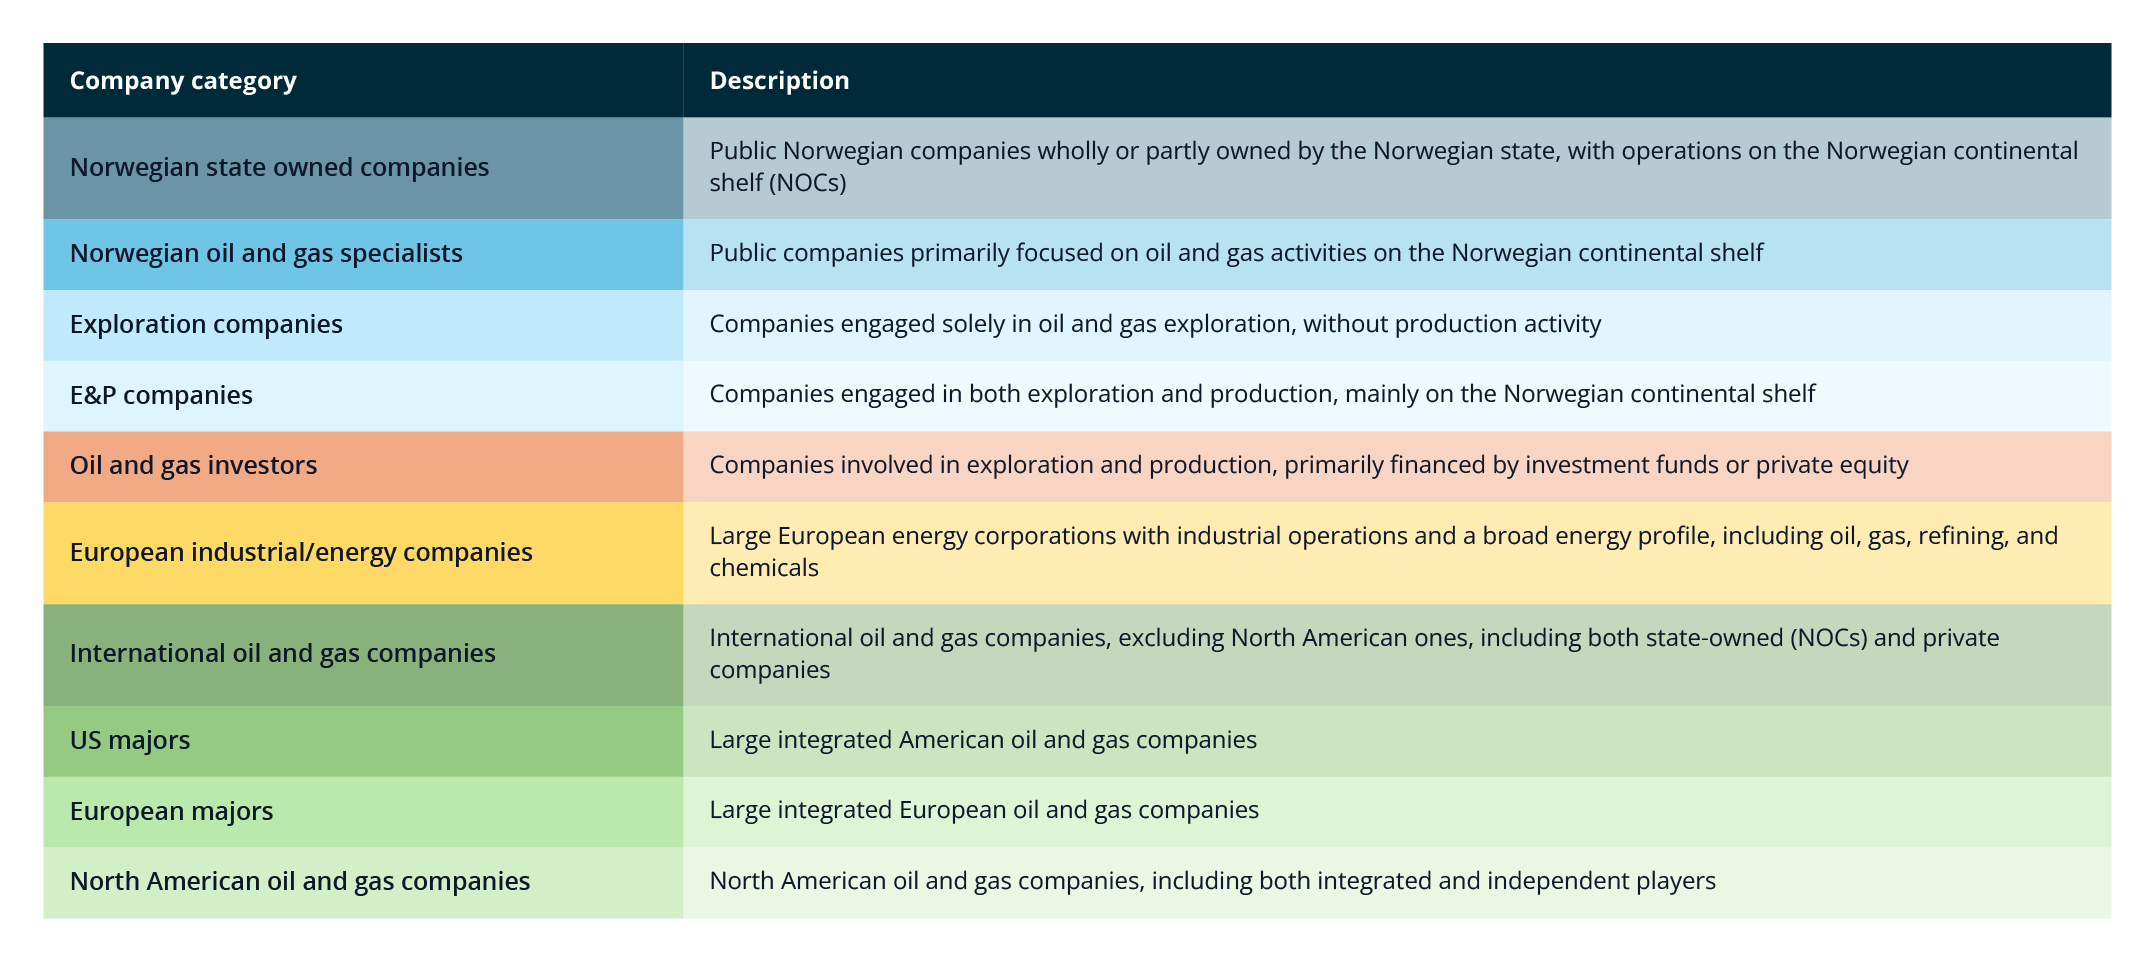
Table 5.1 Company categories
Figure 5.1 shows all companies that were active as of 31.12.2025.
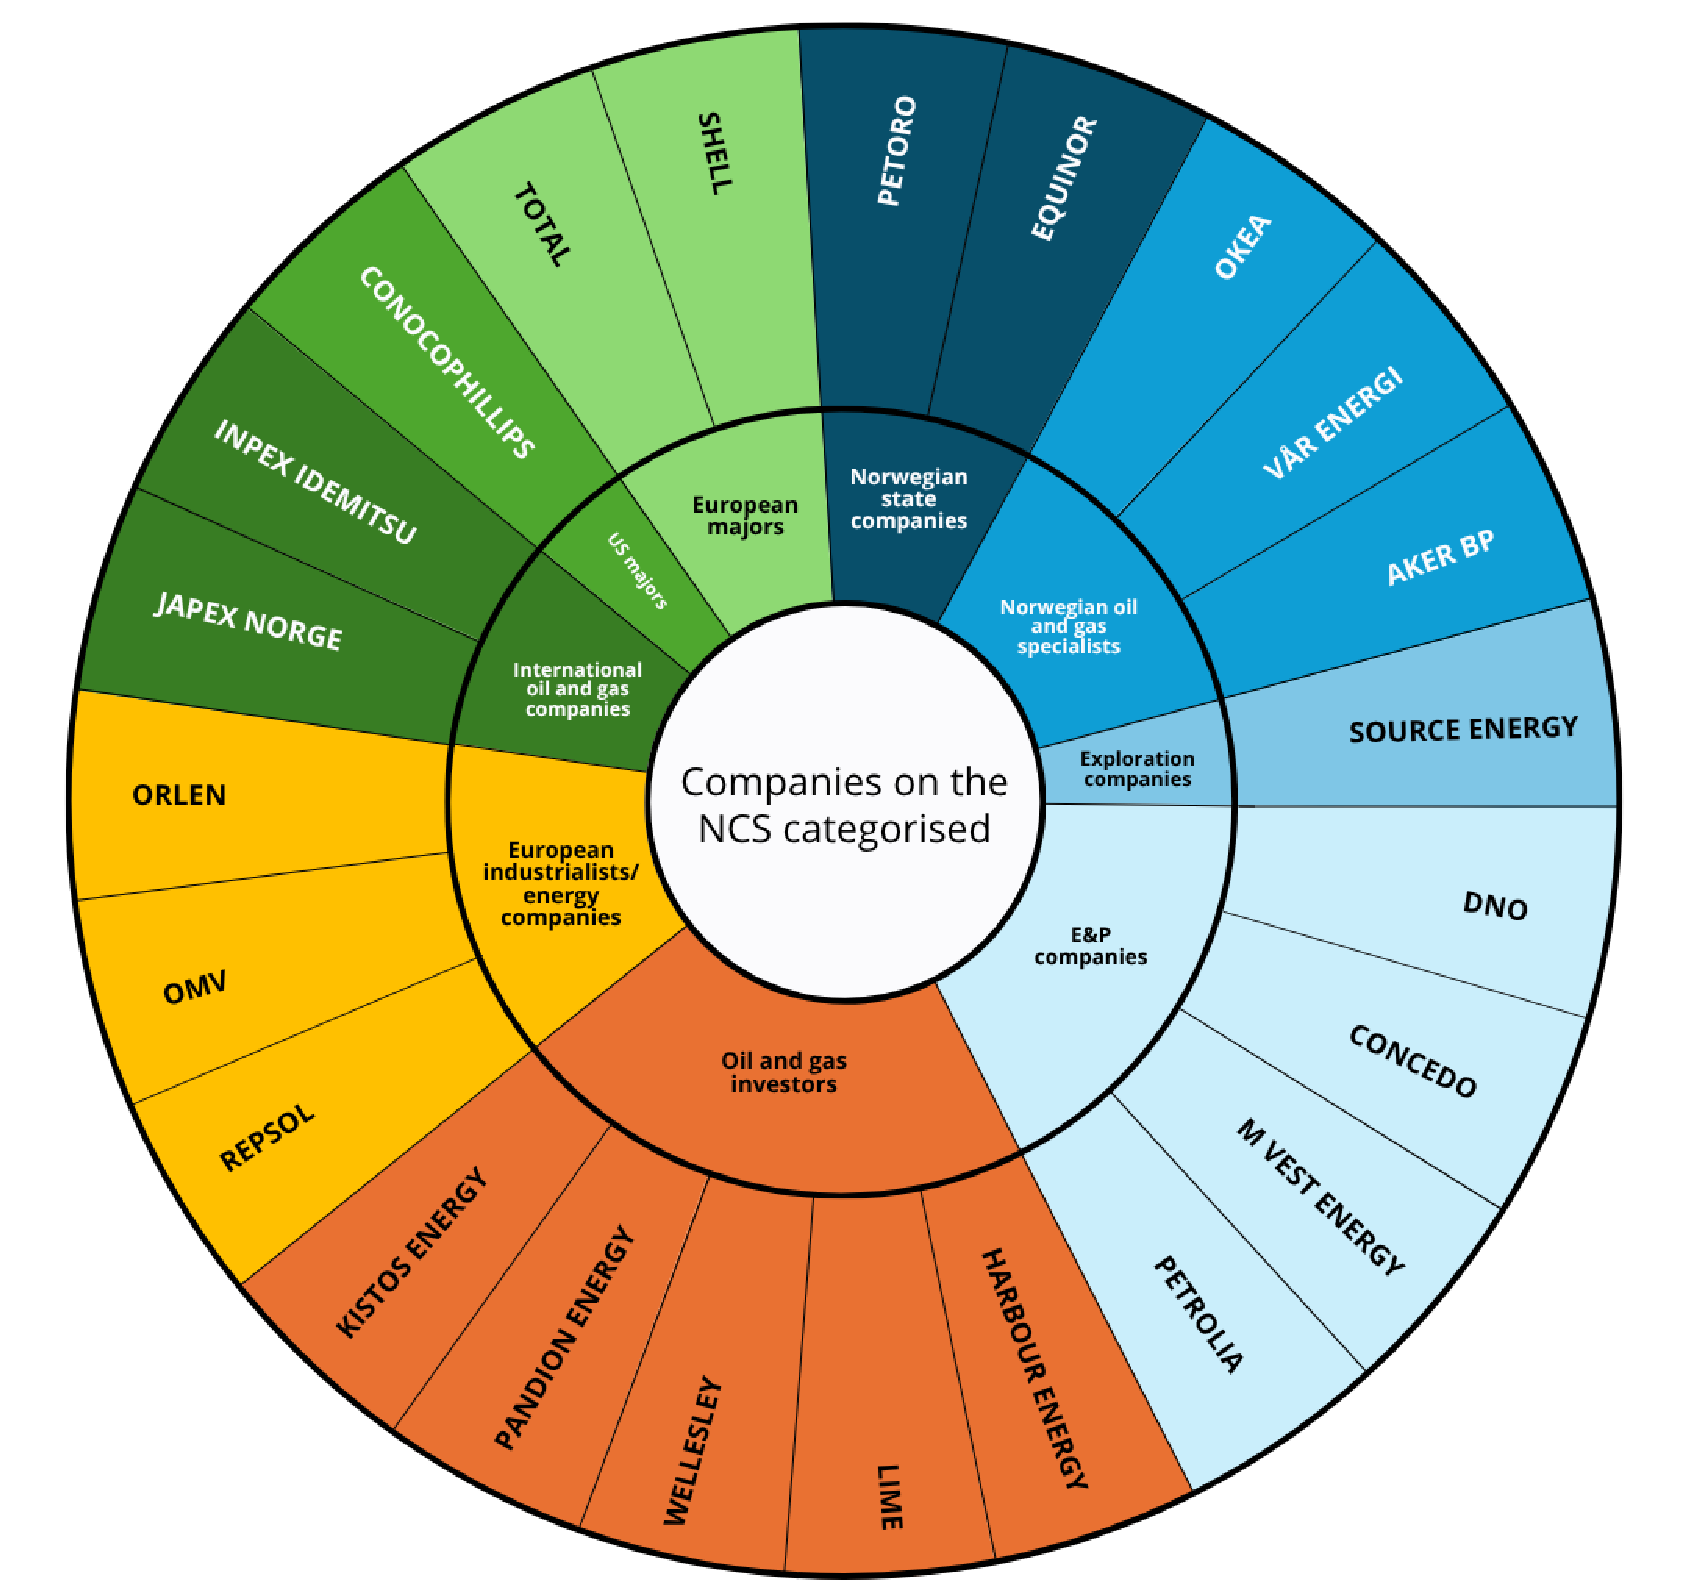
Figure 5.1 Company types and companies on the Norwegian continental shelf (31.12.2025)
The composition of companies on the Norwegian continental shelf (the player landscape) has changed significantly over the past 25 years. Following a period of increase towards 2013, the number of active players in 2025 has more than halved from the 2013 level (see Figure 5.2).
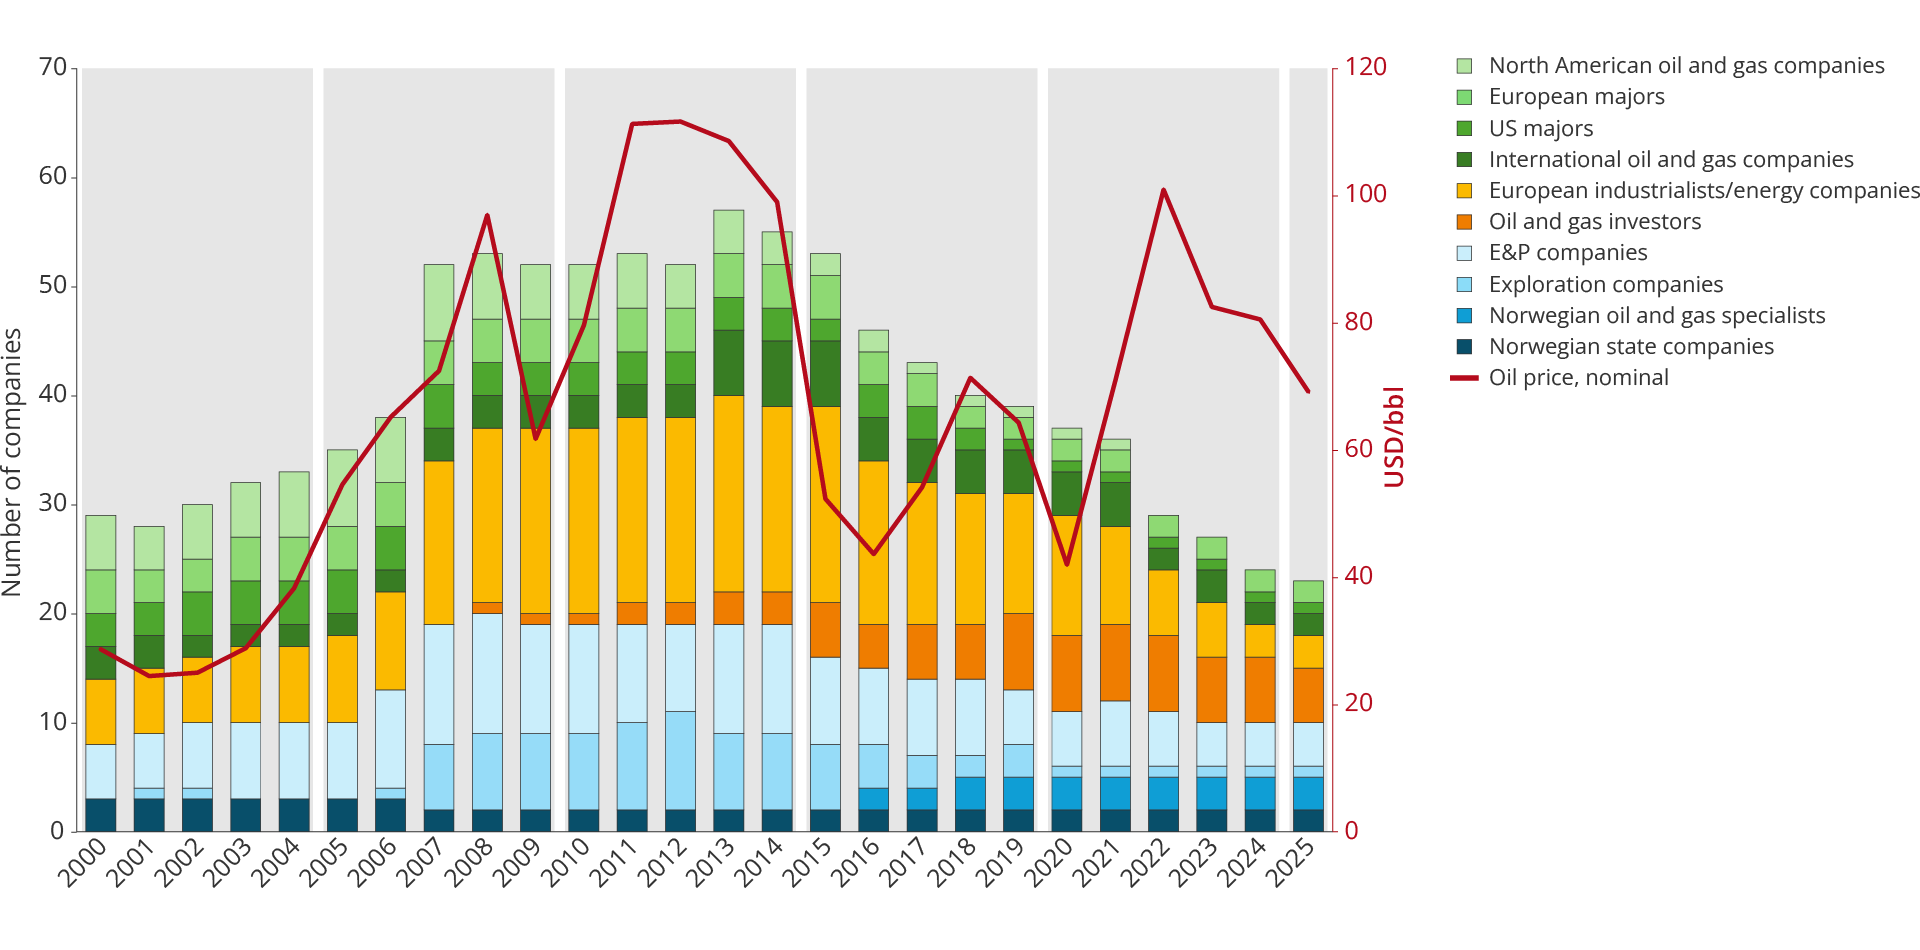
Figure 5.2 Development in the number of companies on the NCS by company category 2000–2025
Fewer players can weaken diversity in the exploration phase. Diversity provides more independent geological assessments which can increase the likelihood of large discoveries, especially in underexplored areas. In the development and operation phase, more players can strengthen competition, which contributes to increased efficiency and innovation through different technological approaches and business models. However, more players can make coordination and commercial negotiations more challenging.
Developments in the player landscape 2000–2025
2000–2004: The legacy of the 1990s
This period marked the end of an established development on the NCS. The player landscape from the late 1990s was largely continued, particularly in the exploration phase.
Few and large players dominated the shelf, with Statoil and Norsk Hydro playing key roles. These were supplemented by major international oil companies, such as Shell, Total, ExxonMobil and ConocoPhillips.
Statoil was listed on the stock exchange in 2001, and Petoro was established as the manager of the State's Direct Financial Interest (SDFI).
The exploration phase
The introduction of the scheme for Awards in Predefined Areas (APA) in 2003 was an important reform but did not result in immediate changes to the player landscape. Exploration activity was low, and in 2004 only eight exploration wells were spudded (see Figure 5.3)
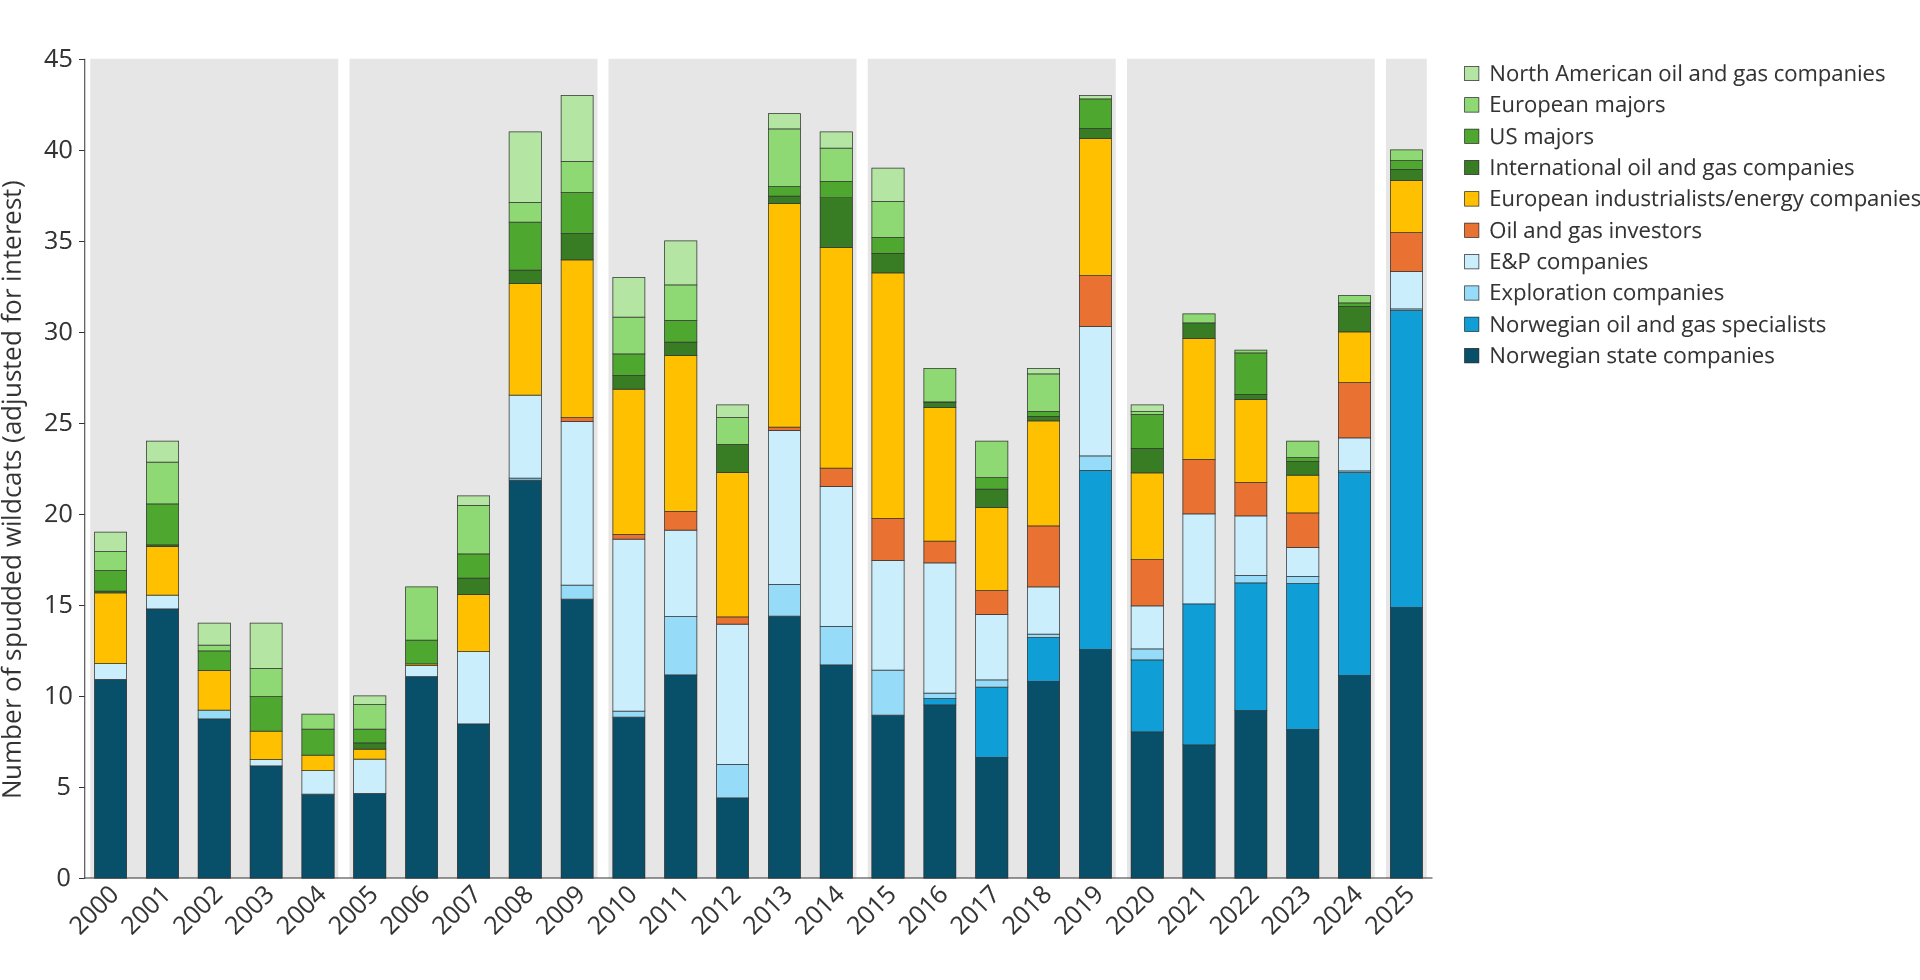
Figure 5.3 Spudded wildcats by company category (licensees)
Development and operation phase
In the development and operation phase, Statoil and Norsk Hydro were the dominant companies during the period and accounted for the largest share of production (see Figure 5.4).
The player landscape was characterised by continuity and few changes in operatorship. The licensees on fields such as Kristin and Ormen Lange continued the concentrated ownership structure from the 1990s.
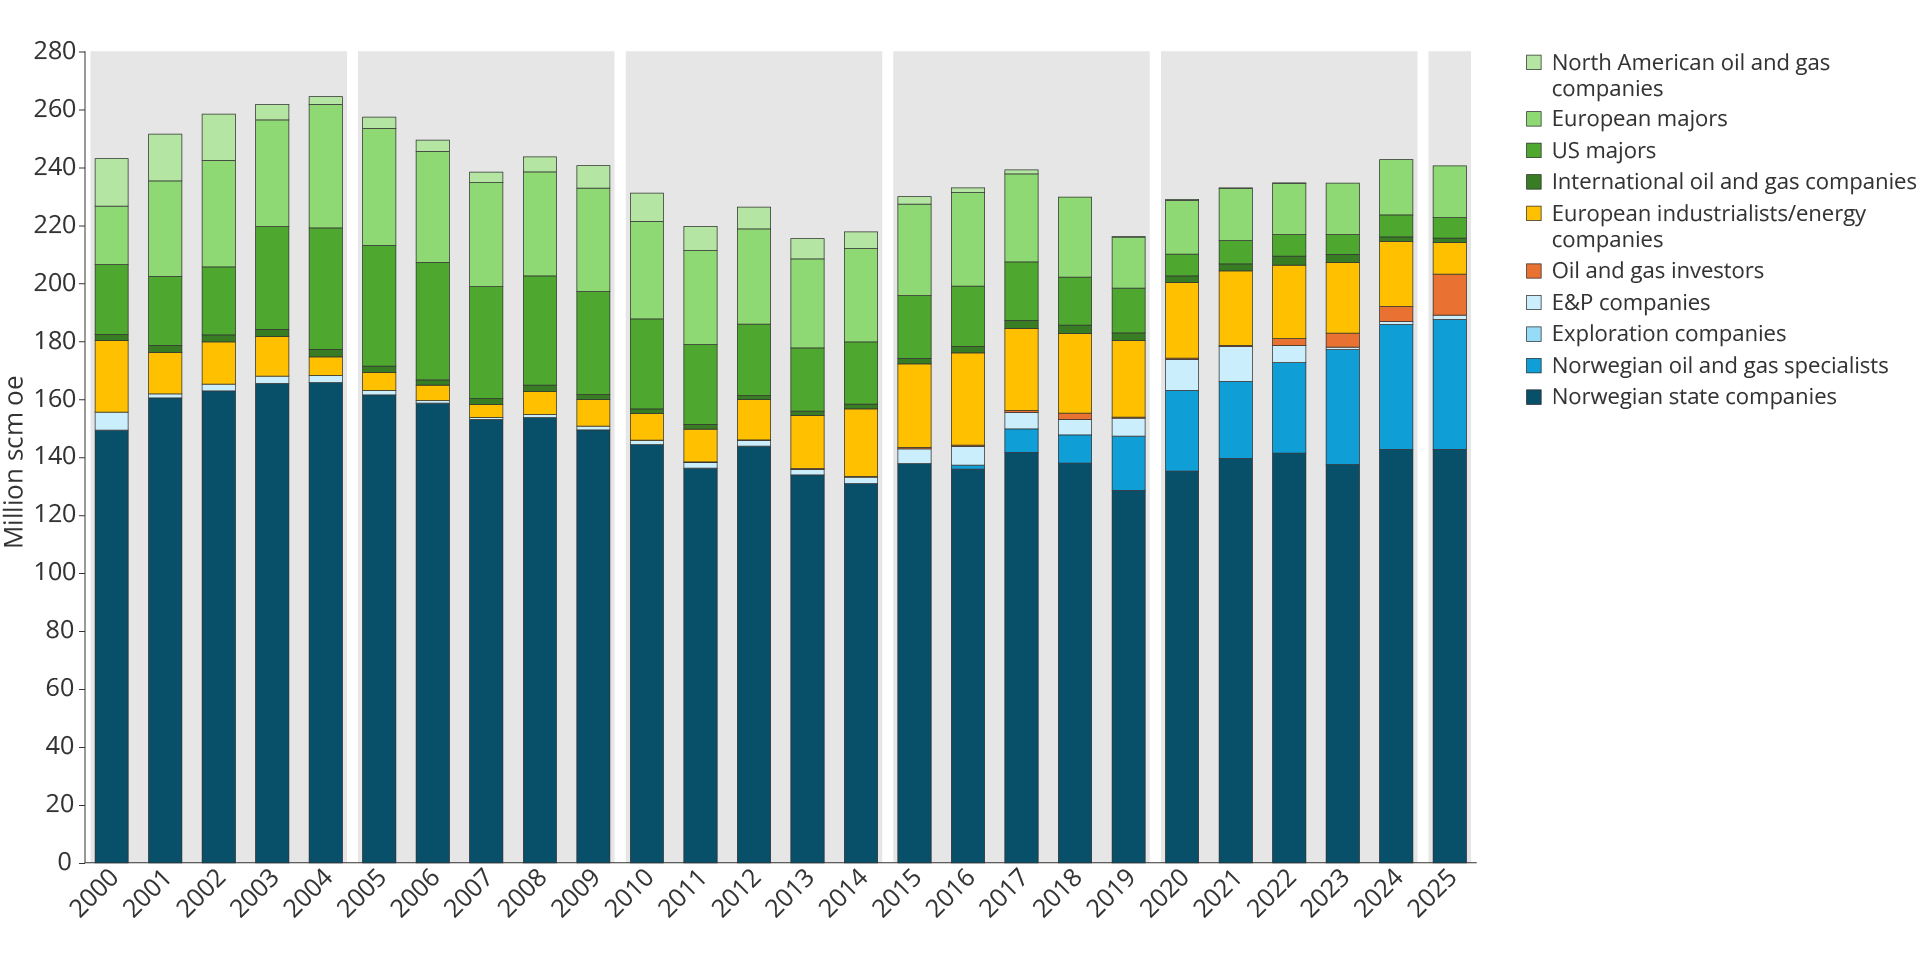
Figure 5.4 Development in production by company category (licensees)
2005–2009: Oil price upturn, exploration reimbursement and new players
The exploration phase
The introduction of the exploration reimbursement scheme in 2005 led to several smaller companies entering the shelf. From this point on, exploration companies that were not in a tax-paying position were entitled to have 78 per cent of their exploration costs reimbursed directly by the government. The risk associated with drilling a dry well was significantly reduced and paved the way for companies with limited equity to finance their exploration activity.
The combination of the exploration reimbursement scheme and an oil price climbing steadily towards USD 100 per barrel made the NCS attractive to new players. The result was a wave of new exploration companies.
Companies such as Det norske oljeselskap, Revus Energy, Rocksource and PA Resources established themselves as active applicants primarily in the APA rounds.
Lundin was one of several targeted and long-term medium-sized exploration players. The company built up a broad portfolio of activities from the North Sea to the Barents Sea.
Development and operation phase
The merger of Statoil and Norsk Hydro to form StatoilHydro in 2007 strengthened the state's role in the development and operation phase. In the same year, the Ormen Lange field came on stream with Shell as operator, and StatoilHydro completed the Snøhvit liquefied natural gas (LNG) plant. The Goliat field in the Barents Sea received PDO approval in 2009, with Eni as operator.
The projects demonstrate that both large Norwegian and international companies assumed operator responsibility for technologically challenging projects, also in Arctic regions.
The contrasts between the diverse player landscape in the exploration phase and a more concentrated player landscape in the operational phase became more apparent during this period.
2010–2014: Economic boom and Johan Sverdrup
The exploration phase
High oil prices combined with the exploration reimbursement scheme improved framework conditions for exploration activities. The number of companies participating in the APA rounds and in the numbered licensing rounds reached historically high levels.
In 2010, the 16/2-6 well that proved Johan Sverdrup was drilled by Lundin. This demonstrated that the NCS can still deliver world-class discoveries. It also signalled that such results are not reserved exclusively for the largest companies.
Towards the end of the period, from 2012–2014, the high level of exploration activity both globally and on the NCS contributed to a sharp increase in costs (see Figure 5.5). Rig rates, wages, and fees from service providers increased significantly. Profitability came under pressure despite high oil prices.
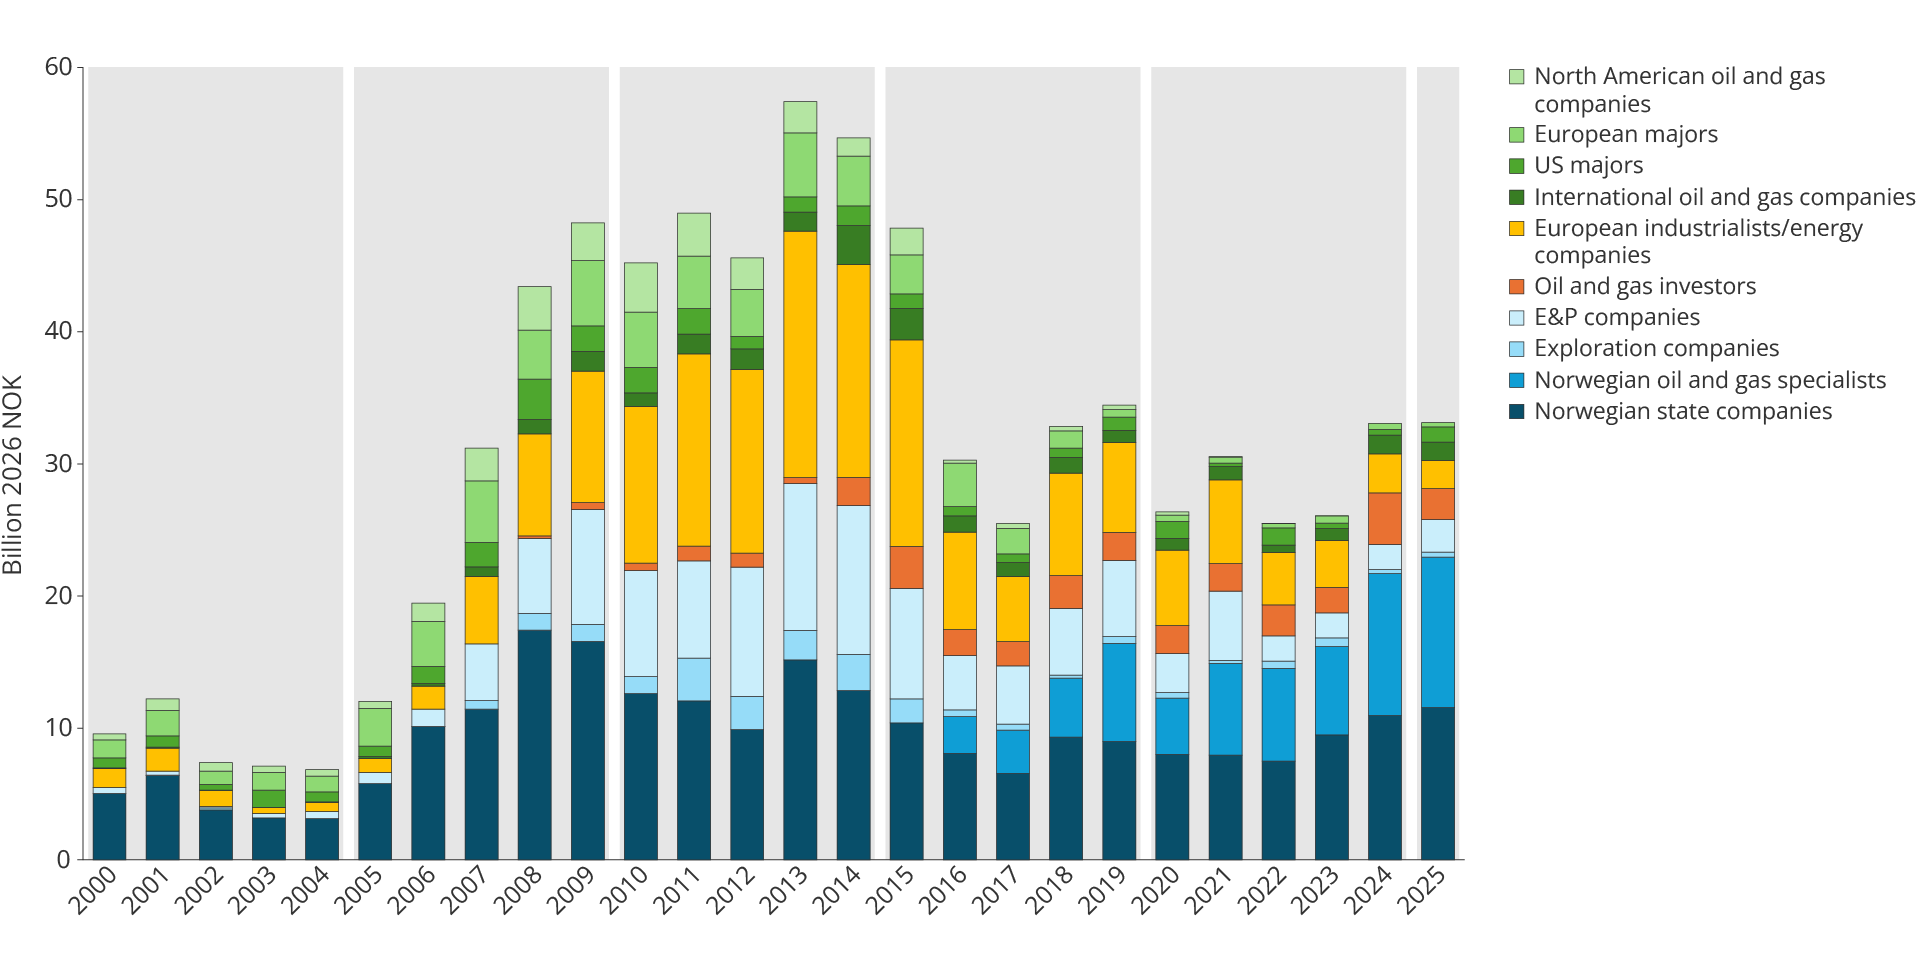
Figure 5.5 Exploration costs (exploration investments) by company categories (licensees) in the period 2000–2025
When the oil price drop hit in the summer of 2014, it targeted an industry already characterized by growing concern over cost levels.
Development and operation phase
The development and operation phase in the period 2010–2014 was characterised by a high level of activity (see Figure 5.6) and great ambitions, but also by increasing costs. Statoil retained its dominant position as operator and simultaneously had extensive international ambitions.
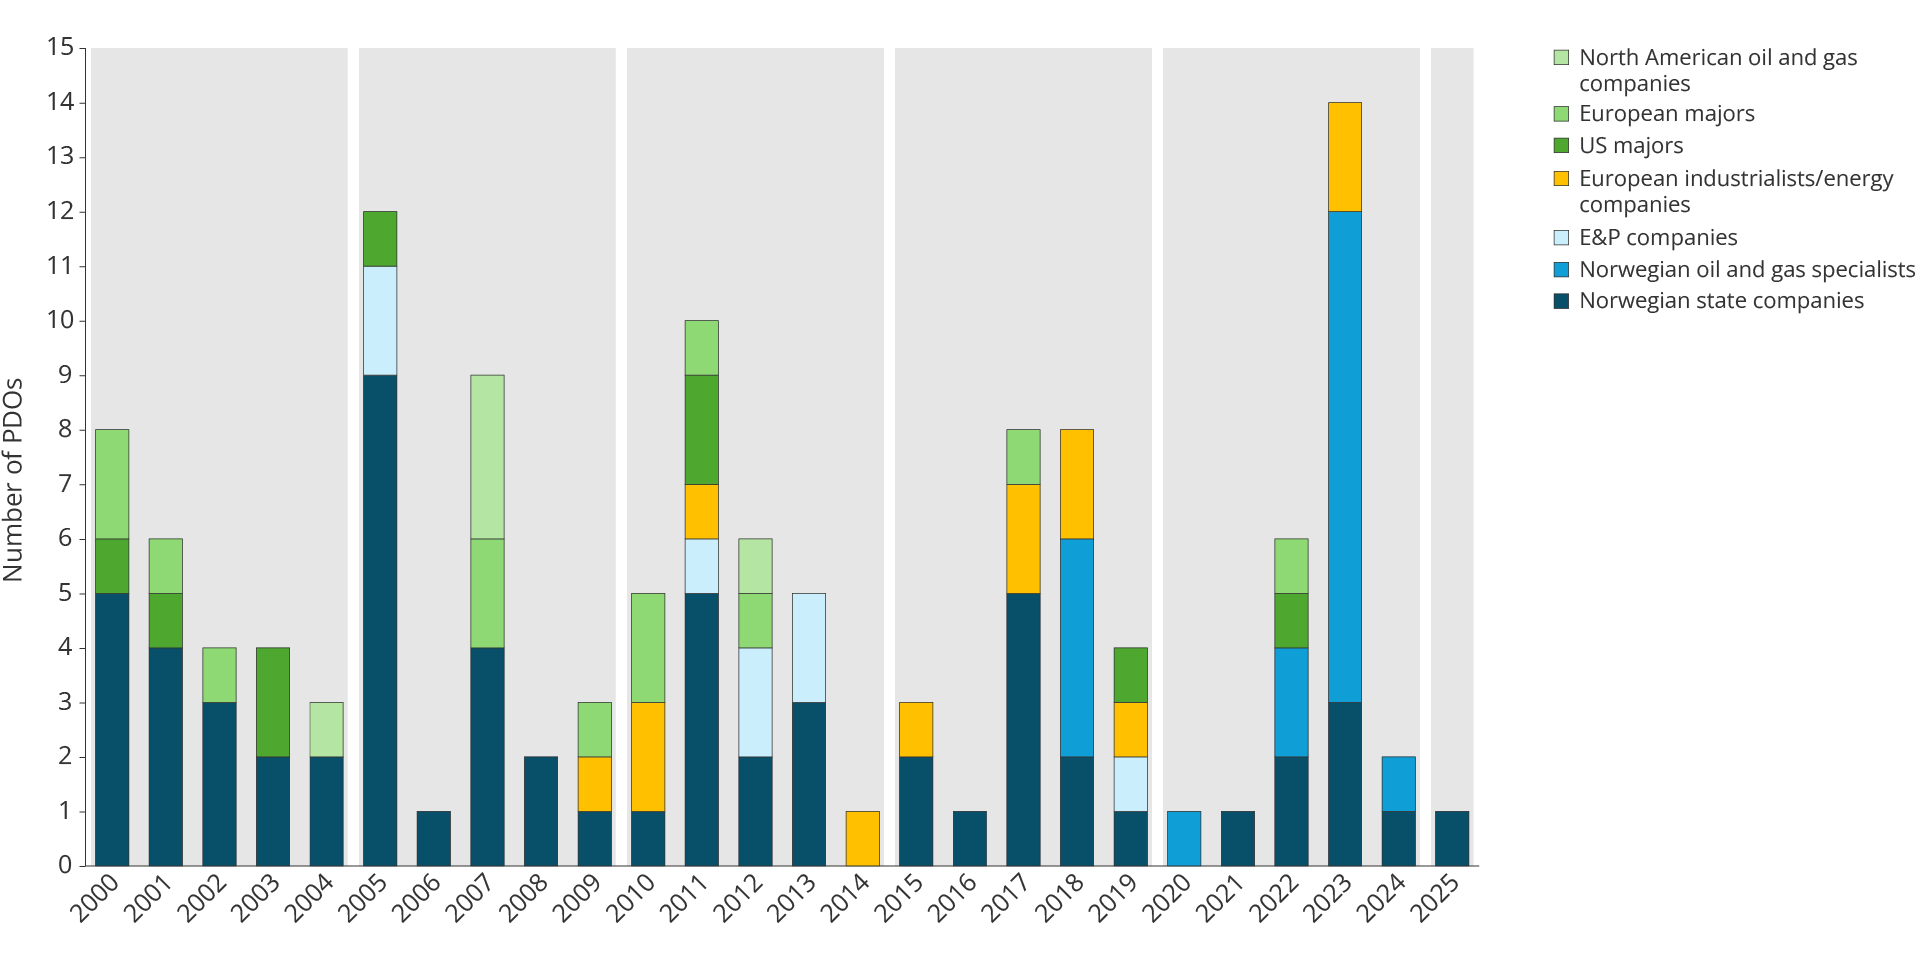
Figure 5.6 Approved PDOs per year by company category (operators)
2015–2019: Crisis and consolidation
The exploration phase
In the summer of 2014, oil prices began to drop. By January 2016, prices had been slashed from over USD 110 per barrel to below USD 30. This had drastic consequences for exploration activities. Exploration budgets were cut, rig contracts were terminated, and many smaller exploration companies found themselves financially challenged.
Several companies established between 2005 and 2014 had limited financial robustness and lacked the ability to handle a long-term drop in revenue, even with the exploration reimbursement scheme. The number of active exploration companies thus dropped markedly in the years following the oil price slump (see Figure 5.7).
Figure 5.7 Inflows and exits of companies on the Norwegian shelf (2000–2025)
During the boom from 2010 to 2014, the companies had ample access to capital for ambitious exploration strategies where high volumes were more important than a high probability of discovery. Following the oil price collapse, capital discipline became a key demand from both shareholders and lenders. As a result, the companies shifted their exploration portfolios towards smaller prospects close to existing fields and infrastructure, with a higher probability of discovery and shorter lead time to production (see Figure 5.8).
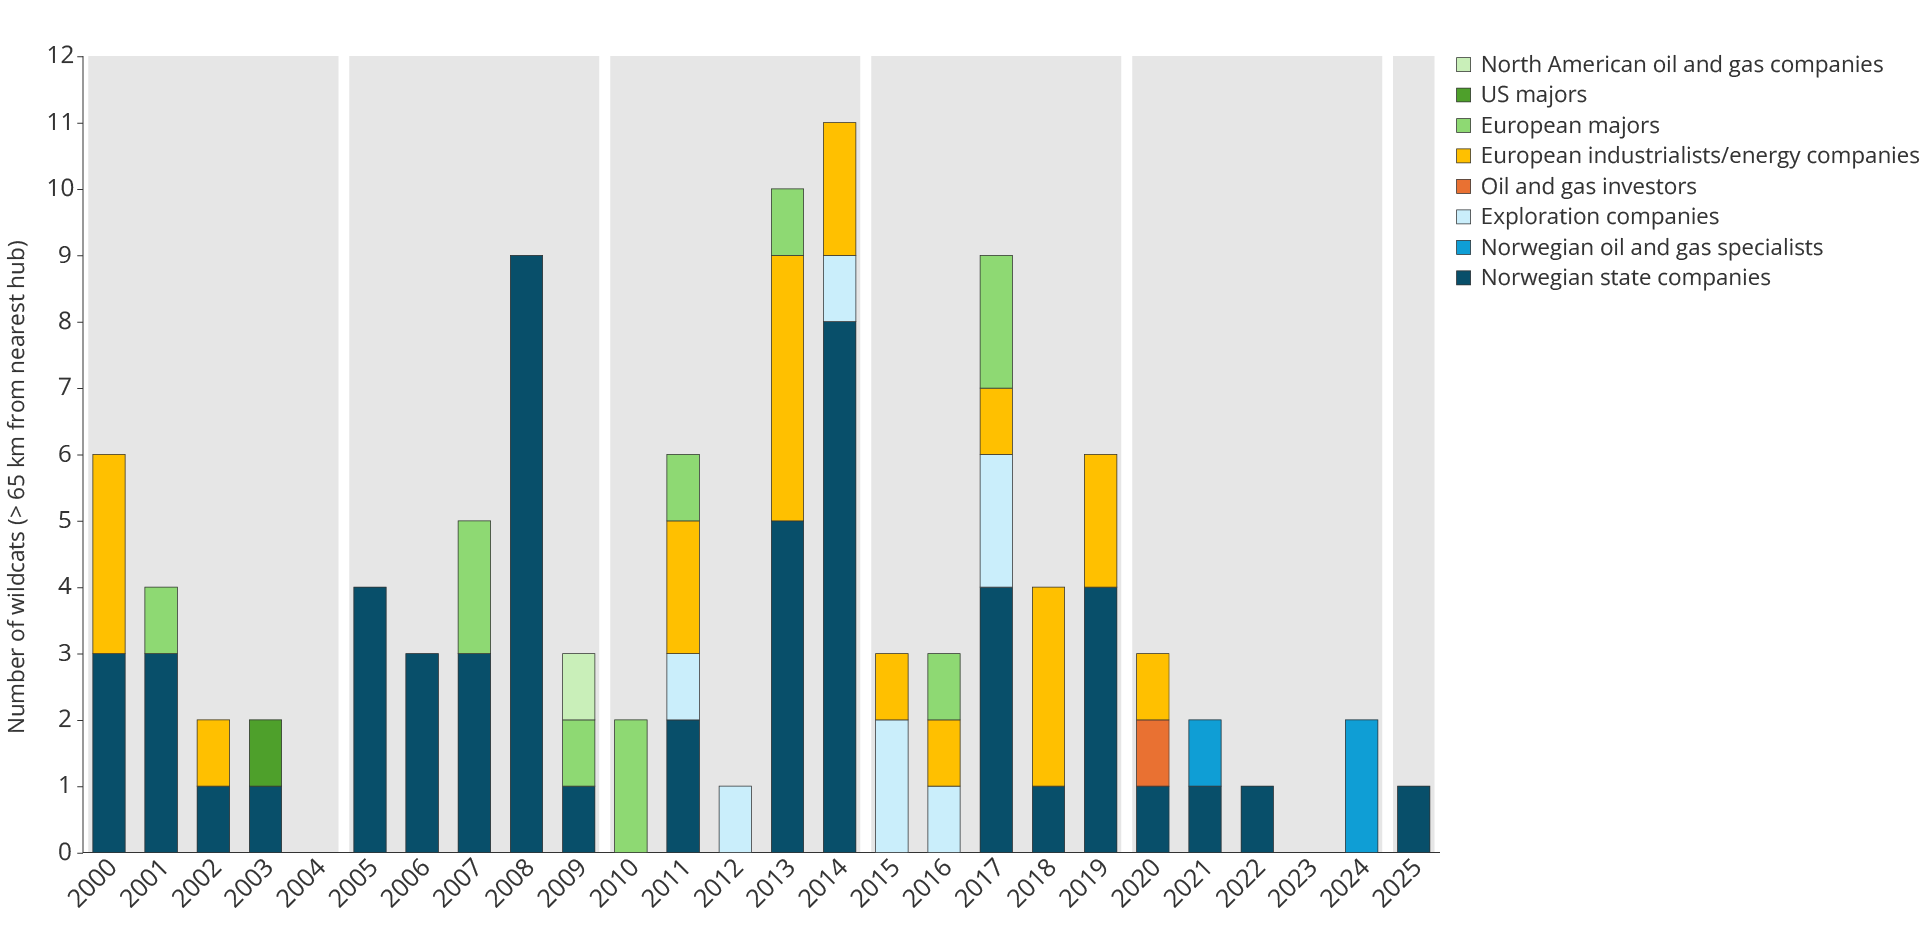
Figure 5.8 Exploration wells spudded at a distance > 65 km from the field centre, by company categories (operators)
Near-field exploration helped to maintain the level of activity but yielded few major discoveries (see Figure 5.9).
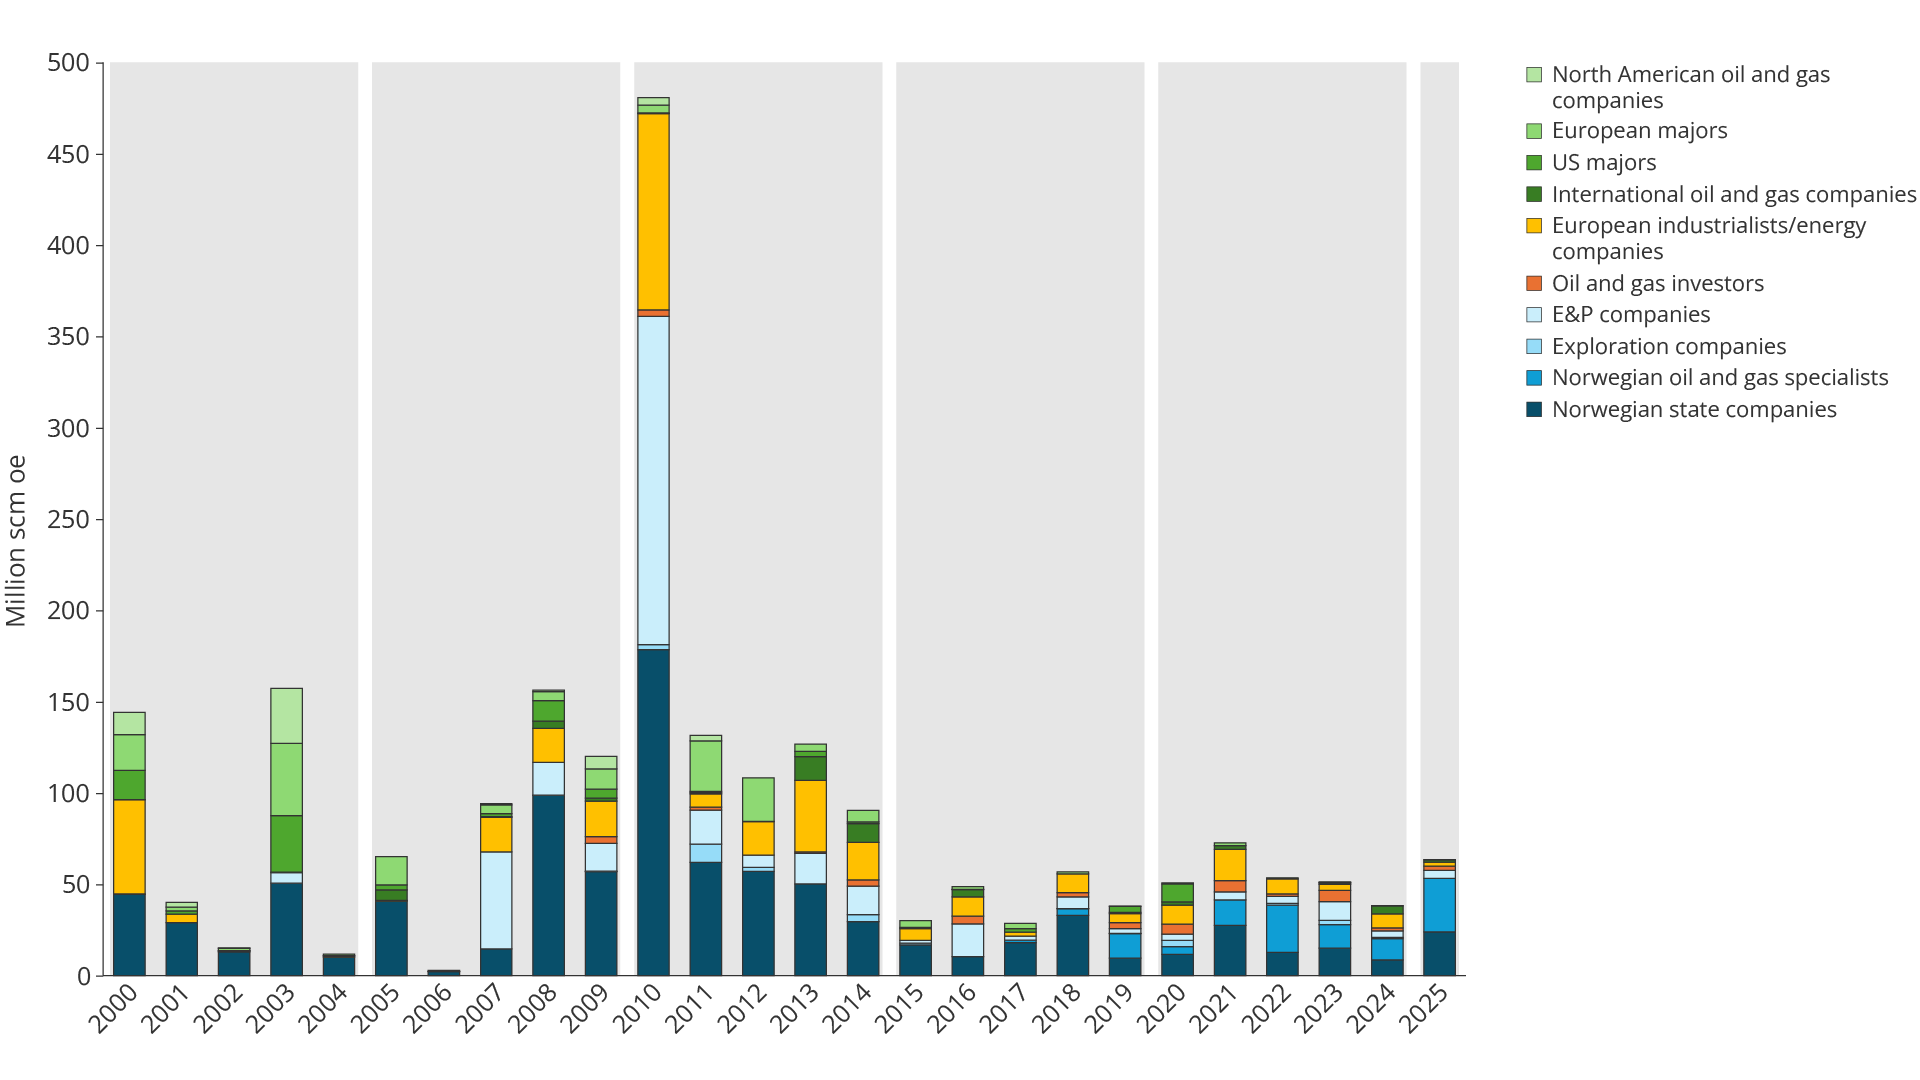
Figure 5.9 Annual discovery volume 2000–2025 (licensees)
The crisis led to consolidation among both small and medium-sized companies, whilst several large international companies withdrew from the NCS. As a result, the medium-sized companies have taken on an increasingly important role in the further development of the shelf.
Development and operation phase
The fall in oil prices led operators to reduce cost levels in both projects and operations. The largest project in the period was the development of Johan Sverdrup. The field was approved for development in 2015, with Equinor as operator and Lundin, Petoro, Det norske oljeselskap and Maersk as partners. The first development phase started production in October 2019 and was carried out within planned cost and time frames, and at a lower development cost per barrel than previously estimated.
In the operational phase, the most important structural change was the emergence of new and medium-sized operators, whilst several large international oil companies diminished their presence. Vår Energi was established in 2018 through the merger of Eni's Norwegian portfolio and Point Resources. In 2019, Vår Energi acquired ExxonMobil's upstream activities in Norway, after which ExxonMobil exited NCS. Shell and ConocoPhillips divested on the NCS in line with their global portfolio optimisations. The player landscape thus became more consolidated and more Norwegian-dominated.
2020–2024: The energy trilemma and Norwegian dominance
The period started with the Covid-19 pandemic, which led to a sharp fall in oil prices to USD 20–30 per barrel in the spring of 2020. The Norwegian authorities introduced temporary changes to the petroleum tax system to maintain investment activity and ensure companies' access to capital.
At the same time, international attention to climate risk and the energy transition gathered pace. The risk of depreciation in fossil resources became more important in investment decisions. This affected the player landscape differently from the oil price slump of 2014–2015.
The exploration phase
Increased focus on greenhouse gas emissions and stronger pressure from capital markets contributed to the remaining large international oil companies reducing their activity on the Norwegian shelf. A lack of materiality in ownership positions and in future opportunities was also important. As a result, exploration activities were increasingly dominated by specialised Norwegian and medium-sized European companies.
Aker BP emerged, particularly following the takeover of Lundin's operations in 2022, as one of the leading exploration players on the NCS, in addition to Equinor.
Development and operation phase
Production levels were high in the first half of the 2020s. Production from Johan Sverdrup and several new development projects helped to lift total production.
Aker BP became Norway's second largest operator, measured in production and resource base. The development of the Yggdrasil project, which incorporates the Fulla, Munin, Hugin and Hugin satellite fields, is the company's largest ongoing operator project and among the most significant developments on the NCS during the period.
In the operations phase, companies specialising in mature fields became more important. These players bought interests in producing fields which larger companies chose to divest. OKEA is one example of this type of player.
Overall, the player landscape in the development and operation phase can be described as more consolidated and increasingly Norwegian-dominated. Equinor, Aker BP and Vår Energi made up the majority of the operators, while Petoro, as manager of the SDFI, is a significant licensee. Norwegian companies thus held a stronger role in this phase than ever before.
2025: More Norwegian and more consolidated than ever
In 2025, the NCS appears more consolidated and Norwegian-dominated than previously. Equinor, Aker BP and Vår Energi are the most active operators in both the exploration and development and operations phases. The development in licensed acreage for operators from 2000–2025 is illustrated in Figure 5.10.
Figure 5.10 Production licences by company categories (operators) from 2000 to 2025
In the exploration phase, the Norwegian companies account for most of the activity.
The review of the period 2000–2025 shows increasing differences between the exploration phase and the development and operation phase. In the exploration phase, changes to the regulatory framework lowered the threshold for new entrants, particularly through the exploration reimbursement scheme and the APA scheme. Along with oil price developments, this contributed to a diverse player landscape and a large number of active companies on the NCS up to 2014.
In the development and operation phase, the entry barriers are higher. Operator responsibility requires financial strength, technological capacity and organisational robustness, which only a limited number of companies have. Equinor has played a leading role throughout the period, while the growth of Aker BP and Vår Energi is an important trend.
This trend is mainly driven by consolidation, rather than organic growth. Companies that have divested have transferred significant numbers of employees and activity to players such as Aker BP and Vår Energi.
The player and resource landscape 2025
Norwegian players have a large share of both reserves and resources. Figure 5.11 shows remaining reserves and resources distributed by different player groups.
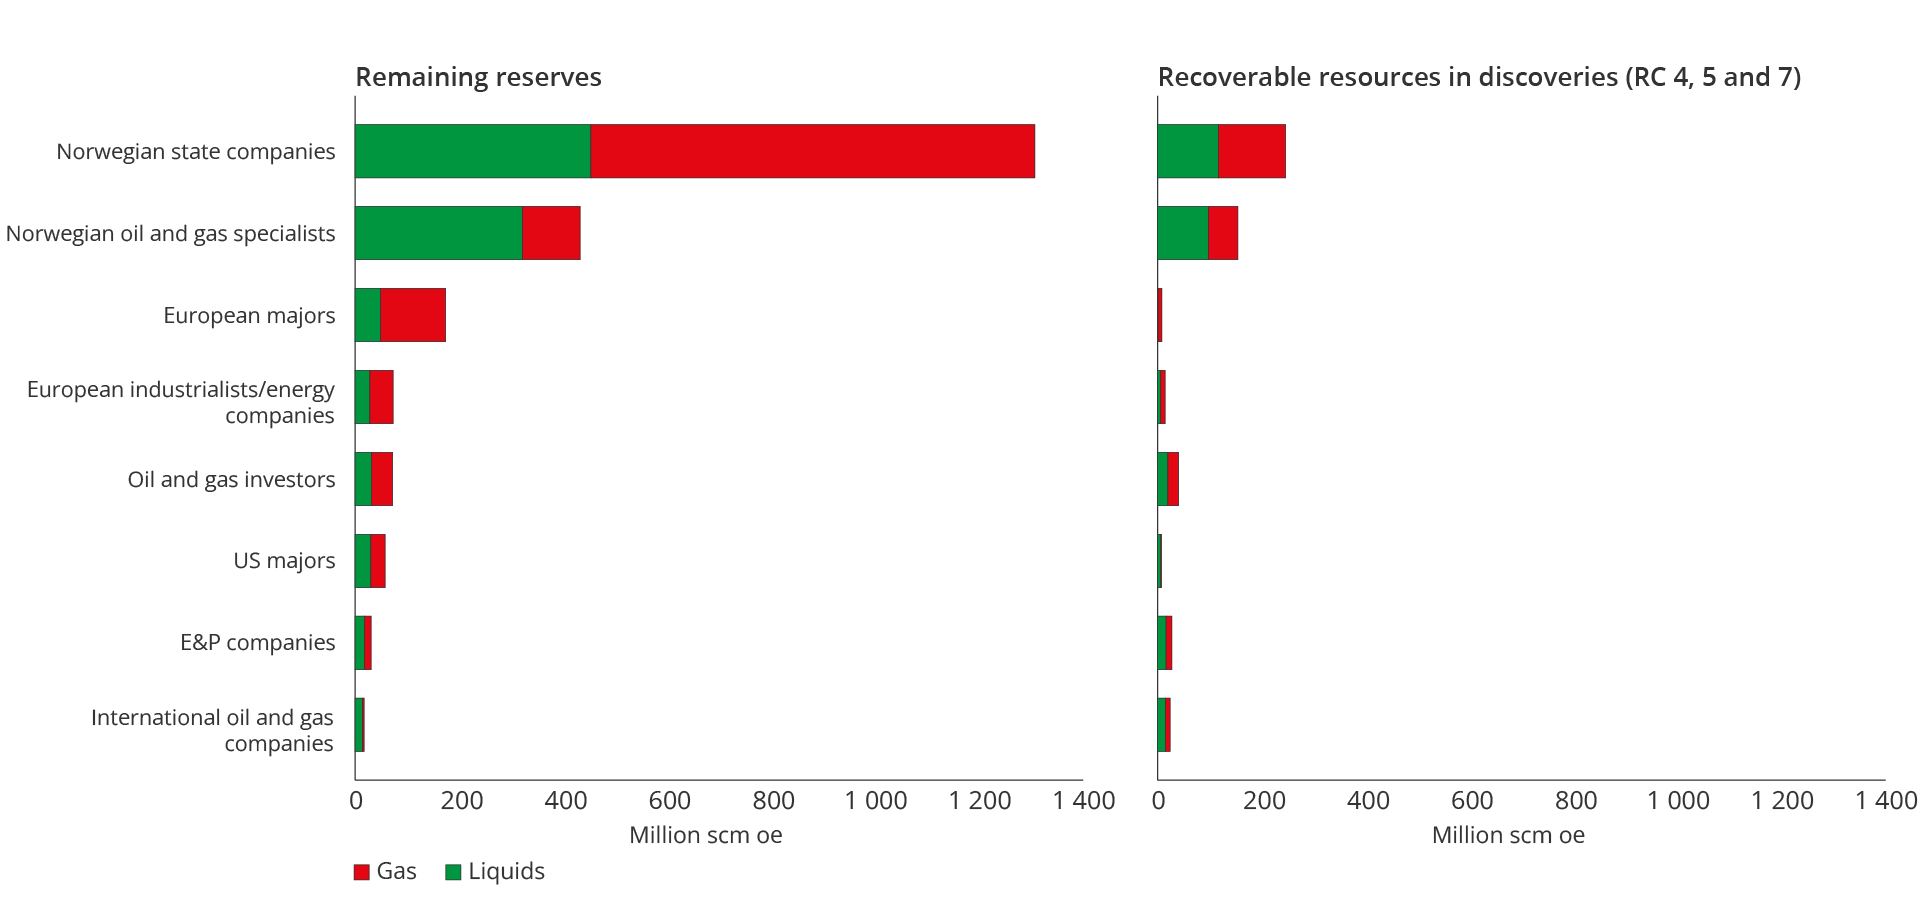
Figure 5.11 Remaining reserves and resources in discoveries by company category as of 31.12.2025
Figure 5.12 shows the development in remaining reserves and resources distributed by companies over time.
Figure 5.12 Remaining reserves (RC 1–3) and resources (RC 4, 5, 7F) per company between 2001–2025 (ten largest).
Diversity in the player landscape
The exploration phase
In the exploration phase, diversity has been important for efficient exploration of the shelf. Historically, the framework has facilitated various geological assessments, which has contributed to discoveries also in areas previously relinquished.
Johan Sverdrup represents the best documented case. The discovery was made after established companies had given lower priority to the Utsira High based on the prevailing interpretive framework(37).
This proves that areas are assessed differently by different players, and that a breadth of professional approaches is important in order to prove as many resources as possible. Nevertheless, diversity of ideas does not necessarily follow directly from the number of players (see fact box).
Different forms of diversity in exploration
Player diversity
Player diversity means that companies with different strategies, risk tolerance and professional communities participate in exploration activities. On the NCS, this diversity has been reduced since several large international companies elected to withdraw. At the same time, consolidation has led to fewer specialised exploration companies, which have historically contributed with alternative geological assessments. Lundin is a prime example.
Methodological and ideological diversity
Several important discoveries on the NCS have come about due to breakdowns in established geological consensus, including Edvard Grieg and Johan Sverdrup. Such discoveries require that the companies have the risk appetite to test alternative geological hypotheses by drilling exploration wells. The challenge arises when divergent hypotheses are not tested in practice.
Financial diversity
Financial diversity refers to the participation of players with different time horizons, risk appetite and access to capital in exploration activities.
Development and operation phase
In the development and operation phase, a large number of players can strengthen competition, but can also make coordination and commercial negotiations more demanding.
At the end of 2025, 9 of the 23 companies on the NCS were operators in the development and operation phase. Figure 5.13 illustrates the total production by operator.
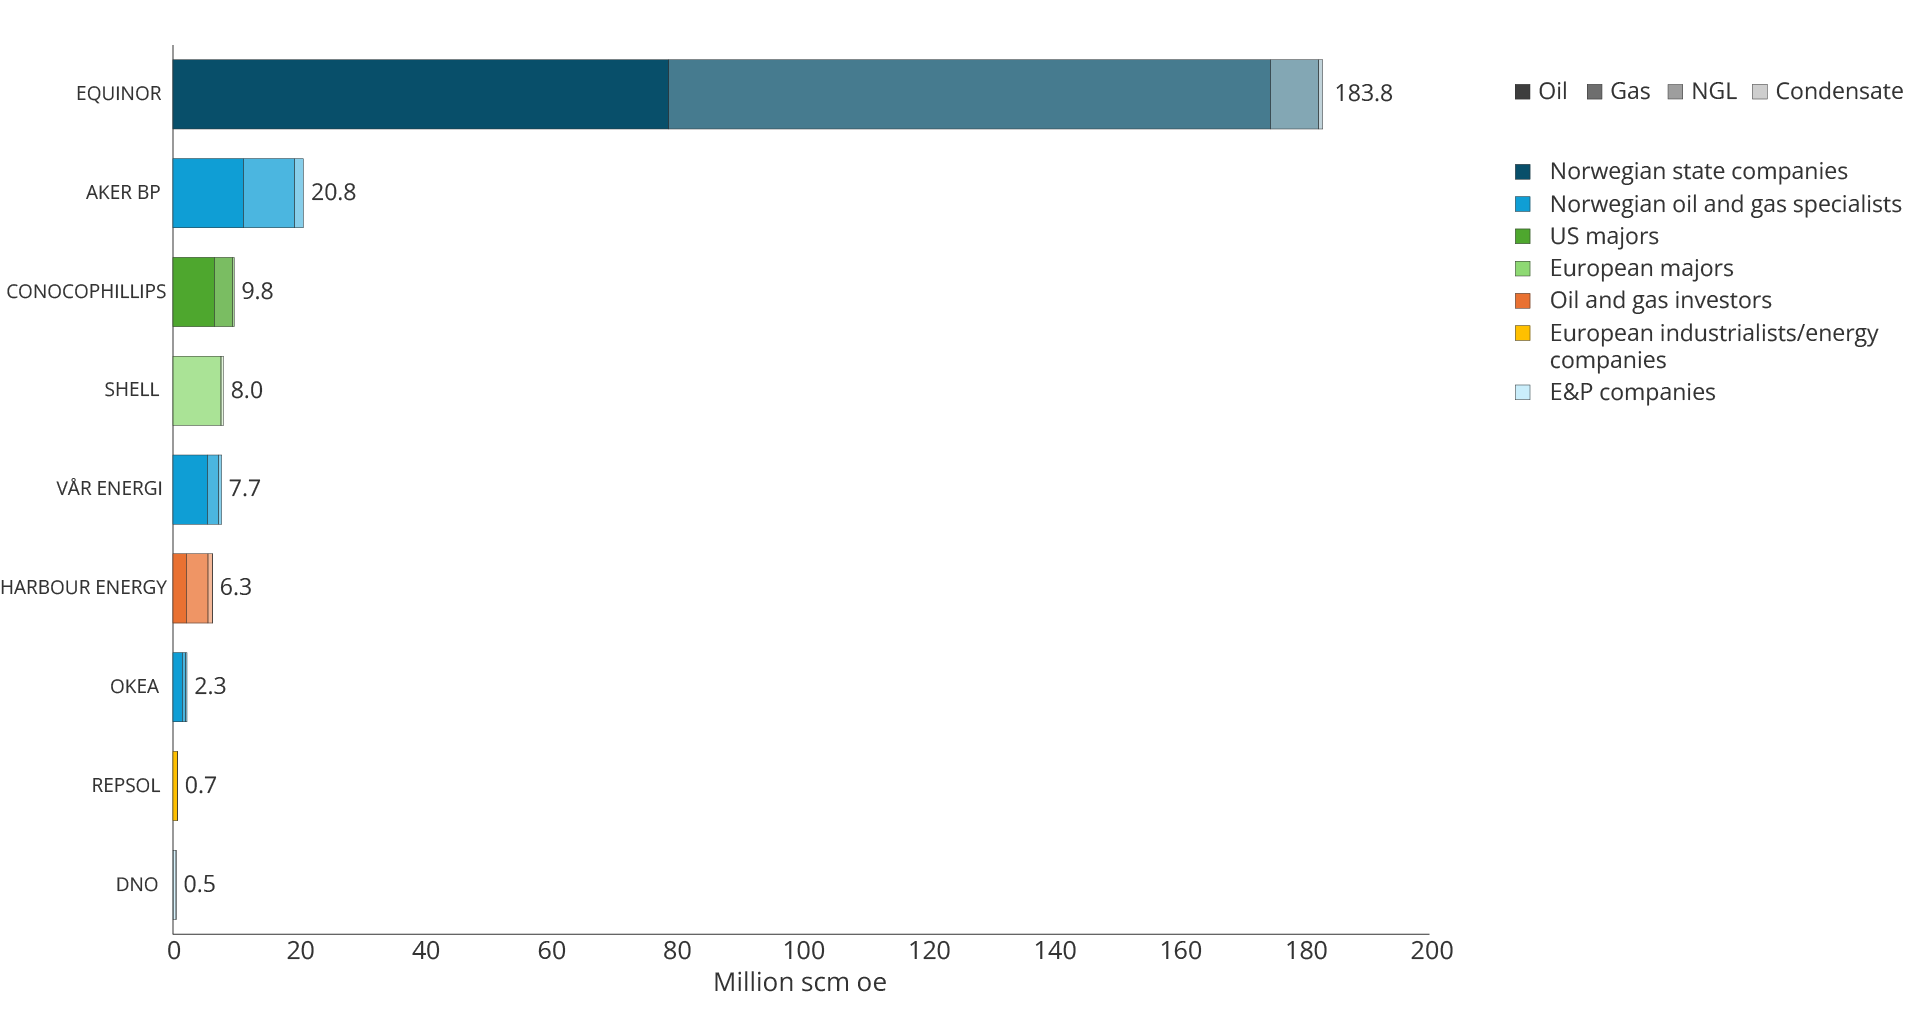
Figure 5.13 Total production by operator in 2025. The volumes are not adjusted for the operators' ownership interests, but reflect total production of the fields which the companies operate.
The figure illustrates that the Norwegian operators dominate. They accounted for a total of 89 percent of production in 2025.
The challenge ahead is not primarily the number of players, but ensuring that the diversity of geological assessments, risk approaches and time horizons is sufficiently large. This, coupled with healthy competition, is crucial to realising the potential in those parts of the shelf remaining to be explored and developed.
References
- The Norwegian Offshore Directorate (2026): Resource accounts as of 31.12.2025. Download: https://www.sodir.no/aktuelt/publikasjoner/rapporter/ressursregnskap/ressursregnskapet-2025/
- Menon Economics, Statistics Norway (2025): Sysselsettings-, verdiskapings- og skatteeffekter av petroleumsvirksomheten i norsk økonomi. Menon publikasjoner 8/2025. Last ned: https://menon.no/uploads/images/2025-8-Sysselsettings-verdiskapings-og-skatteeffekter-av-petroleumsvirksomheten-i-norsk-%C3%B8konomi.pdf
- Norwegianpetroleum.no (2026): Government revenues. Download: https://www.norskpetroleum.no/okonomi/statens-inntekter/
- The Norwegian Offshore Directorate (2025): Resource accounts as of 31.12.2025, Undiscovered Resources. Download: https://www.sodir.no/en/whats-new/publications/reports/resource-accounts/resource-accounts-2025/undiscovered-resources/
- Copenhagen Institute of Future Studies (2026): Technology megatrends for O&G towards 2050. Contact: Martin Kruse - Director of Sustainability and Resources & Futurist at CIFS; mkr@cifs.dk
- Ministry of Finance (2021): Rundskriv R-109/2021 - Prinsipper og krav ved utarbeidelse av samfunnsøkonomiske analyser. Download: https://www.regjeringen.no/globalassets/upload/fin/vedlegg/okstyring/rundskriv/faste/r_109_2021.pdf
- Pereira Nunes, J. P., G. S. Seabra, L. C. de Sousa (2024): A review of CO2-injection projects in the Brazilian Pre-Salt - Storage capacity and geomechanical constraints. International Journal of Greenhouse Gas Control, Volume 137,104232. Download: https://doi.org/10.1016/j.ijggc.2024.104232
- Ebuka, D., S. R. McDougall, E. J. Mackay (2025): Impact of relative timing of low salinity and polymer flooding on mechanisms by which oil recovery is improved. Scientific Reports, Volume 15, 27170. Download: https://doi.org/10.1038/s41598-025-12863-1
- Piñerez Torrijos, I. D., T. Puntervold, S. Strand, T. Austad, T. H. Bleivik, H. I. Abdullah (2018): An experimental study of the low salinity Smart Water - Polymer hybrid EOR effect in sandstone material. Journal of Petroleum Science and Engineering, Volume 164, pages 219-229. Download: https://doi.org/10.1016/j.petrol.2018.01.031
- Ministry of Petroleum and Energy (2010): Økt utvinning på norsk kontinentalsokkel - En rapport fra utvinningsutvalget. Download: https://www.regjeringen.no/globalassets/upload/oed/pdf_filer/oktutvinning.pdf
- The Office of the Auditor General (2015): Riksrevisjonens undersøkelse av myndighetenes arbeid for økt oljeutvinning fra modne områder på norsk kontinentalsokkel. Dokument 3:6 (2014–2015). Download: https://www.riksrevisjonen.no/globalassets/rapporter/no-2014-2015/oljeutvinningkontinentalsokkel.pdf
- Ministry of Energy (1996): Lov om petroleumsvirksomhet (petroleumsloven), § 4-1. Forsvarlig utvinning. Download: https://lovdata.no/dokument/NL/lov/1996-11-29-72/KAPITTEL_4#%C2%A74-8
- The Norwegian Offshore Directorate (2026): The Norwegian Offshore Directorate's technology strategy. Download: https://www.sodir.no/en/facts/technology/
- Osmundsen, P. & A. Wittemann, A. (2024): Petroleum development projects. Concept selection, taxation and recovery rate. Resources Policy, Vol. 95, August 2024. Download: https://www.sciencedirect.com/science/article/abs/pii/S0301420724005385
- Ministry of Energy (1996): Lov om petroleumsvirksomhet (petroleumsloven) – Kapittel 4. Utvinning m.v. av petroleum. Download: https://lovdata.no/dokument/NL/lov/1996-11-29-72/KAPITTEL_4#KAPITTEL_4
- Offshore Norge (2026): Marginale funn på norsk sokkel – status, barrierer og mulighetsrom. Download: https://www.offshorenorge.no/contentassets/493648b1b9744ae79cafd3385390817e/offshore-norge-2026---marginale-funn-pa-norsk-sokkel---rapport.pdf
- Willigers, B.J.A., K. Prendergast, Z. Muslumov (2010): North Sea Dominos: The Economic Dependencies of Infrastructure Assets and Their User-fields. SPE Hydrocarbon Economics and Evaluation Symposium. Paper number, SPE-130156-MS. Download: https://doi.org/10.2118/130156-MS
- The Norwegian Offshore Directorate: Oil discoveries in the Yggdrasil area (25/114, 25/114 A, B, C, D, E, F and G). Download: https://www.sodir.no/en/whats-new/news/exploration-drilling-results/2025/oil-discovery-in-the-yggdrasil-area-251-14-251-14-a-b-c-d-e-f-and-g/
- The Norwegian Offshore Directorate (2025): Gas/condensate discovery in the North Sea (15/5-8 S and A). Download: https://www.sodir.no/en/whats-new/news/exploration-drilling-results/2025/gascondensate-discovery-in-the-north-sea-155-8-s-and-a/
- IEA (2025): The Implications of Oil and Gas Field Decline Rates. Download: https://iea.blob.core.windows.net/assets/9ea2076e-5a0d-4a0d-9767-a1eec20aff23/TheImplicationsofOilandGasFieldDeclineRates.pdf
- Gea, F. (2026): "Five years ago nobody was talking about the replacement, right? It was forgotten. But we need to start thinking about how we are going to replace the current production in the coming years". Statement during CERAWeek, Houston, March 2026 (Repsol).
- Stern, A. (2026): "Everybody is refocusing to try and do more exploration again. There's always a balance then in organic exploration and inorganic and the difference is really the timing, how long it takes to get to production there...". Statement in interview with Reuters, March 27, 2026 (OMV).
- The Norwegian Offshore Directorate (2026): About Diskos. Download: https://www.sodir.no/en/about-us/organisation/collaboration-projects/diskos/
- The Norwegian Offshore Directorate (2026): The shelf in 2025, chapter 4 - Data management, digitalisation and cooperation. Download: https://www.sodir.no/en/whats-new/publications/reports/the-shelf/the-shelf-in-2025/data-management-digitalisation-and-cooperation/
- The Norwegian Petroleum Directorate (2015): Diskos 20 år – i oljegeologiens tjeneste. Diskos jubileumshefte, spesialtrykk. Download: https://www.sodir.no/globalassets/3-diskos/documents/diskos_jubileumshefte_liten.pdf#:~:text=Diskos%2Dveteran%20Kjell%20Reidar%20Knudsen "Mye av hemmeligheten bak nye funn i modne områder, ligger i å kaste seg over gamle data med ny entusiasme og sette informasjonen inn i en oppdatert kontekst, sier Hans Chr. Rønnevik, letesjef i Lundin Norway. Og forklarer hvorledes Diskos bidro til funnet av Johan Sverdrup."
- Ordonez A., T. J. Line Forgaard, D.Wade, A. Juell Bugge, H. Nese, A.Ueland Waldeland (2026): The NCS-Model: A seismic foundation model trained on the Norwegian repository of public data. Cornell University, arXivLabs; arXiv:2603.23211. Download: https://arxiv.org/pdf/2603.23211
- FORCE was established in 1995 and is a collaborative forum for sustainable recovery, improved exploration as well as energy efficiency and the environment, where oil and gas companies and authorities in Norway collaborate. Download: https://www.sodir.no/en/force/
- Serov, P., R. Mattingsdal, M. Winsborrow, H. Patton, K. Andreassen (2023): Widespread natural methane and oil leakage from sub-marine Arctic reservoirs. Nature Communications 14, 1782. Download: https://doi.org/10.1038/s41467-023-37514-9
- Panieri, G., C. Argentino, S. P. Ramalho, F. Vulcano, A. Savini, L. Fallati, T. Brekke, G. Galimberti, F. Riva, J. Balsa, M. H. Eilertsen, R. Stokke, I. H. Steen, D. Sahy, D. Kalenitchenko, S. Büenz, R. Mattingsdal (2024): An Arctic natural oil seep investigated from space to the seafloor. Science of The Total Environment,Volume 907,167788. Download: https://doi.org/10.1016/j.scitotenv.2023.167788
- Kilhams, B., L. Chedburn, L. Layfield, N. Schofield, I. Løkling Lunde, L. Kennan, H. Romain, D. Jolley, C. Haug Eide (2022): Challenges and opportunities for hydrocarbon exploration within the Mesozoic sub-basalt plays of the Norwegian Atlantic Margin. Petroleum Geoscience (2022) 28 (4), petgeo2022-022. Download: https://doi.org/10.1144/petgeo2022-022
- The Norwegian Petroleum Directorate (2020): Resource report 2020 Exploration, chapter 3 – Undiscovered resources. Download: https://www.sodir.no/en/whats-new/publications/reports/resource-report/resource-report-2020/3--Undiscovered-resources/?language=en
- Rumsfeld, D. H. (2002): U.S. Department of Defense, DoD News Briefing, Transcript. Download: https://usinfo.org/wf-archive/2002/020212/epf202.html Quote D. H. Rumsfeld: “Reports that say that something hasn't happened are always interesting to me, because as we know, there are known knowns; there are things we know we know. We also know there are known unknowns; that is to say we know there are some things we do not know. But there are also unknown unknowns – the ones we don't know we don't know.”
- Žižek, S. (2006): Philosophy, the "unknown knowns", and the public use of reason. Topoi 25, 137–142. Download: https://doi.org/10.1007/s11245-006-0021-2
- Gassco (2023): Vurdering av gasstransportalternativer fra Barentshavet sør. Download: https://www.regjeringen.no/contentassets/39fd87433a4f4c6ba92d1da8d8d4e95d/barentshavet-vurderinger-og-observasjoner-2023.pdf
- Gassco (2026): Annual report 2025, page 20. Download: https://gassco.eu/wp-content/uploads/2026/06/EN-Annual-Report-2026.pdf
- Hoel, M. (2022): Historisk lønnsomhet i petroleumssektoren. Rapport 2022/45, Vista Analyse. Download: https://www.vista-analyse.no/en/publications/historisk-lonnsomhet-i-petroleumssektoren/
- Rønnevik, H. C., A. Jørstad, J. E. Lie (2017): The discovery process behind the giant Johan Sverdrup field. R. K. Merrill and C. A. Sternbach, eds., Giant Fields of the Decade 2000–2010: AAPG Memoir 113, p. 195–220. Download: https://www.researchgate.net/publication/345040211_The_Discovery_Process_behind_the_Giant_Johan_Sverdrup_Field
All analyses, facts, and conclusions presented in this report have been prepared by the Norwegian Offshore Directorate. Artificial intelligence (AI) has been used to a limited extent for language processing and refinement. In accordance with our guidelines, the content has been verified against the cited sources. The text has undergone both technical and linguistic quality assurance and has been adapted to current regulations and practices.