Introduction and summary
Substantial remaining resources on the Norwegian continental shelf (NCS) continue to offer big opportunities in both mature and less-explored areas. Increased knowledge, better data coverage, new working methods and innovative technology open new exploration opportunities and can yield a number of commercial discoveries. The companies must explore and discover more in order to maintain activity and production over time.
Next year will be the 50th anniversary of the Ekofisk discovery in the southern part of the NCS. This event generated great interest in exploring off Norway, and a number of substantial discoveries were made over the next 20 years. About 70 per cent of proven resources were found in the period up to 1990 (figure 1.1).
Since the first commercial oil discoveries were made, Norway has established itself as an important player in international oil and gas markets.

Figure 1.1
Resource growth on the NCS 1966-2017
SUBSTANTIAL VALUE
Oil and gas from the NCS have generated massive revenues to help make Norway a very wealthy country today. The petroleum sector is the country’s largest industry measured by value creation, government revenues, investment and export value. Petroleum operations accounted in 2017 for about 14 per cent of Norway’s gross domestic product (figure 1.2). They were responsible for 19 per cent of total investment and 17 per cent of government revenues. Sales of oil and natural gas provided some 40 per cent of total Norwegian export value in 2017.
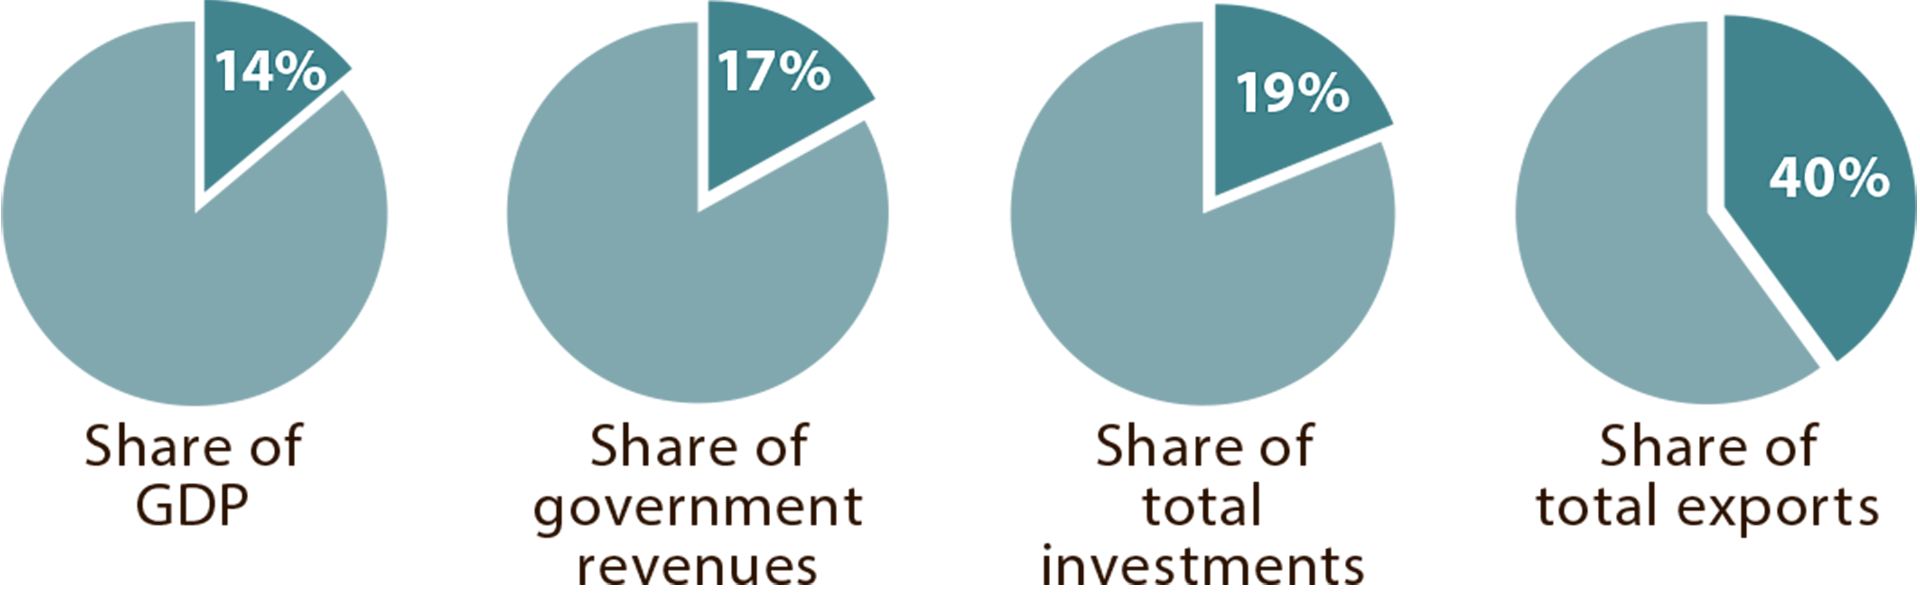
Figure 1.2
Macroeconomic indicators for the petroleum sector 2017
(Source: Norwegian Petroleum)
PURPOSEFUL MEASURES
Exploration activity measured by annual exploration wells has fluctuated partly in line with oil price trends (figure 1.3). It declined from the 1990s to bottom out in 2005 at 12 wells. That prompted the government to adopt purposeful measures aimed at stimulating activity while increasing diversity and competition on the NCS. Combined with rising oil prices, these measures led to a sharp increase in exploration wells. New companies entered and a number of commercial discoveries were made, with 16/2-6 Johan Sverdrup as the largest.

Figure 1.3
Developments in exploration wells spudded
SOFT LANDING
After a sharp growth in wells and spending during 2005-14, the level of costs and the oil price slump in the late autumn of 2014 led to cuts in exploration budgets, postponed investment and fewer exploration wells. Their number declined from 57 in 2014 to 36 in 2016. Measures were also adopted by the industry to enhance productivity and efficiency while cutting costs. The decline flattened out in 2017, and exploration in 2018 is expected to be higher than in the two preceding years. Activity remains relatively high in a historical perspective.
SUBSTANTIAL RESOURCE POTENTIAL
Despite more than 50 years of exploration, the NPD’s assessment is that big opportunities still exist on the NCS. The resource accounts indicate that about half of Norway’s total petroleum resources are left to produce. Roughly 53 per cent of the expected remaining resources lie in fields and discoveries, while 47 per cent remain to be found.
The NPD’s updated mapping has led it to raise its estimate of undiscovered resources from around 2 900 standard cubic metres of oil equivalent (scm oe) to 4 000 million. Considerable uncertainty attaches to this estimate, particularly for the little-explored areas in the Barents Sea and around Jan Mayen.
Total remaining resources provide the basis for petroleum production over many decades to come. Today’s forecast for future oil and gas output shows an increase until the mid-2020s, followed by a gradual decline. From around 2025, a steadily larger proportion of production must come from as yet undiscovered resources (figure 1.4). If production and the level of activity are to be maintained at current levels, therefore, more exploration is needed and new resources must be proven.

Figure 1.4
Historical and expected future production from the NCS to 2030
DEVELOPMENT FEATURES
Discoveries are smaller. On average, discoveries in recent years have been smaller than before (figure 1.5) – a natural development in a mature petroleum province. Mature areas are characterised by known geology, normally fewer and smaller technical challenges, and well-developed or planned infrastructure. The bulk of the acreage opened for petroleum operations is now mature. Big undiscovered resources remain in mature areas, which could provide the basis for new finds. These resources could represent substantial value.

Figure 1.5
Development of average discovery size and average technical and commercial success rates.1 Discovery size is based on today’s estimate, not that reported at the time of discovery.
1 Discoveries not very likely to be recovered – resource class 6 (RC6) – are not included when calculating average discovery size. All discoveries are included in calculating the technical discovery rate. The commercial discovery rate excludes discoveries in RC6. An estimated assessment has also been made for new discoveries in resource class 7 (RC7) – in other words, those which have not been evaluated. See figure 1.10 for the NPD’s resource classification system.
The trend for the technical success rate shows that increased knowledge, more and better data, and technological progress have helped to make exploration more efficient since the first well in 1966. Despite some decline for the average success rate in recent years, it has remained at a high level from the 1990s. The commercial success rate has remained more or less unchanged since petroleum operations began, even though the average discovery size has been declining. Exploration on the NCS remains profitable.
Even very small discoveries can become commercial when they are phased in to existing fields or developed in coordination with other finds. Coordinated development of several discoveries normally reduces unit costs and lowers the threshold for exploration and development. Achieving commercial production from smaller finds located far from existing infrastructure is more demanding.
Diversity creates competition.
A broad variety of companies, both large and small, creates competition which encourages efficiency and a diversity of ideas in the exploration phase.2 The number of players on the NCS has increased from the mid-2000s, partly as a result of measures to create greater diversity. Although the total has declined somewhat since 2013, variety remains high (figure 1.6).
2 See the resource report for 2017 at www.npd.no for analyses of the player picture in the development and operation phases.

Figure 1.6
Players on the NCS by size, 2000-17
A trend in recent years has been that the majors are exploring less actively and cutting back on or withdrawing from the NCS. This can be viewed in relation to such factors as the fall in oil prices and a decline in expected discovery size. When the large companies reduce their exploration activity, the medium-sized and small players become increasingly important. Maintaining a positive combination of active and experienced large and medium-sized companies, more focused exploration companies and new company creations for both exploration and production is important for continued efficient exploration of the NCS.
Most and biggest in the far north. Most of the undiscovered resources are expected to lie in the Barents Sea (figure 1.7). Opportunities for making big discoveries are greatest in little-explored areas. New discoveries in the Barents Sea will be increasingly important as production further south on the NCS begins to decline from around 2025.

Figure 1.7
Estimated undiscovered resources by area
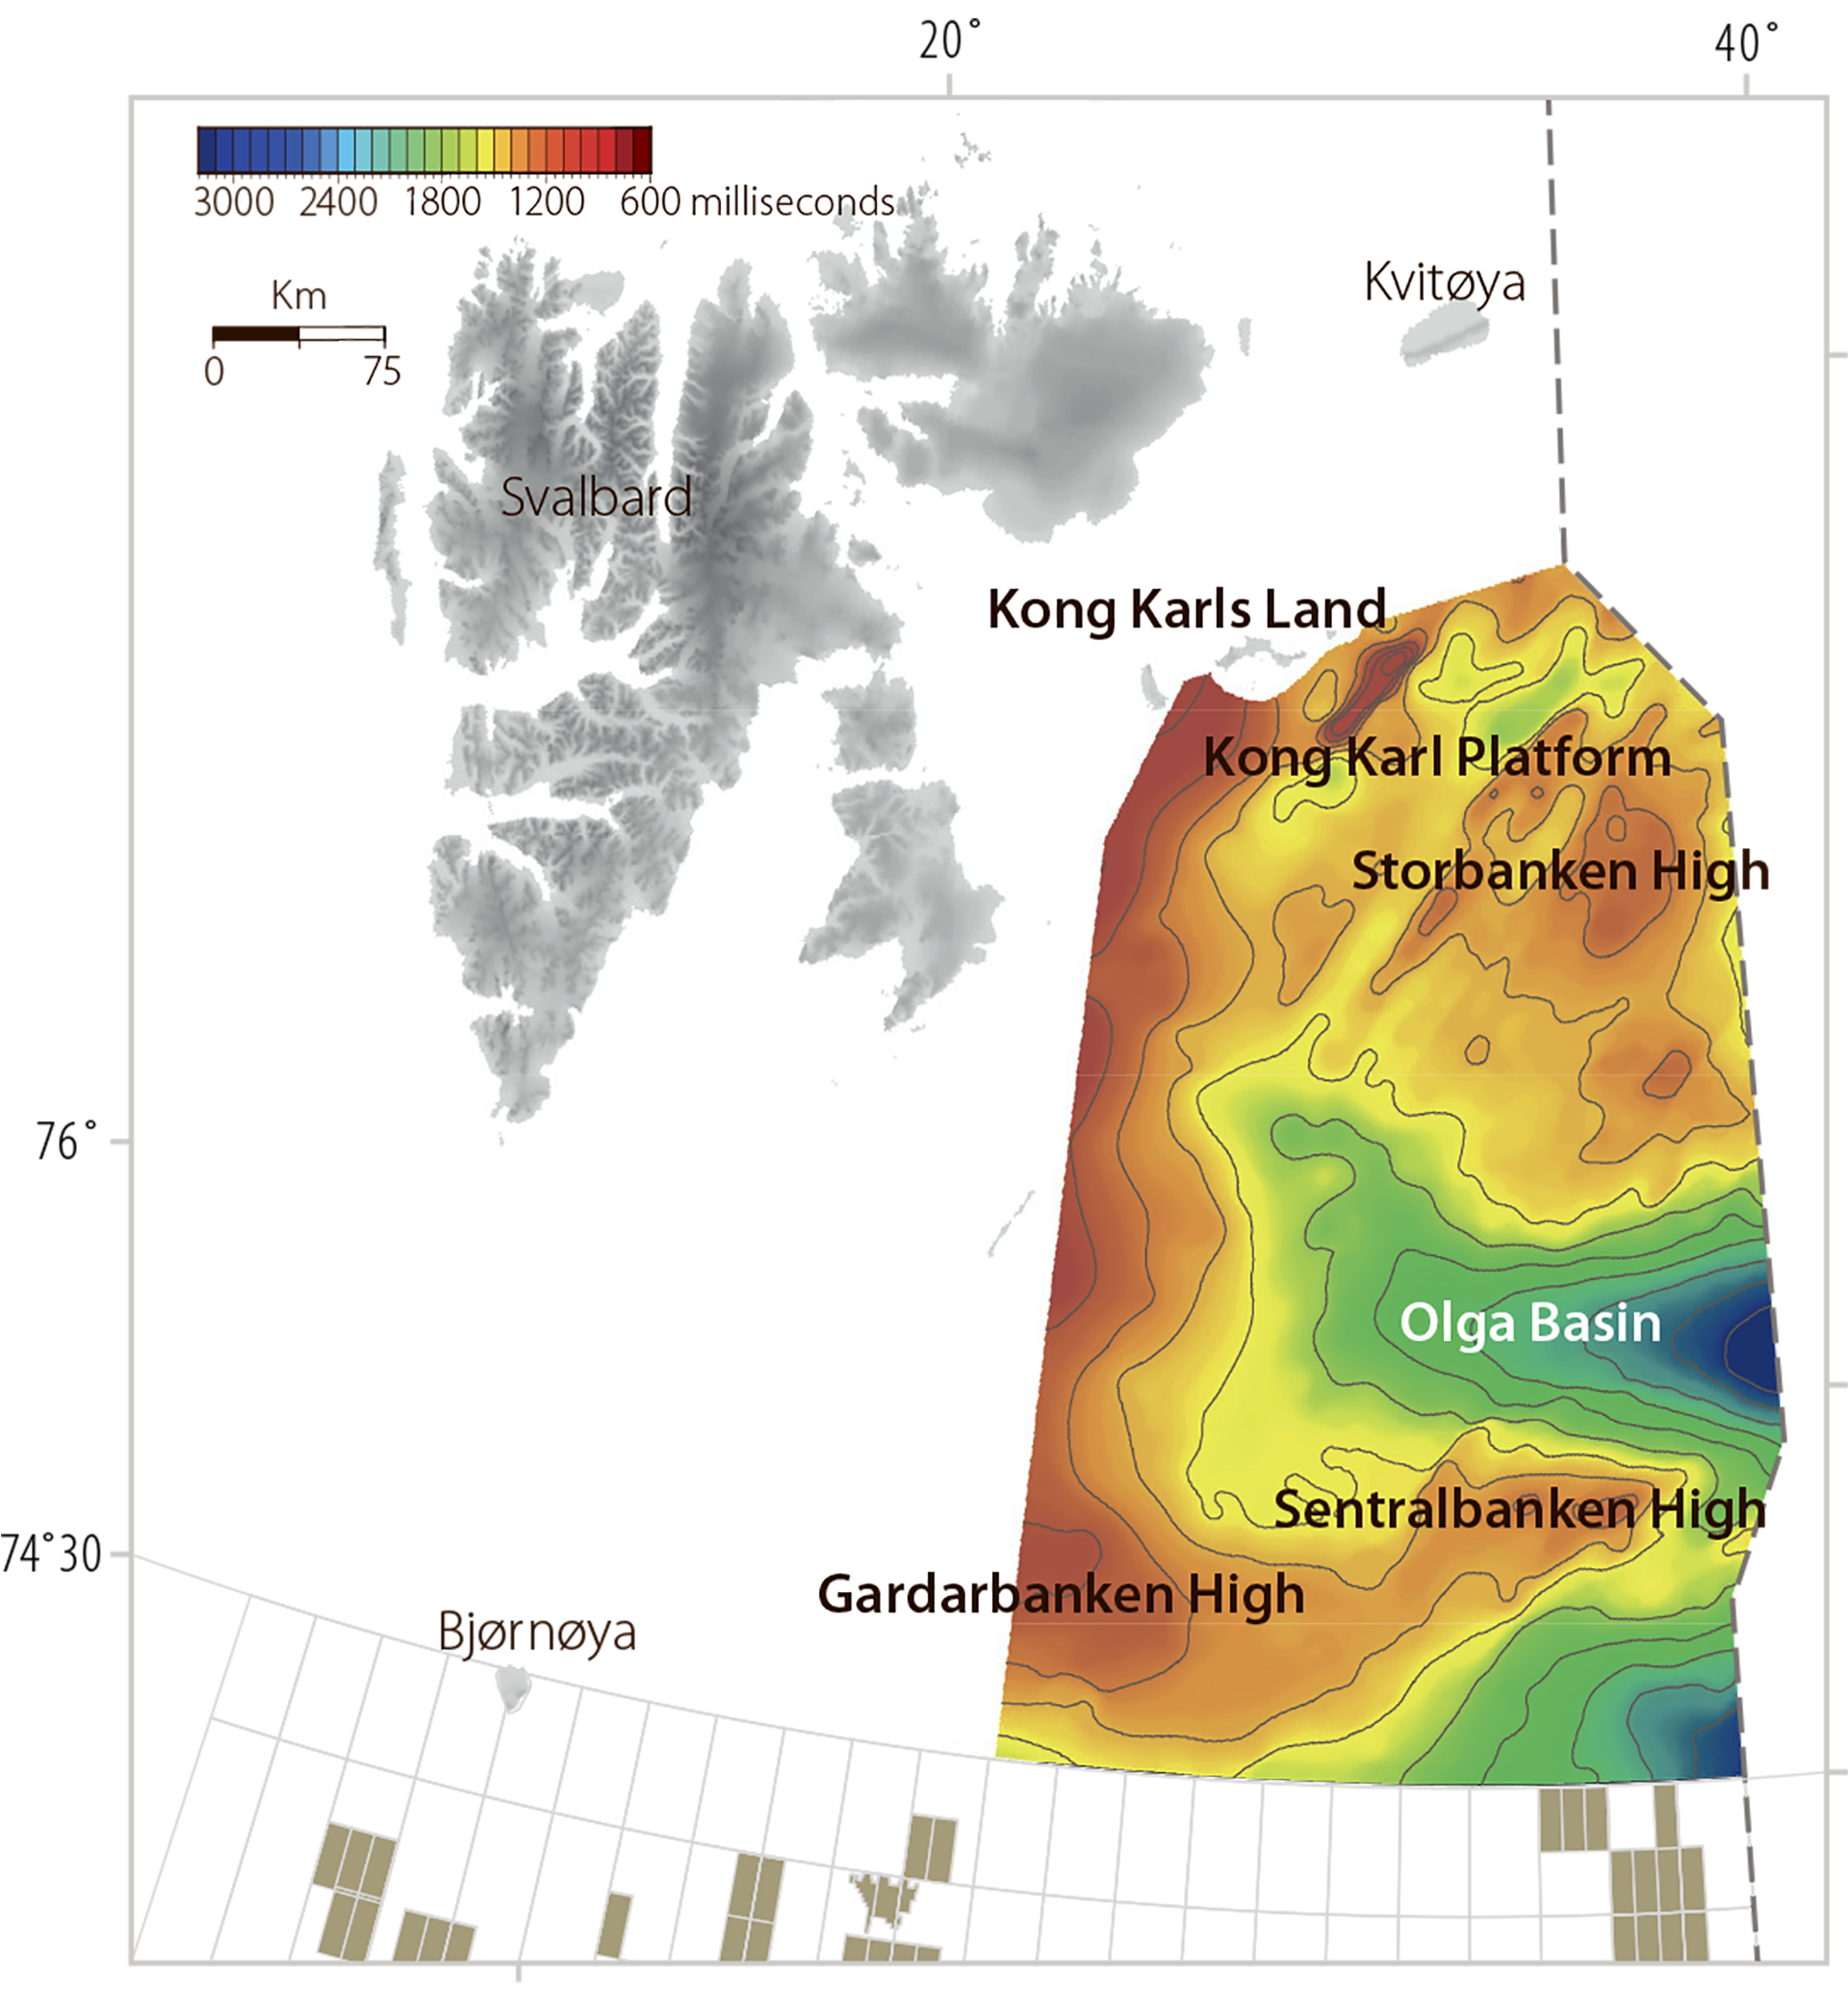
Half the undiscovered resources in the Barents Sea lie in unopened areas of the far north. The NPD’s mapping of parts of these areas has identified big structures which could contain large quantities of oil and gas (figure 1.8).

Figure 1.8
Large structures and the extent of the mapped area in Barents Sea North
(time contour map for the top of the Permian).3
3 The NPD’s report on Geological assessment of petroleum resources in eastern parts of Barents Sea North 2017.
Resources are harder to find – calls for technology and expertise
Finding new petroleum resources is becoming increasingly difficult in areas with a long exploration history. Exploration takes place to a great extent in areas which have been open to oil and gas activities for many years, so additional data must be acquired or existing information reanalysed to obtain new understanding. Seismic surveys and data from exploration wells are the geologists’ most important basis for establishing new plays. Technological advances have provided new and better tools which contribute to steady improvements in understanding the sub-surface.
Collating and integrating all available data are also very important for making new discoveries. Expertise and experience are crucial here. In a long-term perspective, therefore, it is a matter of concern that applications to study traditional petroleum subjects have declined substantially in recent years in line with cost cuts and downsizing by the companies.
Gas calls for collaboration and a joint effort
Gas accounts for roughly half the undiscovered resources. Since the average discovery size is declining, many small gas finds are likely in the opened areas. The infrastructure in the North and Norwegian Seas is well developed (figure 1.9). As more spare capacity becomes available, interest among the companies in also exploring for small gas deposits could increase.

Figure 1.9
Existing gas infrastructure and expected remaining gas resources.
Almost two-thirds of the undiscovered gas is expected to lie in the Barents Sea. That emphasises the significance of this area for long-term output. Current gas transport capacity from the Barents Sea is limited to the liquefaction plant at Melkøya. Under existing plans, capacity there will be fully utilised until the early 2040s. Lack of infrastructure and spare gas transport capacity affects exploration. Where the companies are concerned, finding gas which does not justify an independent export solution is of little value. Gas discoveries in the Barents Sea therefore depend to a greater extent on unitisation and coordinated development. At the same time, it will be more difficult to discover sufficient gas resources which can support new infrastructure unless the companies explore for them.
HARD WORK AND INTELLIGENT CHOICES
Substantial opportunities remain on the NCS. More than half the expected resources are still in the ground, and half of these are yet to be discovered. Innovative technology and better-quality data open new opportunities, including in mature areas. Spare capacity in existing infrastructure as well as cuts in exploration and development costs have lowered the threshold with regard to exploring for and producing small discoveries.
Bigger finds are also needed if production is to be sustained. Relatively large discoveries are still possible in known and mature areas. However, the potential for making large finds which can support new infrastructure and contribute to a high level of production is greatest in little-explored areas – and particularly areas which have still to be opened.
But resource opportunities will not just happen. Hard work and intelligent choices are needed to ensure that resources in both mature and less-explored areas contribute to maintaining production and creating value.
SUMMARY
CHAPTER 2:
EXPLORATION ON THE NCS
Trends for exploration on the NCS and in its various sea areas are presented. After a number of years with a high level of activity, exploration declined from 56 wells in 2015 to 36 in 2016 and 2017. However, 40-50 exploration wells are expected in 2018.
Substantial interest has been shown in new exploration acreage during the latest licensing rounds. This probably partly reflects new understanding based on better seismic data and well results which have led to new play and prospect concepts. Cost cuts and access to infrastructure capacity are other important factors.
On average, discoveries in recent years are smaller than before. Smaller finds and fewer wells will make it demanding to maintain production over time. The number of wells drilled and the size of discoveries made must be above the average for the past decade if production is to be sustained at a high level. Opportunities for making larger finds are probably greatest in less-explored areas.
Read all about: Exploration on the NCS
CHAPTER 3:
UNDISCOVERED RESOURCES
Total undiscovered resources are estimated to lie between 2 330 (P95) and 6 200 (P05) million scm oe. The expected value is 4 000 million scm oe, up by 37 per cent from 2 920 million scm oe in 2015. This increase primarily reflects a new estimate for Barents Sea North in 2017. The NPD’s mapping there has identified large structures which could yield substantial oil and gas discoveries. The updated estimate for undiscovered resources shows that the total amount remaining could provide the basis for oil and gas production over many decades to come.
Read all about: Undiscovered resources
CHAPTER 4:
PROFITABILITY OF EXPLORATION
Exploration in the past decade has contributed substantial value to society. The net present value of this activity over these 10 years, at discount rates of four and seven per cent, was about NOK 930 billion and NOK 560 billion respectively. Exploration has been profitable in all areas.
Read all about: Profitability of exploration
CHAPTER 5:
PLAYER PICTURE IN THE EXPLORATION PHASE
A broad variety of companies creates competition, which promotes efficiency and value creation in the exploration phase. That contributes to greater diversity of ideas and interest in different plays, technologies, and play and prospect concepts. The number of players on the NCS has increased from the mid-2000s, partly as a result of measures to create greater diversity. Although their total has declined somewhat since 2013, variety remains high.
Read all about: Player picture in the exploration phase
CHAPTER 6:
NEW EXPLORATION TECHNOLOGY AND WORK PROCESSES
In order to understand better how progress with technology and geological methods has contributed to efficient exploration, the NPD carried out a study in collaboration with consultant Westwood Global Energy Group. This identified a number of areas within a wider exploration technology concept, such as data acquisition, geosciences and working methods, which have either been or are expected to become important for exploration on the NCS.
Read all about: New exploration technology and work processes
CHAPTER 7:
EXPLORATION LOOK-BACK ANALYSES
Earlier NPD analyses have shown that the companies exaggerate resource expectations and understate the probability of success in drilling. This means their exploration portfolios systematically deliver below expectations.
The industry has long worked purposefully to avoid biases in the decision basis, but a number of analyses show that an improvement potential still exists. That finding is underlined by the NPD analyses presented in this chapter.
Read all about: Exploration look-back analyses
CHAPTER 8:
RESOURCES FOR THE FUTURE: SEABED MINERALS AND GAS HYDRATES
The greater attention being paid to producing energy with a low carbon footprint is expected to mean an increased need for natural gas and a growing demand for metals and rare-earth elements (REEs). On the NCS, seabed minerals are known to exist in the deep parts of the Norwegian Sea. Mapping has identified both manganese crusts and sulphides. Gas hydrates could become a future energy source. These are found in large quantities immediately beneath the seabed in some parts of the Norwegian and Barents Seas. No solution currently exists for profitable production of such deposits, but research on recovery methods is under way internationally.
Read all about: Resources for the future: seabed minerals and gas hydrates
RESOURCE CLASSIFICATION AND RESOURCE ACCOUNTS AT
31 DECEMBER 2017
THE NPD’S RESOURCE CLASSIFICATION SYSTEM
Petroleum resources are divided into classes which reflect the level of knowledge about the quantities involved and the maturity of development projects. These classes correspond to a great extent with those used in internationally recognised classification systems.
The resource classes are:
- reserves
- contingent resources
- undiscovered resources
Reserves and contingent resources represent total discovered recoverable resources. They are broken down in turn into sub-classes which reflect their status before and after important decision gates in the process of maturing projects up to development and recovery (production).
Undiscovered resources are broken down into estimated but unproven petroleum resources in mapped prospects and estimated but unproven recoverable petroleum resources related to plays (fact box 3.2).
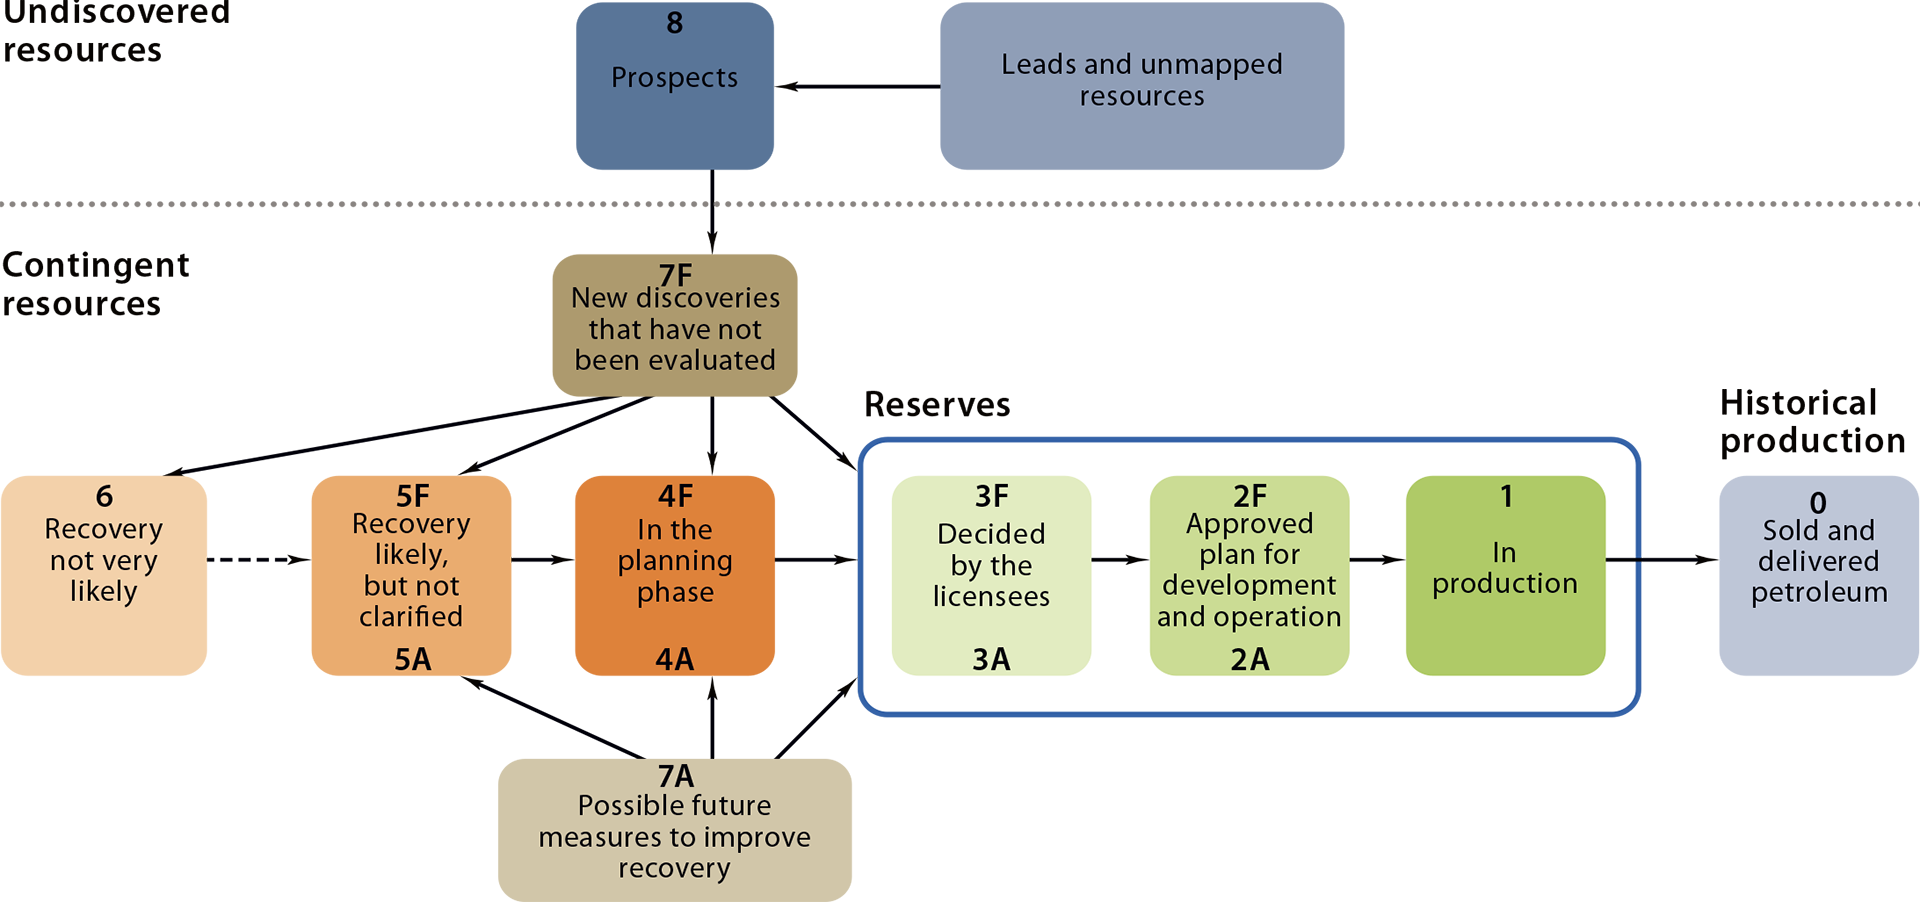
Figure 1.10
The NPD’s resource classification system
(www.npd.no)
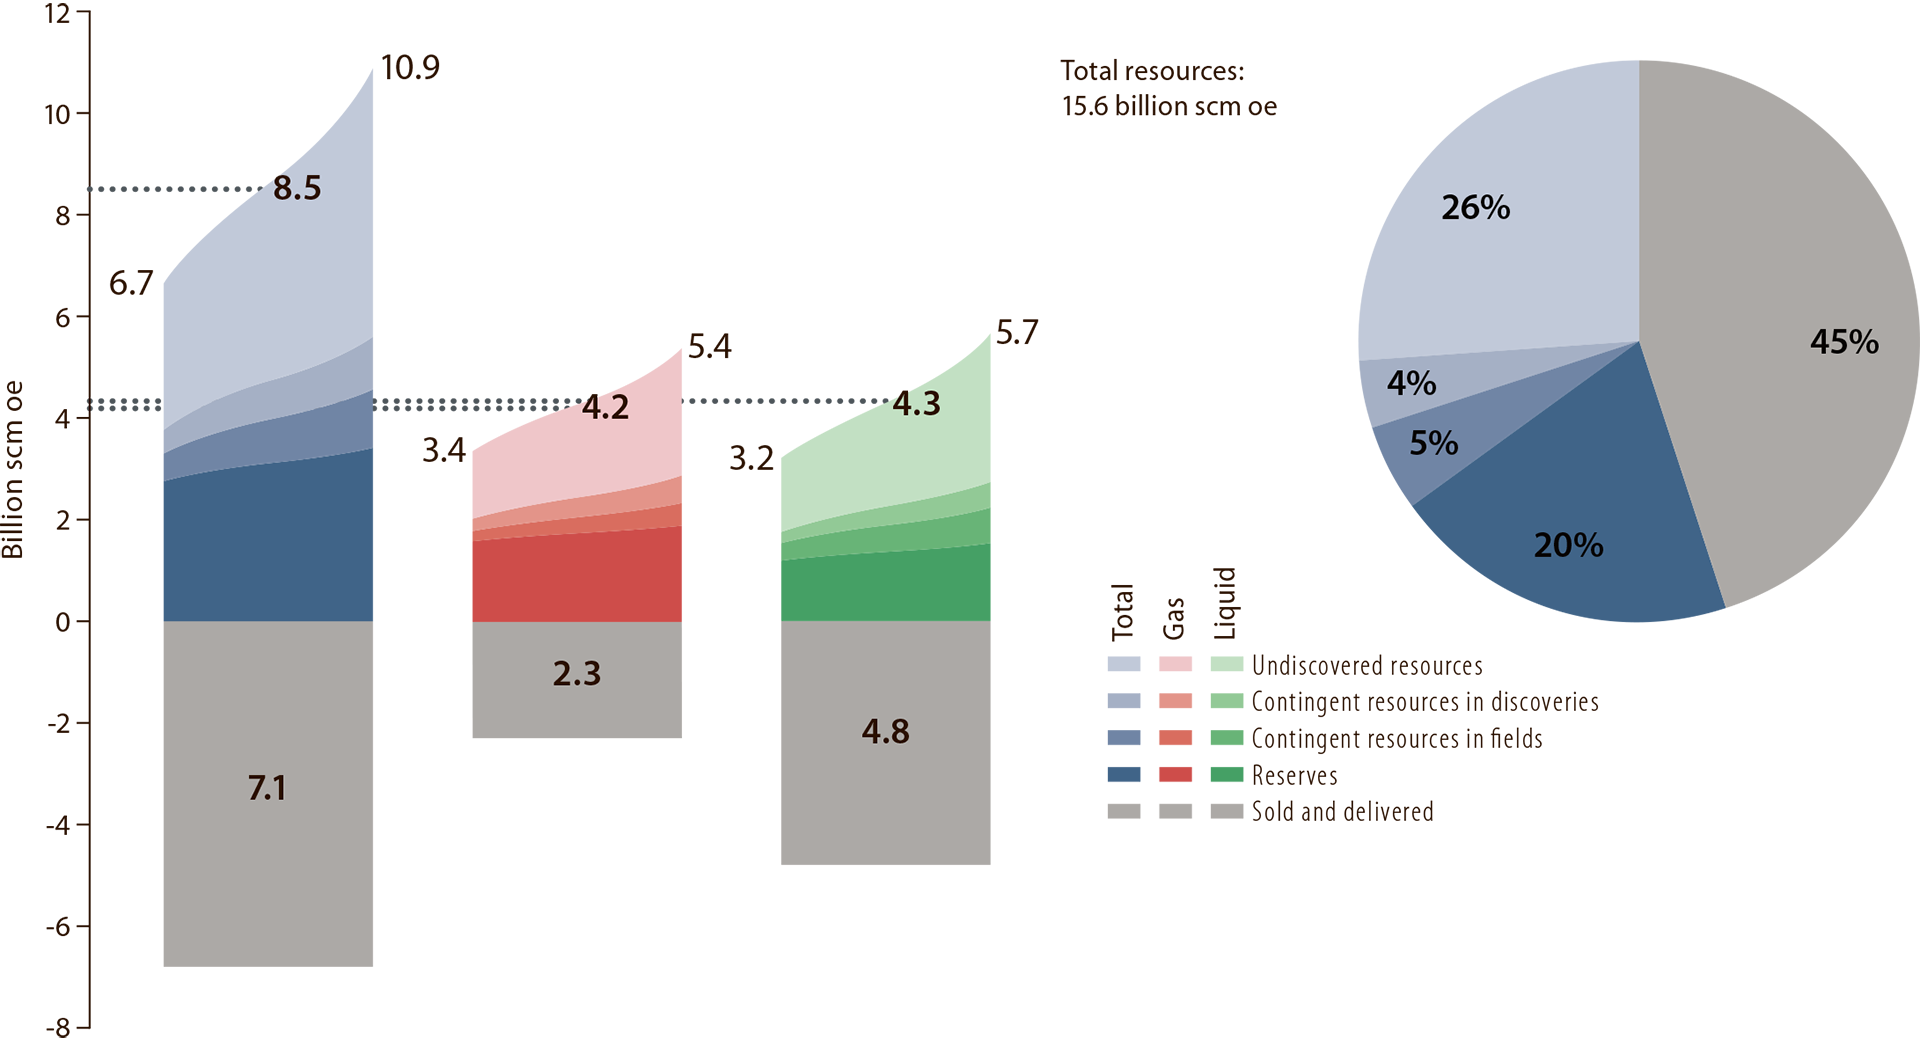
RESOURCE ACCOUNTS AT 31 DECEMBER 2017
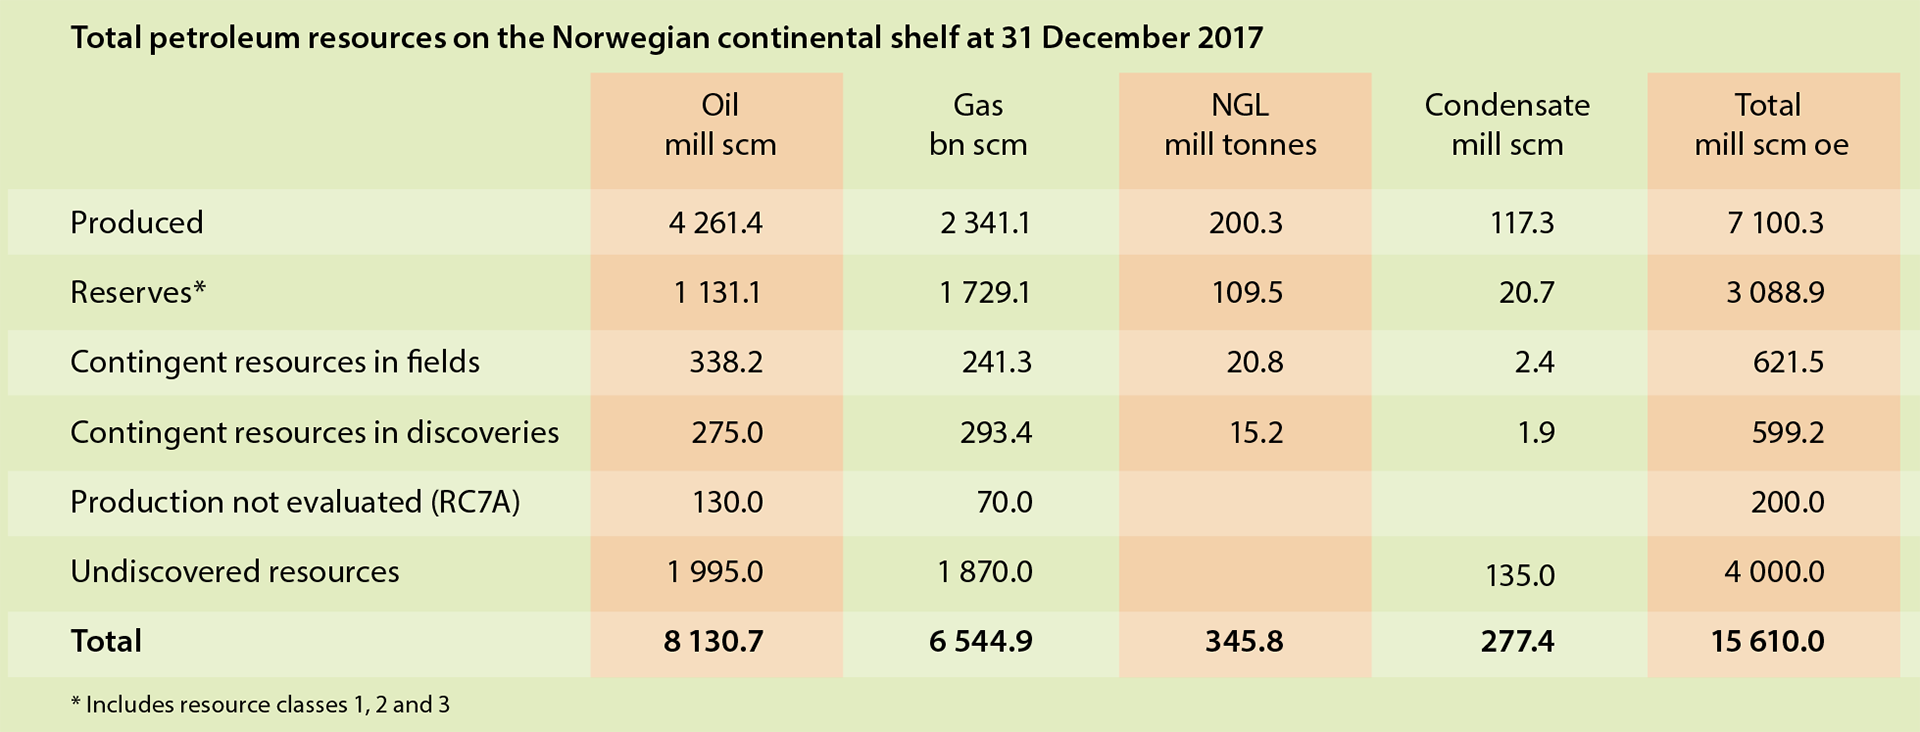
The NPD’s estimate for total proven and unproven petroleum resources on the NCS is about 15.6 billion scm oe. Of this, 7.1 billion or 45 per cent have been sold and delivered (table 1.1).
The amount remaining to be produced is estimated at 8.5 billion scm oe. Proven resources account for 4.5 billion of this. Estimated unproven resources come to four billion scm oe, or about 47 per cent of remaining resources.

Table 1.1
Total petroleum resources on the NCS at 31 December 2017.4
4 Oil and condensate are specified in million scm, natural gas liquids (NGL) in million tonnes, and gas in billion scm. The conversion factor from tonnes to scm for NGL is 1.9. Total oil equivalent is specified in million scm oe.