Profitability of exploration
Exploration has contributed substantial value to Norwegian society over the past decade, and has been profitable in all sea areas.
The NPD has calculated the profitability of exploration on the Norwegian continental shelf (NCS) over the past decade. The analysis shows that this activity has been profitable in all areas and has contributed substantial value to Norwegian society. Even very small discoveries can be profitable when tied back to existing infrastructure.
Exploration over the past decade has contributed substantial value to Norwegian society. That emerges from the NPD analysis, which presents the direct financial value creation from these activities in 2008-17. All profitability analyses are pre-tax calculations. The calculations do not take account of indirect economic effects such as the consequences of extending field production and spin-offs for the rest of the economy. Nor has the value of geological information acquired by exploration been quantified in this analysis. Its methodology and assumptions are described in fact box 4.1.
Fact box 4.1:
|
|
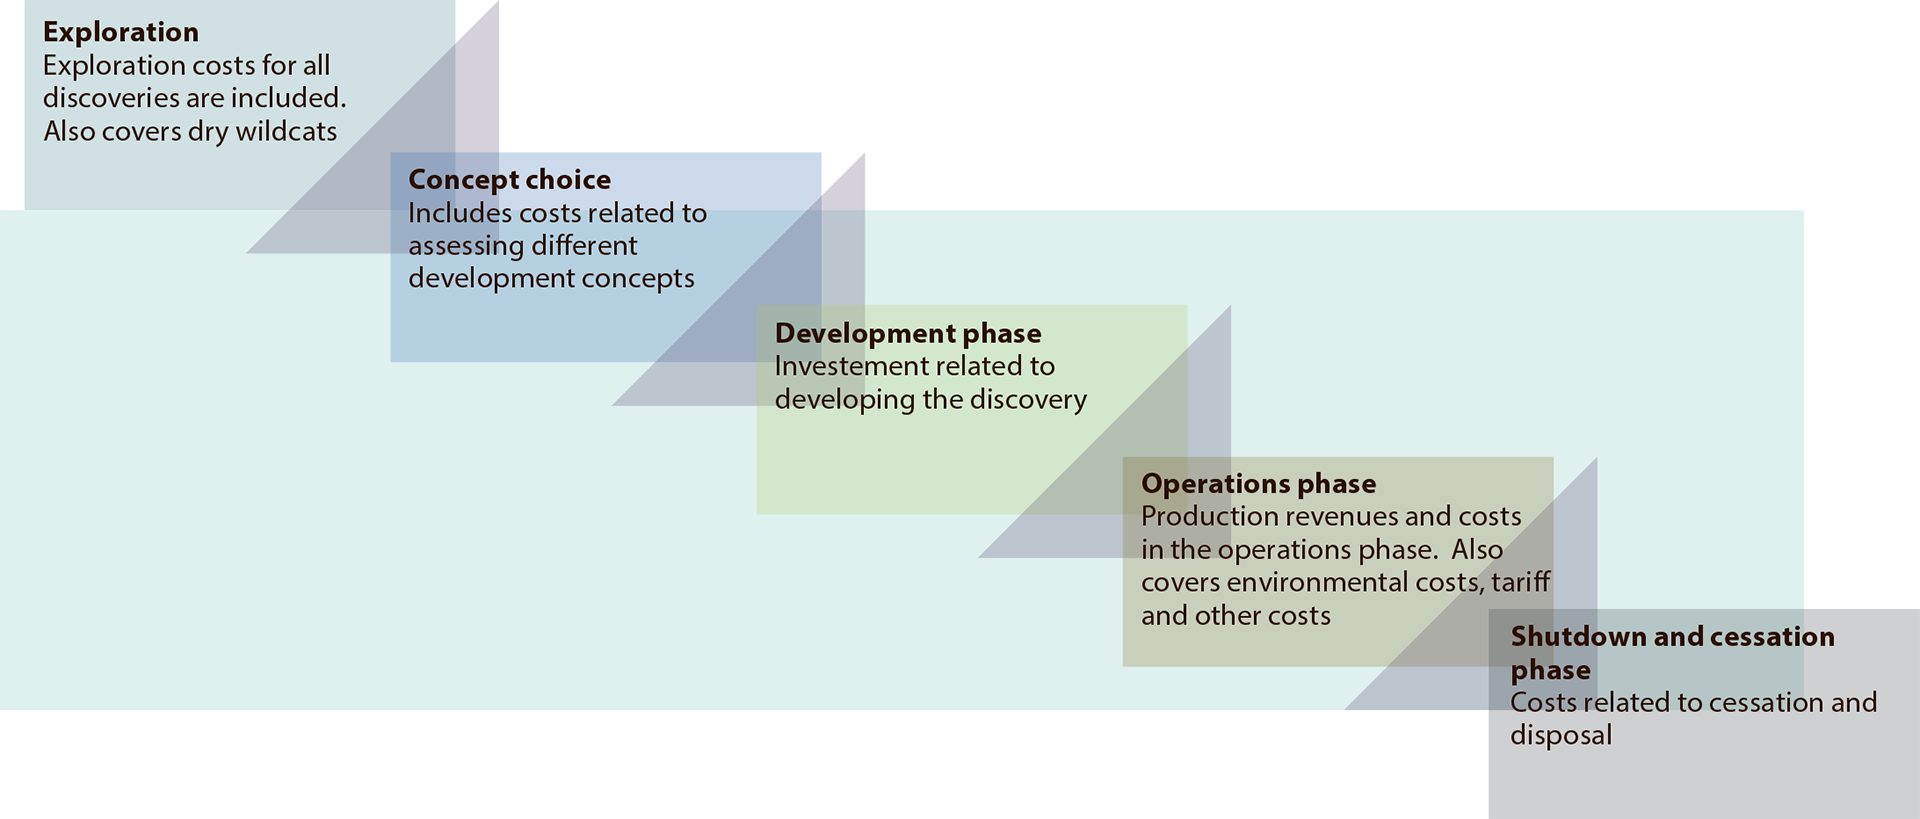
This analysis covers all phases of the industry, from exploration to cessation and removal (figure 4.1).
Figure 4.1
|

EXPLORATION AND COSTS DURING THE PERIOD
Exploration activity measured by number of wells spudded was high during the decade, with an annual average of 51 wells. It was at its highest in 2009, with 65 wells spudded, and lowest in 2017 with 36 (figure 4.2). The largest number of wildcats was drilled in the North Sea during the period.

Figure 4.2
Exploration wells spudded by area, 2008-17.
Combined with strong oil and gas prices, the high level of activity during the period to 2015 contributed to a substantial growth in costs. The companies therefore initiated measures to reduce expenses, enhance operational efficiency and limit capital spending. The fall in oil prices reinforced the need for cost cuts.
The oil price decline and consequent capital rationalisation led to a sharp drop in exploration investment from 2016 (figure 4.3). Exploration expenses are outgoings incurred from the award of a production licence until a possible discovery is developed, and comprise spending on seismic surveys, wells, field evaluation and administration. Drilling represents the largest individual factor in total exploration costs. Rig hire is the largest component in expenditure.

Figure 4.3
Exploration costs and wells drilled, 2008-17.
Figure 4.4 shows the decline in drilling cost per well over the period. This figure shows that costs per well are lowest in the North Sea and highest in the Barents Sea, although that varies somewhat over time.

Figure 4.4
Average exploration well cost (drilling expense per well) by area, 2008-17.
The most important reason for the high cost of drilling in the Barents Sea over the past three years is several complicated wells.
It is important to emphasise that a significantly larger number of wells were drilled in the North Sea during the period than in the Barents Sea. This means that extreme values have a bigger effect on average cost in the latter area than in the former.
DISCOVERIES AND RESOURCE GROWTH DURING THE PERIOD
The 117 discoveries forming the basis for this analysis represent a total resource growth of about 1 150 million scm of oil equivalent (oe). Their size varies from the biggest (16/2-6 Johan Sverdrup) at roughly 400 million scm oe to the smallest with less than a million scm oe.
Figure 4.5 shows the size of the discoveries in the analysis. The mean discovery size (including 16/2-6 Johan Sverdrup) was about 10 million scm oe, with a median size of just under four million scm oe. A mean significantly higher than the median indicates that the biggest finds greatly exceeded the typical discovery size. In other words, they accounted for a high proportion of resource growth. That emerges clearly from figure 4.6.

Figure 4.5
Discovery size per find, 2008-17.
The Johan Sverdrup discovery of about 400 million scm oe falls outside the scale used in the figure.

Figure 4.6
Resource growth on the NCS in the 2008-17 analysis period.
VALUE CREATION IN THE PERIOD
The profitability of exploration is calculated with discount rates of four and seven per cent. Net present value at these rates is about NOK 930 billion and NOK 560 billion respectively. The overall net cash flow is estimated at almost NOK 1 600 billion. These estimates show that exploration has been profitable in all parts of the NCS (figure 4.7).

Figure 4.7
Net present value of exploration in 2008-17
(at various discount rates).
VALUE CREATION FROM THE VARIOUS SEA AREAS
Figure 4.8 shows that the present value per krone spent on exploration is highest in the North Sea. NOK 1 000 invested in exploring this area yields a return of almost NOK 3 000. Exploration in the Barents and Norwegian Seas yields returns of NOK 2 100 and NOK 1 300 respectively for each NOK 1 000 invested. These values are additional to a seven per cent return.

Figure 4.8
Present value (seven per cent discount rate) per NOK 1 000 spent on exploration.
Fact box 4.2: 25/1-11 R Skogul |
|
Figure 4.9
|
SENSITIVITY ANALYSIS
The NPD has analysed the sensitivity of profitability to changes in oil and gas prices. A 20 per cent increase in these prices would yield a net present value of almost NOK 900 billion at a seven per cent discount rate.
A 20 per cent decrease would yield a net present value of roughly NOK 250 billion (figure 4.10). The cost level is the same in both calculations.
The profitability analysis has also been tested for a corresponding increase in operating expenses, which include environmental costs. This would not have a decisive effect on the results.
