Exploration on the NCS
The companies must explore and make larger discoveries in order to maintain production on the Norwegian continental shelf at a high level.
The government provides a steady supply of exploration acreage through regular licensing rounds. Great interest has been shown by the industry in the most recent of these. After a couple of years with reduced activity, the number of exploration wells is rising again. It is important that the industry maintains a high level of exploration.
Exploration is influenced by such factors as expected prospectivity, available acreage, the regulatory framework, costs and the level of oil and gas prices. A long-running increase in activity which began in 2006 ended in 2016 after a substantial drop in oil prices. While 56 exploration wells were drilled in 2015, the annual figure for 2016 and 2017 was 36. However, 40-50 are expected in 2018.
Substantial interest has been shown in new exploration acreage during the most recent licensing rounds. This partly reflects new understanding based on better seismic data and well results, which have led to new play and prospect concepts. Cost cuts and access to infrastructure capacity are other important factors.
Discoveries above the average size for the past decade must be made if production is to be sustained at a high level. Opportunities for making larger finds are greatest in little-explored areas.
DEVELOPMENTS IN EXPLORATION ACTIVITY FROM 1965 TO 2017
The first exploration well on the NCS was drilled in 1966 (see fact box 2.1). A total of 1 654 such wells had been spudded by 31 December 2017 (table 2.1).
FACT BOX 2.1: Exploration wells |
|
Exploration well. Drilled to prove a possible petroleum deposit or to secure information for delineating a possible deposit. A collective term for wildcats and appraisal wells. Wildcat. Drilled to investigate whether a possible deposit contains petroleum. Appraisal well. Drilled to determine the size and extent of a petroleum deposit already proven by a wildcat. |
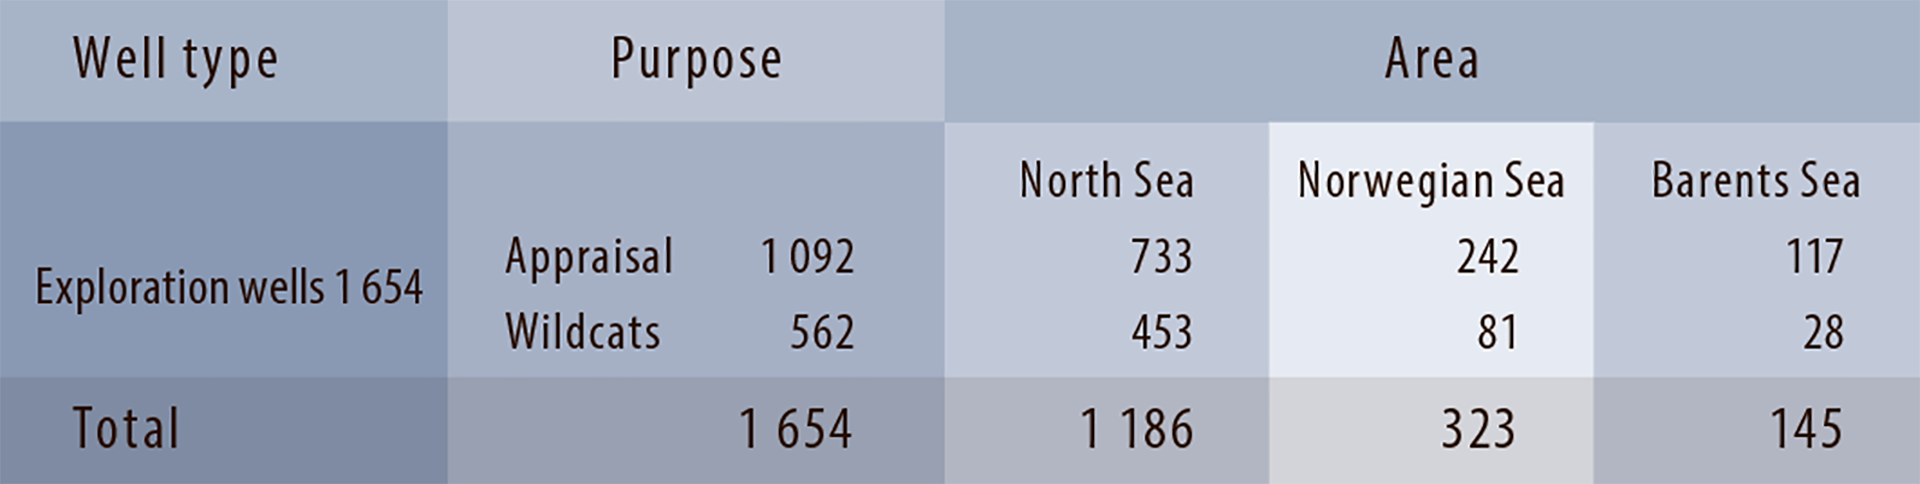
Table 2.1
Number of exploration wells spudded by category and area
(at 31 December 2017).
Exploration has varied substantially over this 50- year period (figure 2.1). The first peak was reached in the mid-1980s, with up to 50 wells per year. From the end of the 1990s, activity declined to a low point of 12 wells in 2005. It then began to recover, and 65 wells were spudded in 2009. The post-2006 increase reflected changes to exploration policy combined with rising prices. Activity remained by and large high until 2015, but the steep slump in oil prices led to a substantial fall over the past two years. Nevertheless, the level is still high compared with 1998-2005.

Figure 2.1
Exploration wells spudded
Historically, the largest annual number of exploration wells has been drilled in the North Sea. In 2017, however, the level was highest in the Barents Sea for the first time (figure 2.2) with a record 17 wells drilled there. While a decline has been forecast in the Barents Sea for 2018, drilling in the North and Norwegian Seas is expected to rise.

Figure 2.2
Exploration wells spudded by area
DISCOVERIES ARE SMALLER
A high level of exploration in recent years has resulted in many discoveries (figure 2.3). On average, these are smaller than before.
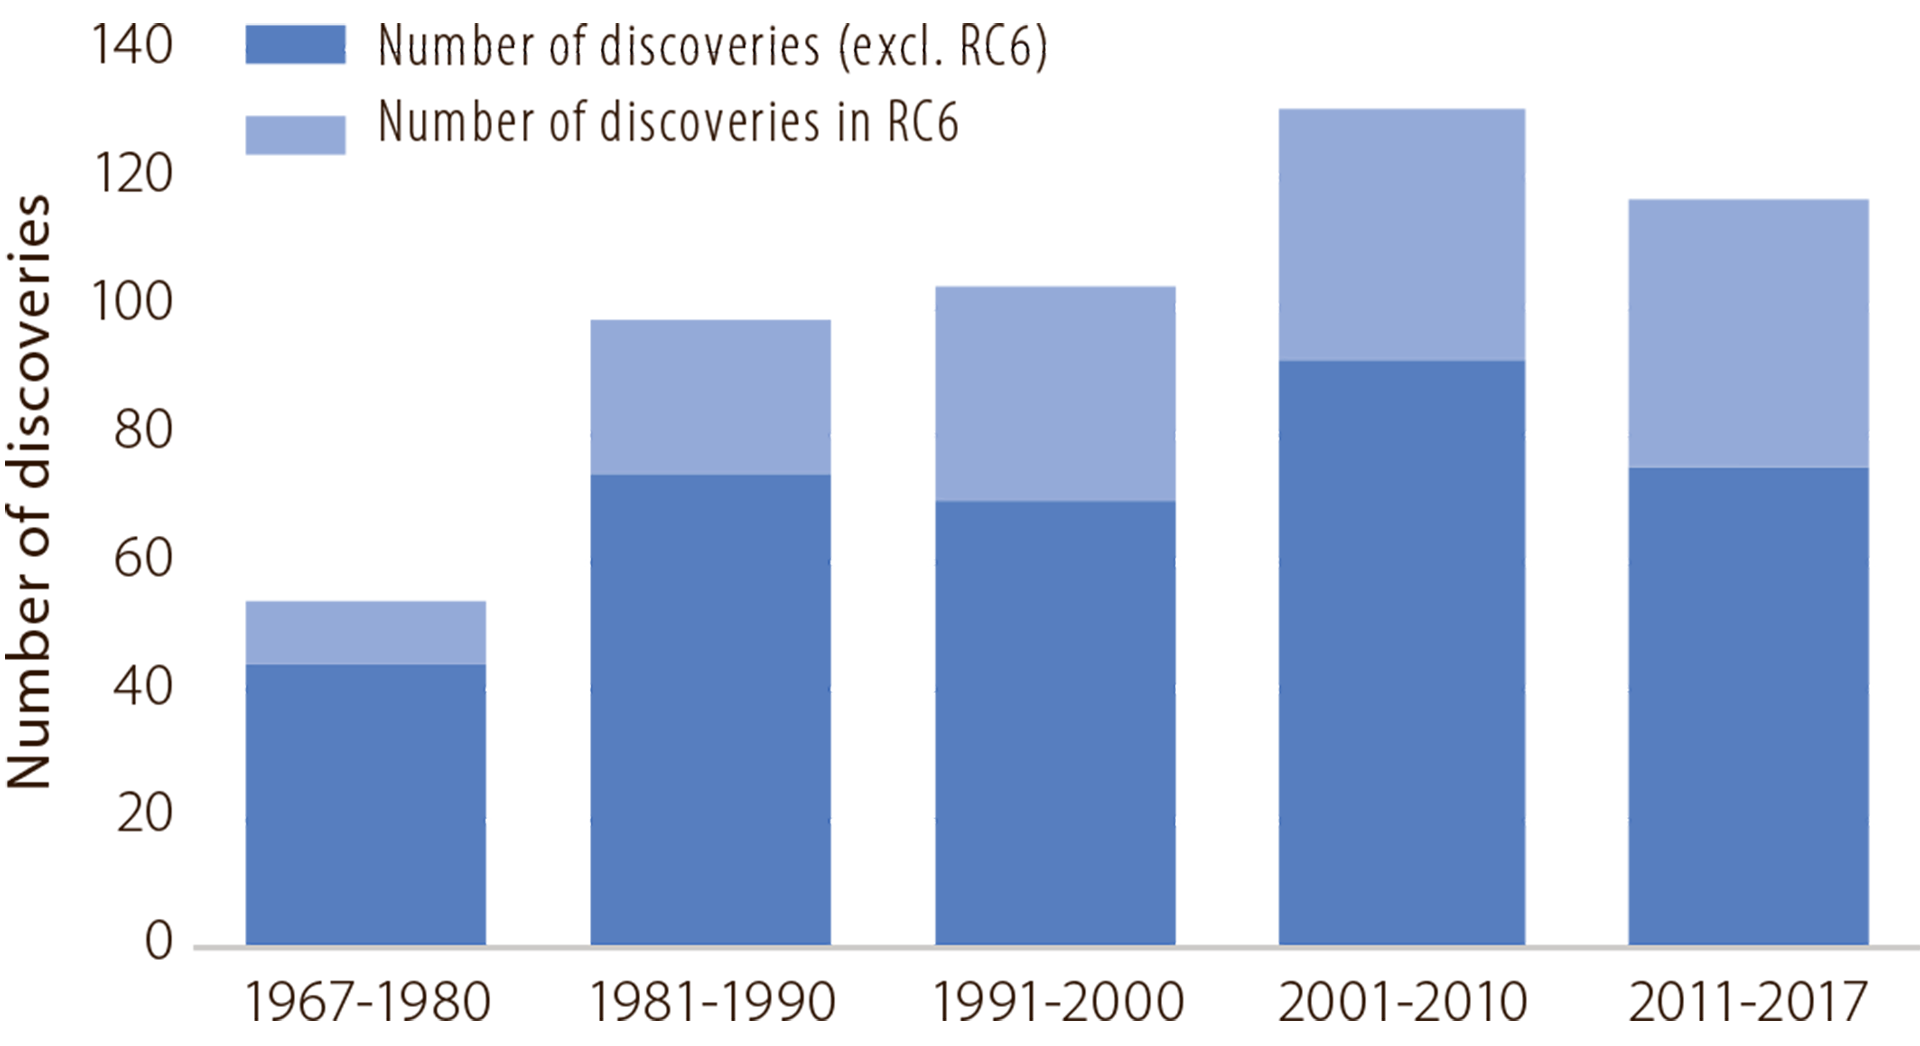
Figure 2.3
Discoveries
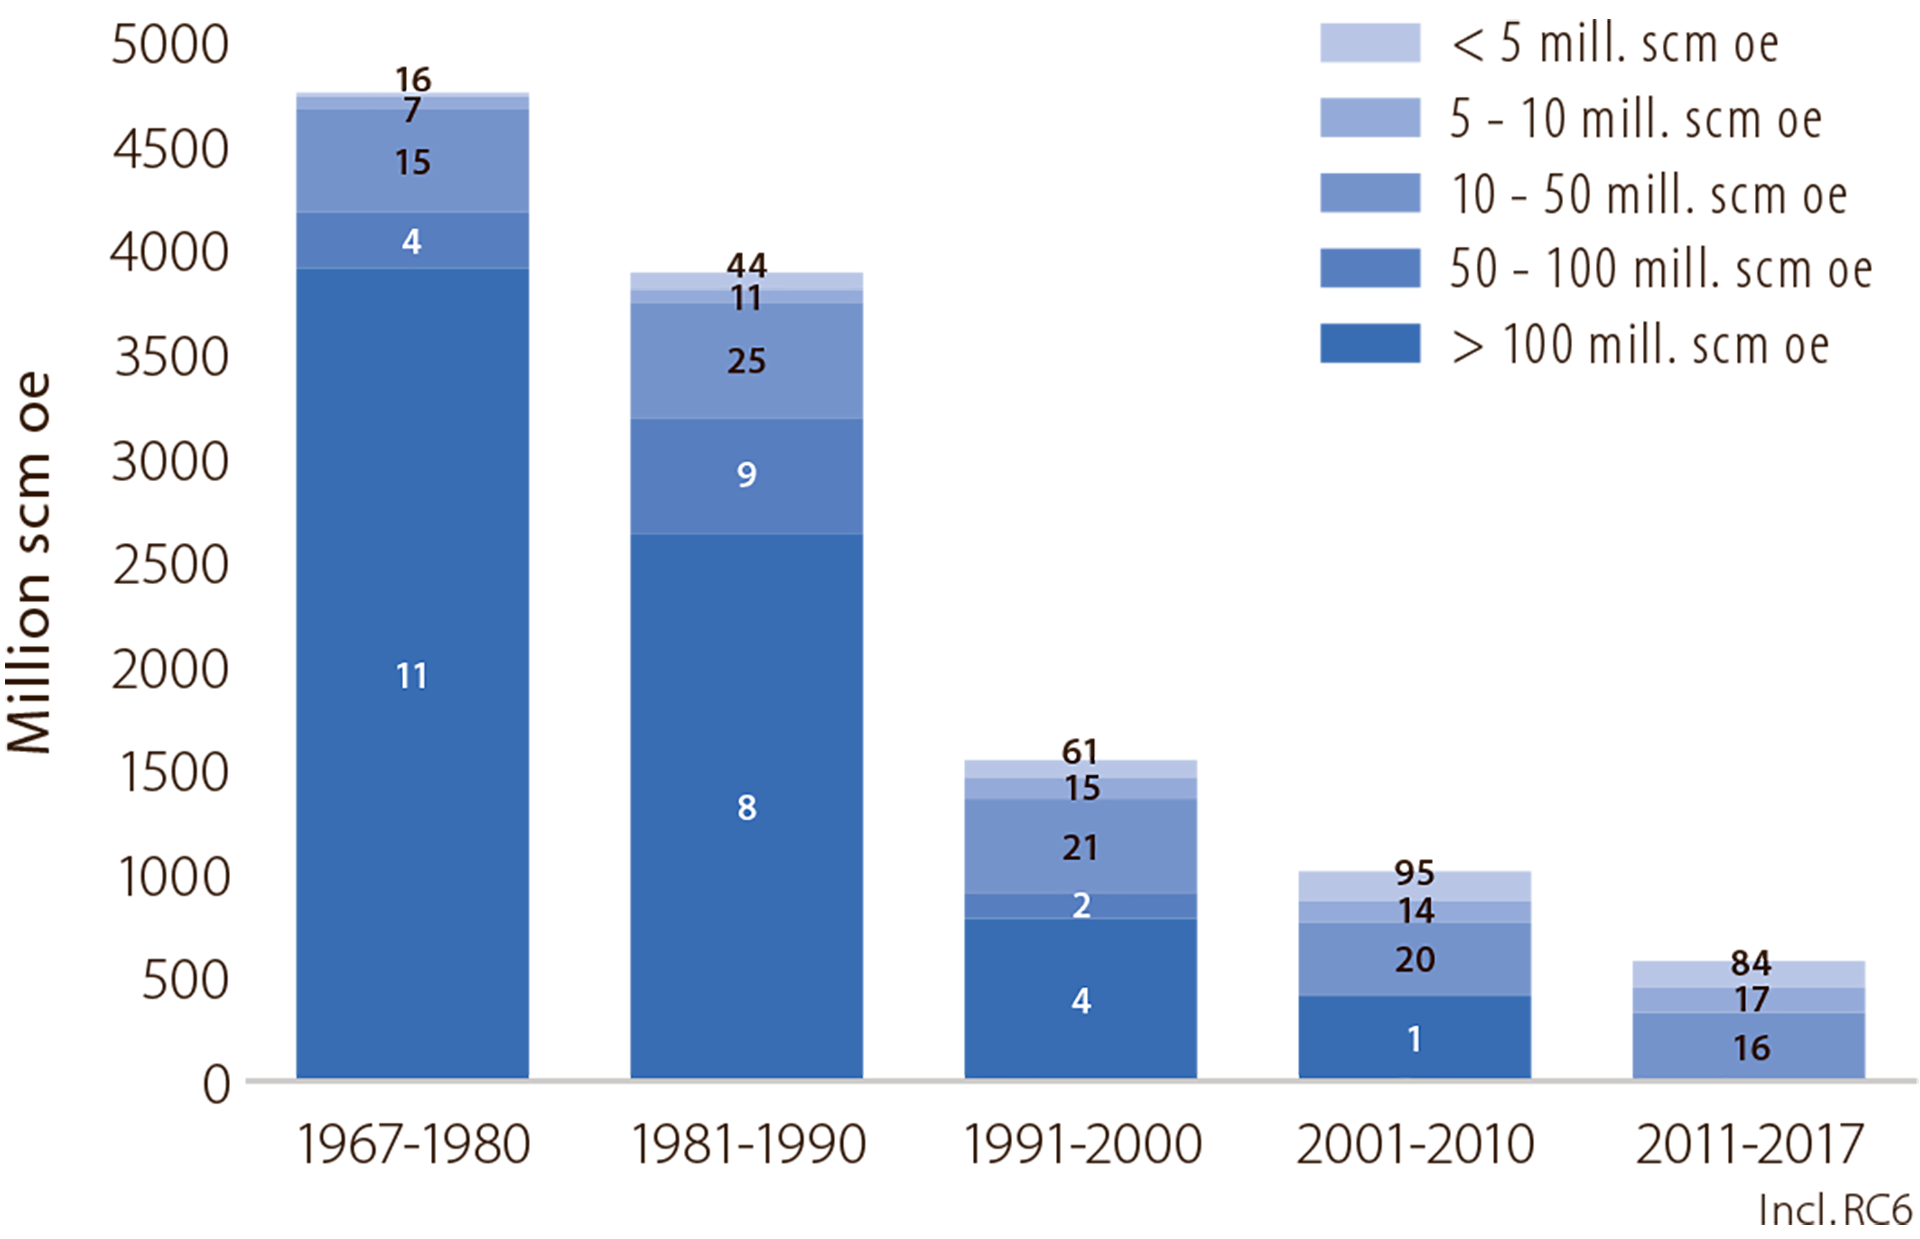
International experience shows that the biggest finds are made early in the exploration phase of a new petroleum province, and that discovery size declines as the latter matures. This also applies to the NCS (figure 2.4). With the exception of Ormen Lange in 1997 and Johan Sverdrup in 2010, the largest finds were made in the first 20 years and discovery size has declined from the mid-1980s. The average discovery size (excluding resource class 6 (RC6) – see chapter 1 for a definition) over the past seven years has been about seven million standard cubic metres of oil equivalent (scm oe). Discovery size in figures 2.4 and 2.5 is based on the current estimate, not that reported when the discovery was made. The original estimate can differ from the current figure. Discovery size can increase or decrease over time in line with new knowledge about the reservoir.

Figure 2.4
Resource growth by discovery size.
The number of discoveries is shown in the bars
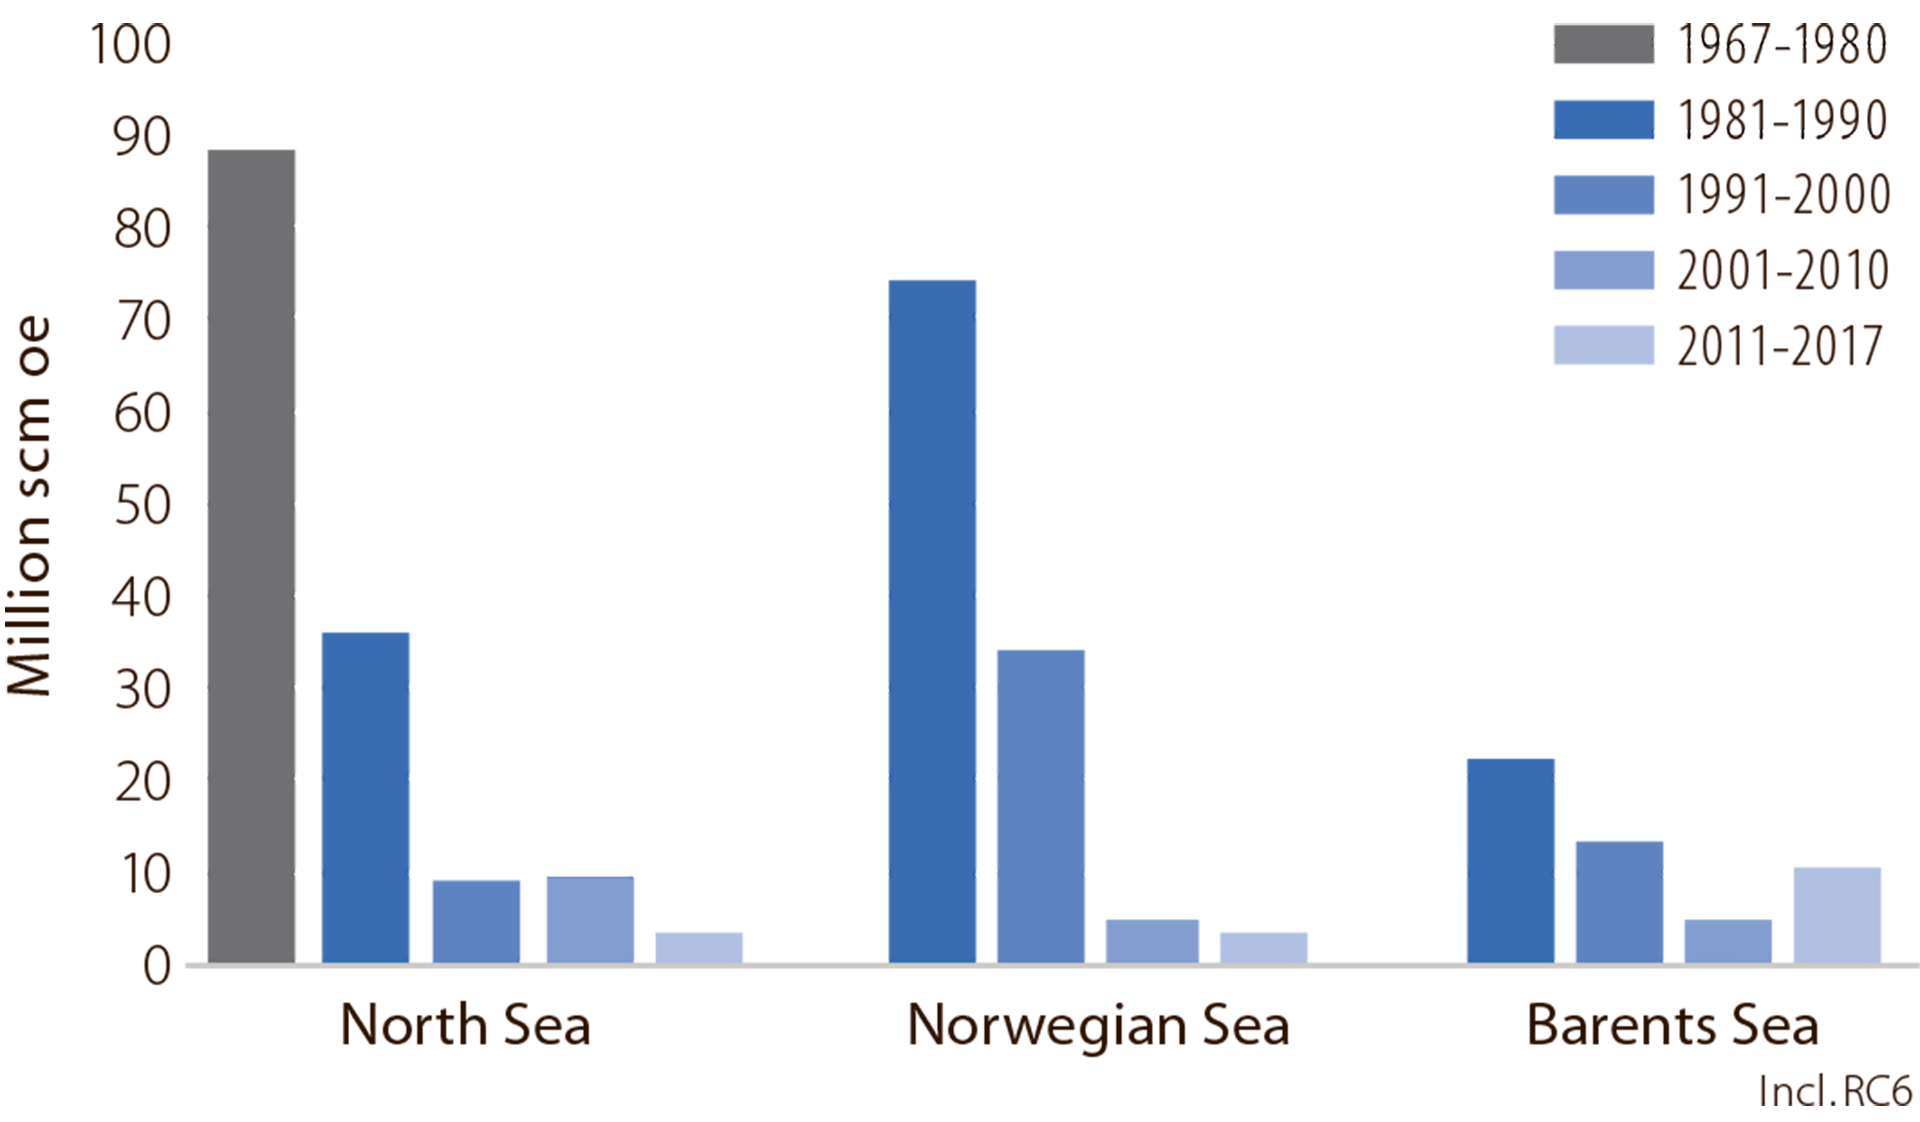
The decline in average discovery size reflects the fact that the NCS has become more mature (figure 2.5). However, even very small finds can show good profitability if existing infrastructure is used effectively (see more in chapter 4). Maintaining a high level of exploration is important for identifying and developing small discoveries while the big installations are still on stream.

Figure 2.5
Average discovery size by area
RESOURCE GROWTH AND PRODUCTION
The reduction in average discovery size has also meant a decline in resource growth over time. It has been substantially smaller from discoveries over the past 30 years than in the first two decades of Norwegian oil history. Figure 2.4, showing resource growth from discoveries by size, illustrates the trend. Resource growth in the various sea areas is presented in fact box 2.5.
During the first decade after Ekofisk was found in 1969, the big Statfjord, Sleipner Vest, Gullfaks and Oseberg fields were discovered and are still on stream. Most of the other largest fields followed in 1979-84 (figure 2.6). Almost 65 per cent of all proven resources were found in this period. The figure shows that, with the exception of Ormen Lange and Johan Sverdrup, resource growth from exploration has been low for the past 30 years. By and large, the annual figure has been smaller than production over the past two decades. Output has largely come from fields discovered in production licences awarded from 1965 to the early 1990s.

Figure 2.6
Annual resource growth and production.
Figure 2.7 presents resource growth by decade of licence award. Almost half the total resource growth from exploration (by decade of licence award) has come from discoveries in licences awarded in the first to fifth licensing rounds (before 1980). Many of the exploration wells drilled over the past decade were located in pre-1980 acreage. That partly reflects the further development of new and known plays based on additional seismic surveys and continuous exploration drilling, combined with improved interpretation tools and methods (see chapter 6). Infrastructure expansion, further progress with new development concepts and innovative drilling technology have also made it financially interesting to explore ever-smaller prospects.

Figure 2.7
Resource growth by decade of licence award.
ACCESS TO ACREAGE
The government gives great emphasis to making acreage regularly available, which is important for maintaining interest in exploration and ensuring the development of commercial discoveries. Companies primarily gain access to acreage through licensing rounds, but can also buy or swop licence interests.
In line with the growth in the number of companies and licences, and with oil price trends, the secondary market (acquisition, swop and sale) for interests has expanded substantially since 2007. It peaked in 2013 (figure 2.8).

Figure 2.8
Farm-ins and swops of licence interests.
LICENSING ROUNDS
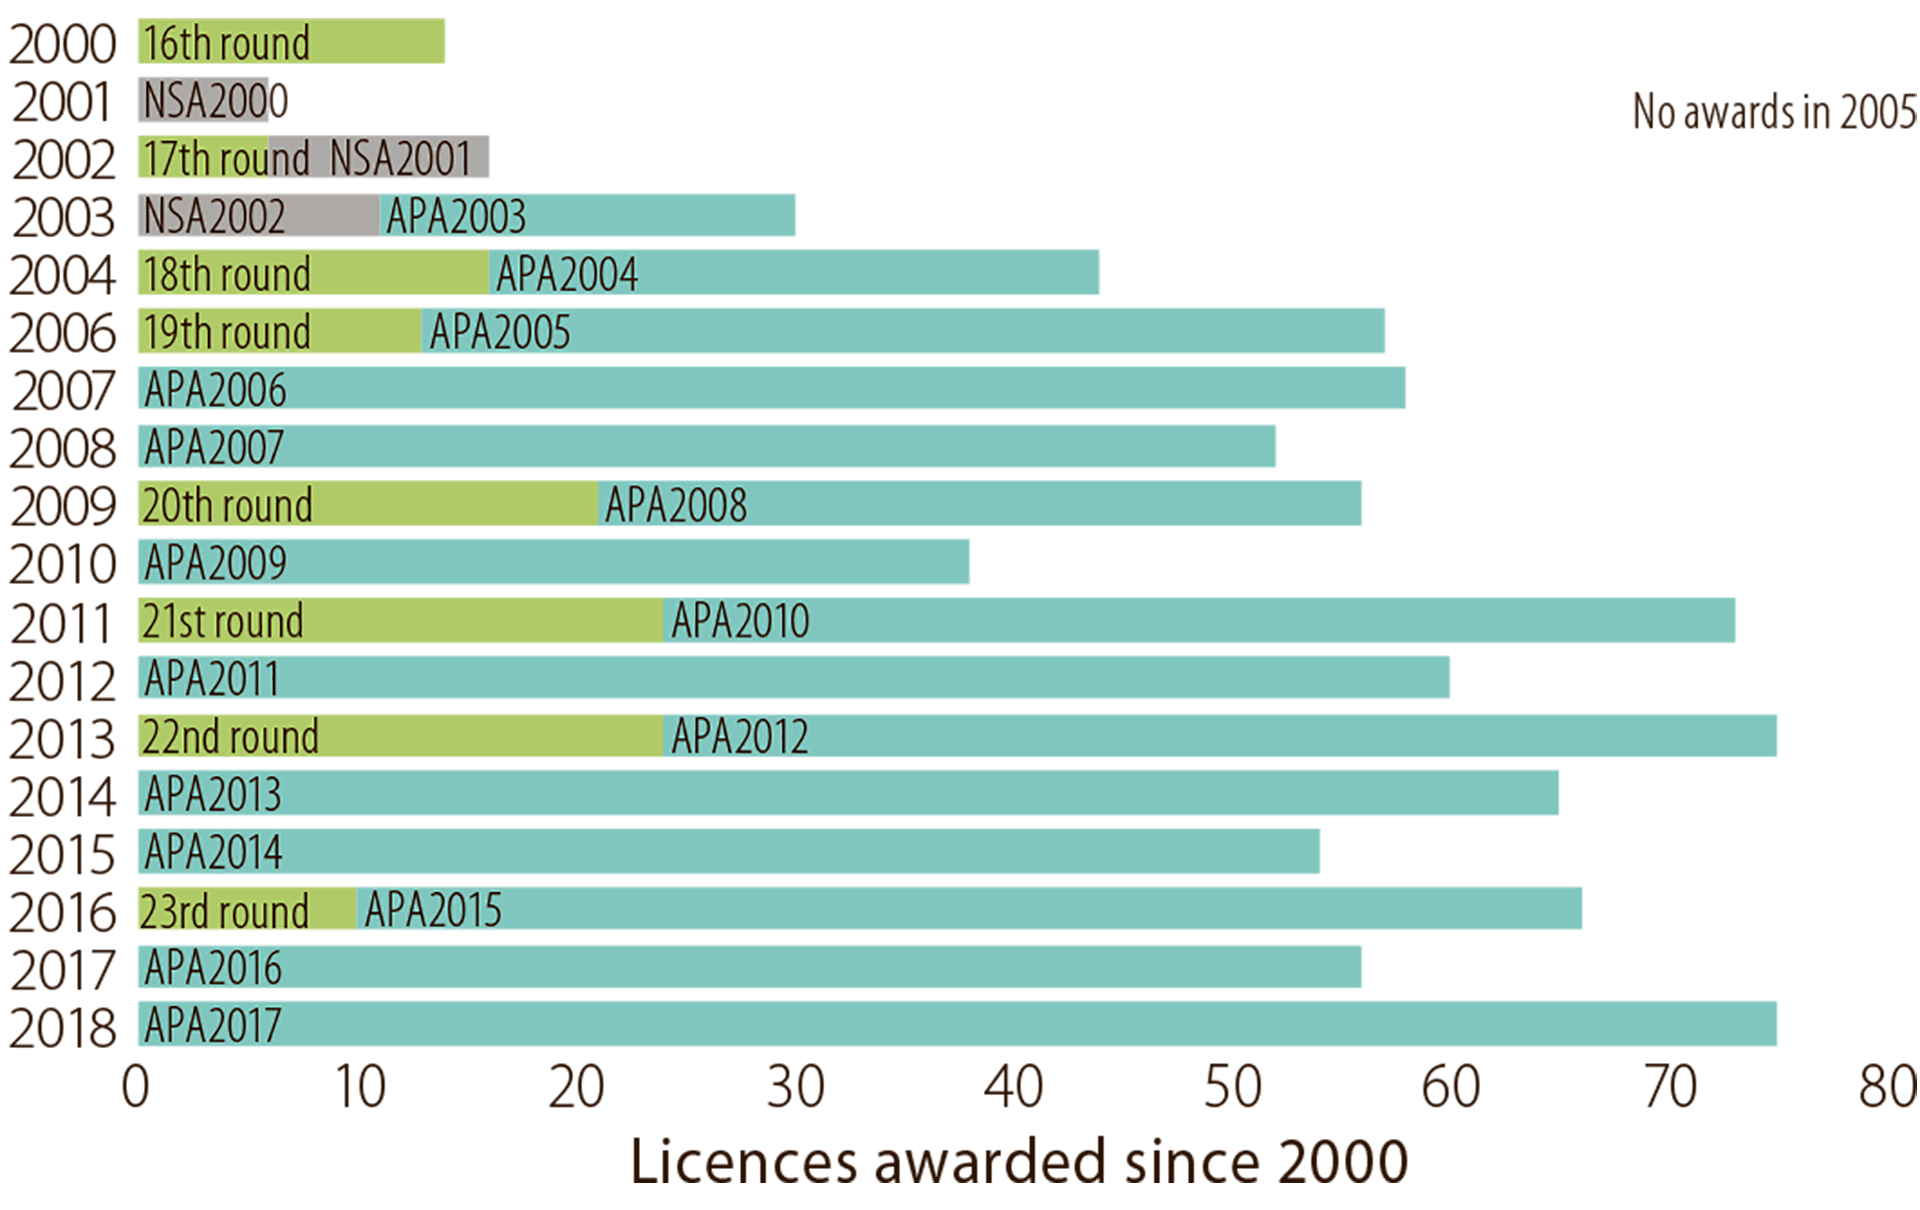
Two types of licensing rounds with equal status are conducted on the NCS – numbered, and awards in predefined areas (APA).5 APA rounds have taken place annually since 1999, while the numbered rounds in less-explored exploration areas are generally staged every other year. These regular rounds contribute to important predictability for the industry. The scope of awards is presented in figures 2.9 and 2.10.
5 They were called North Sea awards (NSA) from 1999 to 2002.

Figure 2.9
Annual licence awards since 2000.

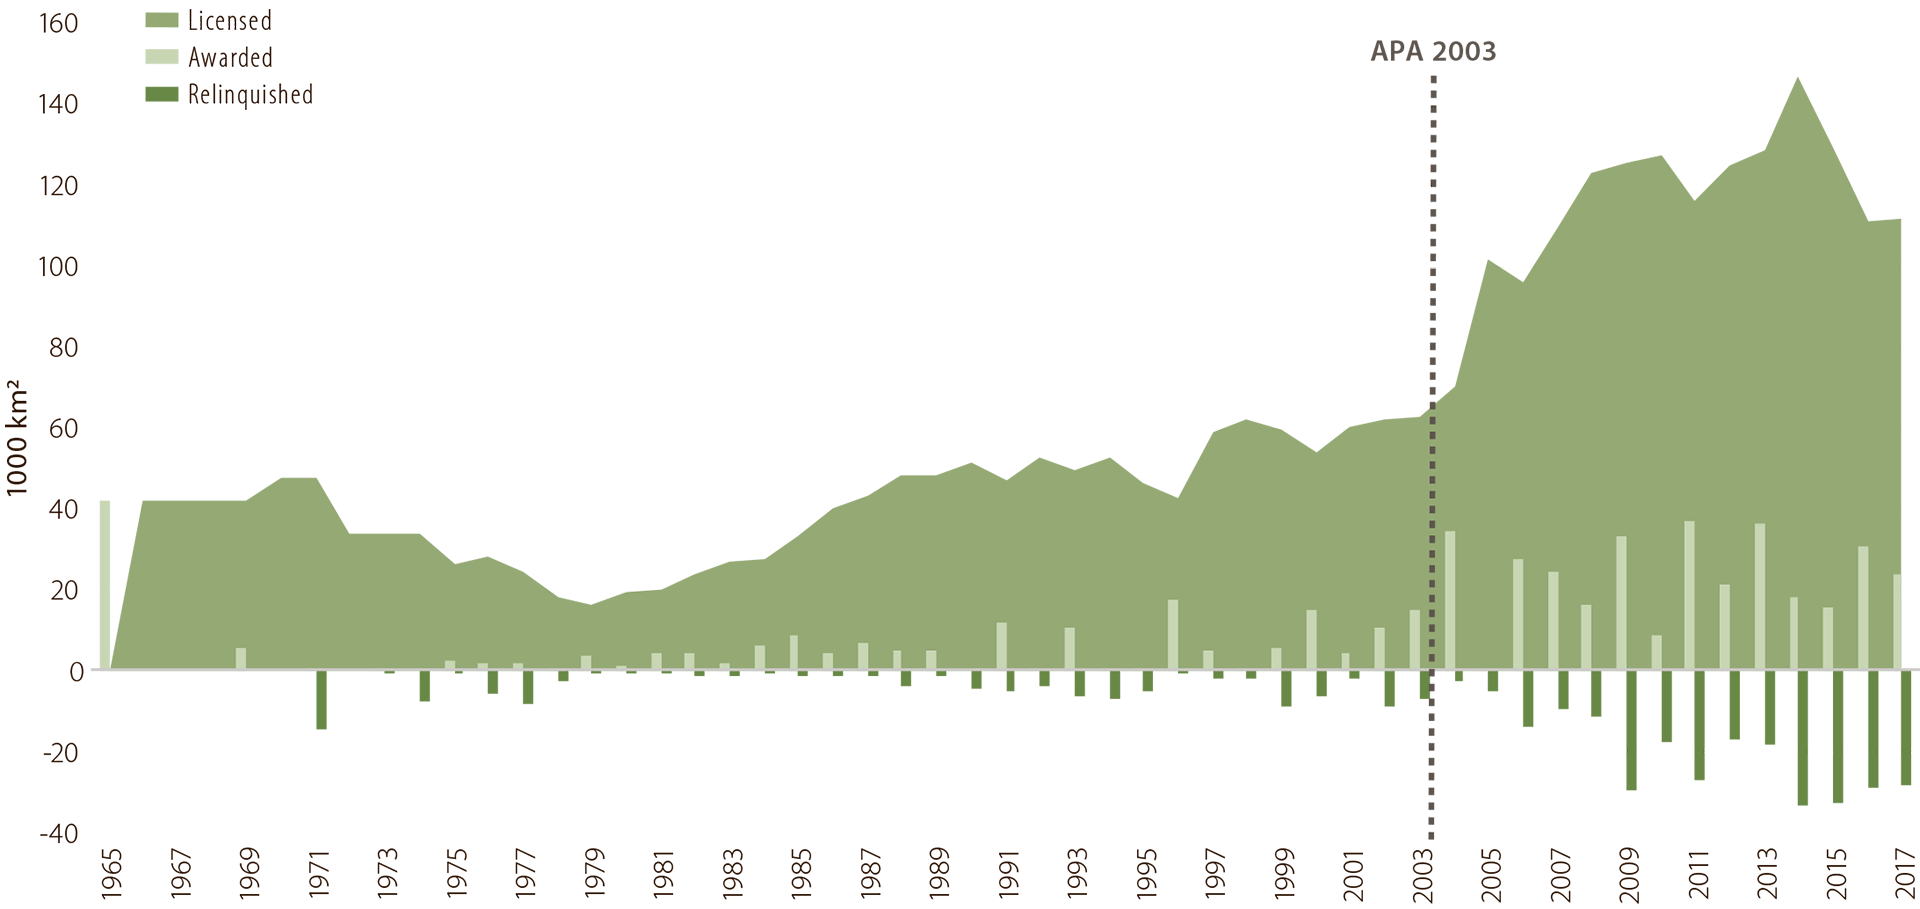
Figure 2.10
Acreage awarded, licensed and relinquished.
The first licensing round in 1965 was clearly the most extensive in terms of acreage on offer. While the first four rounds were confined to the North Sea, parts of the Norwegian and Barents Sea were opened for exploration from the fifth round held in 1980-82.
Introduced in 2003, the APA scheme is intended to ensure efficient exploration of mature areas and to prove time-critical resources close to planned and existing infrastructure (fact box 2.3). It is important that acreage awarded gets explored quickly and efficiently so that existing infrastructure can be utilised in the best possible way and small discoveries are phased in swiftly if spare capacity is available. As new areas become mature, the APA coverage has been expanded on the basis of established criteria. See report no 28 (2010-2011) to the Storting on the petroleum sector as an industry for the future. One of the following criteria must be met: the area is close to infrastructure, has an exploration history, or borders on existing predefined areas but has not been applied for in numbered rounds. Predictability about the areas which can be applied for, with a steady addition of new acreage, is important for the effectiveness of the scheme. Since the APA rounds were introduced, the number of licences and the amount of acreage awarded have increased considerably (figures 2.9 and 2.10).
More acreage has been relinquished over the past decade than before. Faster circulation of acreage was precisely one of the goals of the APA scheme. Stricter work programmes (fact box 2.2) and an increased area fee mean that licensees must work faster to evaluate prospectivity and relinquish holdings they find uninteresting. That means this acreage becomes available more quickly for other players with new eyes and ideas.
FACT BOX 2.2: Work programme |
|
The government attaches obligations (a work programme) to production licences. Changes have occurred with these programmes as the NCS has matured. In the early rounds, when the NCS ranked as a frontier area and information was lacking, requirements often involved acquiring seismic data and drilling a specific number of firm wells. In the APA rounds covering mature areas, a licence is often required to acquire seismic data, through either purchases or surveys. A “drill or drop” obligation is also imposed. This means that the licensees have one-three years to decide whether to spud a wildcat. If they decided to drill, the licence is retained. If not, it lapses. Should a commercial discovery be made, the licensees must decide whether a plan for development and operation (PDO) is to be submitted. This process, with average figures from 2000, is illustrated in figure 2.11. Licences which require a fixed number of wells to be drilled are still awarded in APA rounds, but on a smaller scale than before. This is because the largest and best-defined structures have already been drilled. Mapping remaining prospects is harder, and more extensive geoscientific analyses are often needed before a drilling decision can be taken.
Figure 2.11
|

FACT BOX 2.3: Changes to the regulatory framework and licensing policy |
|
Licensing policy in mature areas was revised in 1999 by establishing the annual NSA rounds, which were further developed in 2003 into the APA. The aim was to prove and recover commercial resources in mature areas before the infrastructure closed down. Another important objective was to contribute to efficient exploration at the companies by providing greater predictability for the industry through a regular supply of new acreage. The government also made provision in 2000 for admitting new companies, and the offer to prequalify as operators and licensees was established. This scheme aimed to help improve predictability for new companies seeking to become established on the NCS, either through awards or by farming into licences. A reimbursement system for exploration costs introduced with effect from 1 January 2005 put companies without taxable earnings on an equal footing with those which have such revenues in terms of the tax treatment of exploration expenses. The scheme gives companies with a tax-deductible loss the right to have the tax value (78 per cent) of their exploration costs reimbursed rather than carrying them forward with a supplement for interest. These alternatives have the same financial outcome for the government. The goal of the reimbursement scheme was to reduce entry barriers by putting new companies in the exploration phase on an equal footing with established players who had taxable earnings. |
FACT BOX 2.4: Relicensing acreage |
|
Much of the acreage being explored today has been awarded and relinquished several times (figure 2.19). Improved seismic data, information from more wells, innovative technology, and new thinking and ideas mean that petroleum resources are being proven in areas which have been explored many times before. A number of areas covered by the APA scheme and around the big North and Norwegian Sea fields have been awarded four or five times. Although acreage is awarded several times, substantial discoveries can still be made. 16/2-6 Johan Sverdrup, the Johan Castberg discoveries 7220/8- 1 (Skrugard) and 7220/7-1 (Havis), and 7220/11-1 (Alta) are good examples. |
24TH LICENSING ROUND
Ahead of the announcement of a numbered licensing round, the companies are invited to nominate blocks they believe should be included. The NPD then prepares a recommendation to the Ministry of Petroleum and Energy (MPE) on the acreage which should be put on offer.
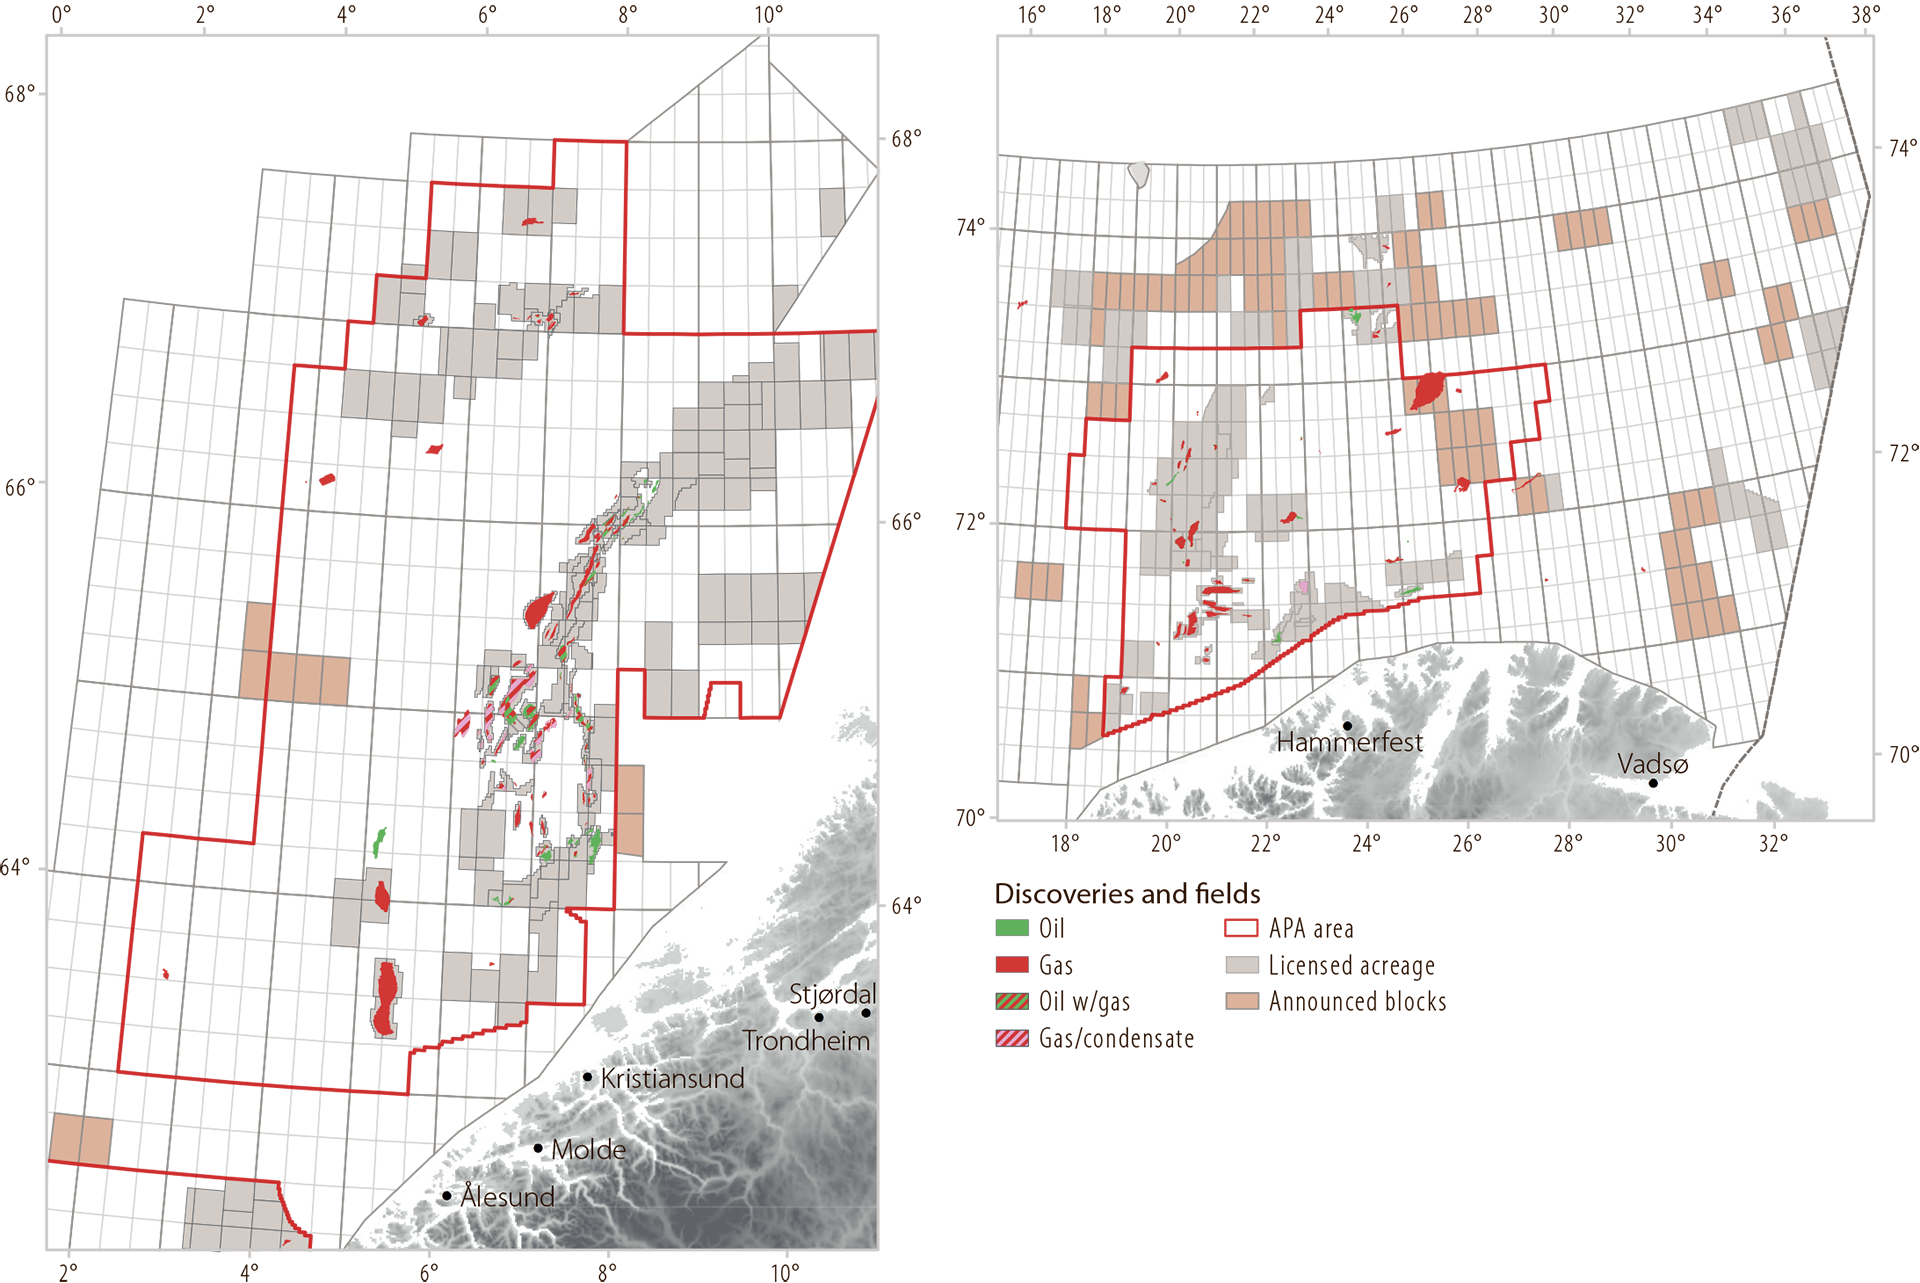
The 24th round was announced on 21 June 2017 with a deadline of 30 November 2017 for applications. It included 102 full or partial blocks – nine in the Norwegian Sea and 93 in the Barents Sea (figure 2.12). APA 2017 AND 2018 Mature areas of the NCS remain attractive. A new record for the number of applications was set by the 2017 APA round, with 39 companies applying. This big interest partly reflected access to new and improved seismic data. Large parts of the NCS, particularly the mature areas of the North and Norwegian Seas, are now covered by broadband surveys. Combined with increased computing power and innovative interpretation and visualisation tools, that has made it possible to identify new exploration opportunities – including in previously explored acreage.

Figure 2.12
Blocks put on offer in the 24th round.
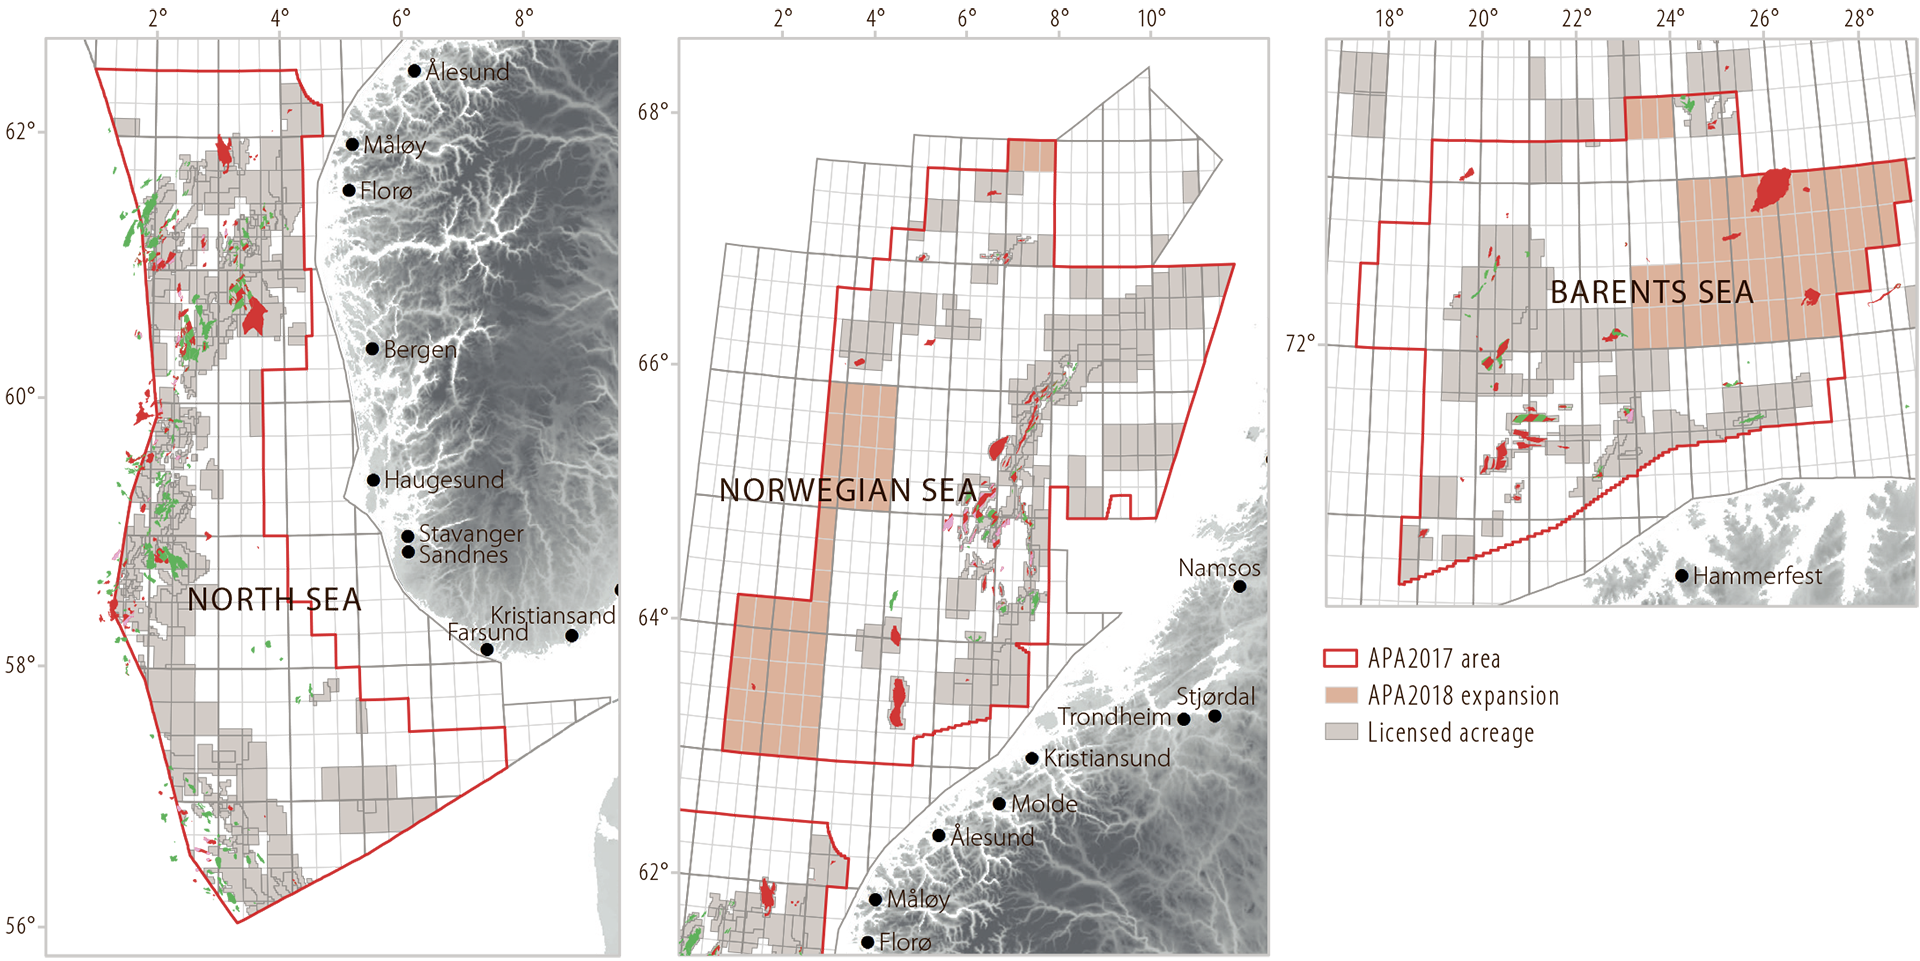
Figure 2.13 shows the extent of the expansion for the 2018 APA round. Since the 2017 round, the predefined areas have been expanded by 47 blocks in the Norwegian Sea and 56 in the Barents Sea. Applications can be submitted for all unallocated full or part blocks in these areas.

Figure 2.13
APA 2018 expansion.
EXPLORATION TRENDS ON THE NCS, 2000-17
WILDCATS
Developments in the number of wildcats by sea area in 2000-17 are illustrated in figure 2.14.

Figure 2.14
Wildcats by area.
Relatively few wildcats were drilled in the North Sea during 2000-05, but the number increased substantially from 2007.
Exploration remained high until 2016, with an average of 21 wildcats per year. Only eight wildcats were drilled in the North Sea during 2017. Exploration in the Norwegian Sea has varied rather more than in the North Sea. Activity there was also high from 2008, but fell to three wildcats spudded in 2016.
In the Barents Sea, exploration has varied throughout the period. Since 2009, the number of wildcats has fluctuated between one and 12. Activity increased in 2017, and 17 wildcats were drilled.
DISCOVERIES
Developments in the number of discoveries after 2000 by area are presented in figure 2.15. The high level of exploration after 2006 resulted in a big increase in finds. Most were made in the North Sea with the exception of 2013, when the Norwegian Sea accounted for the majority, and 2014 and 2017, when the Barents Sea topped the list.

Figure 2.15
Discoveries by area.
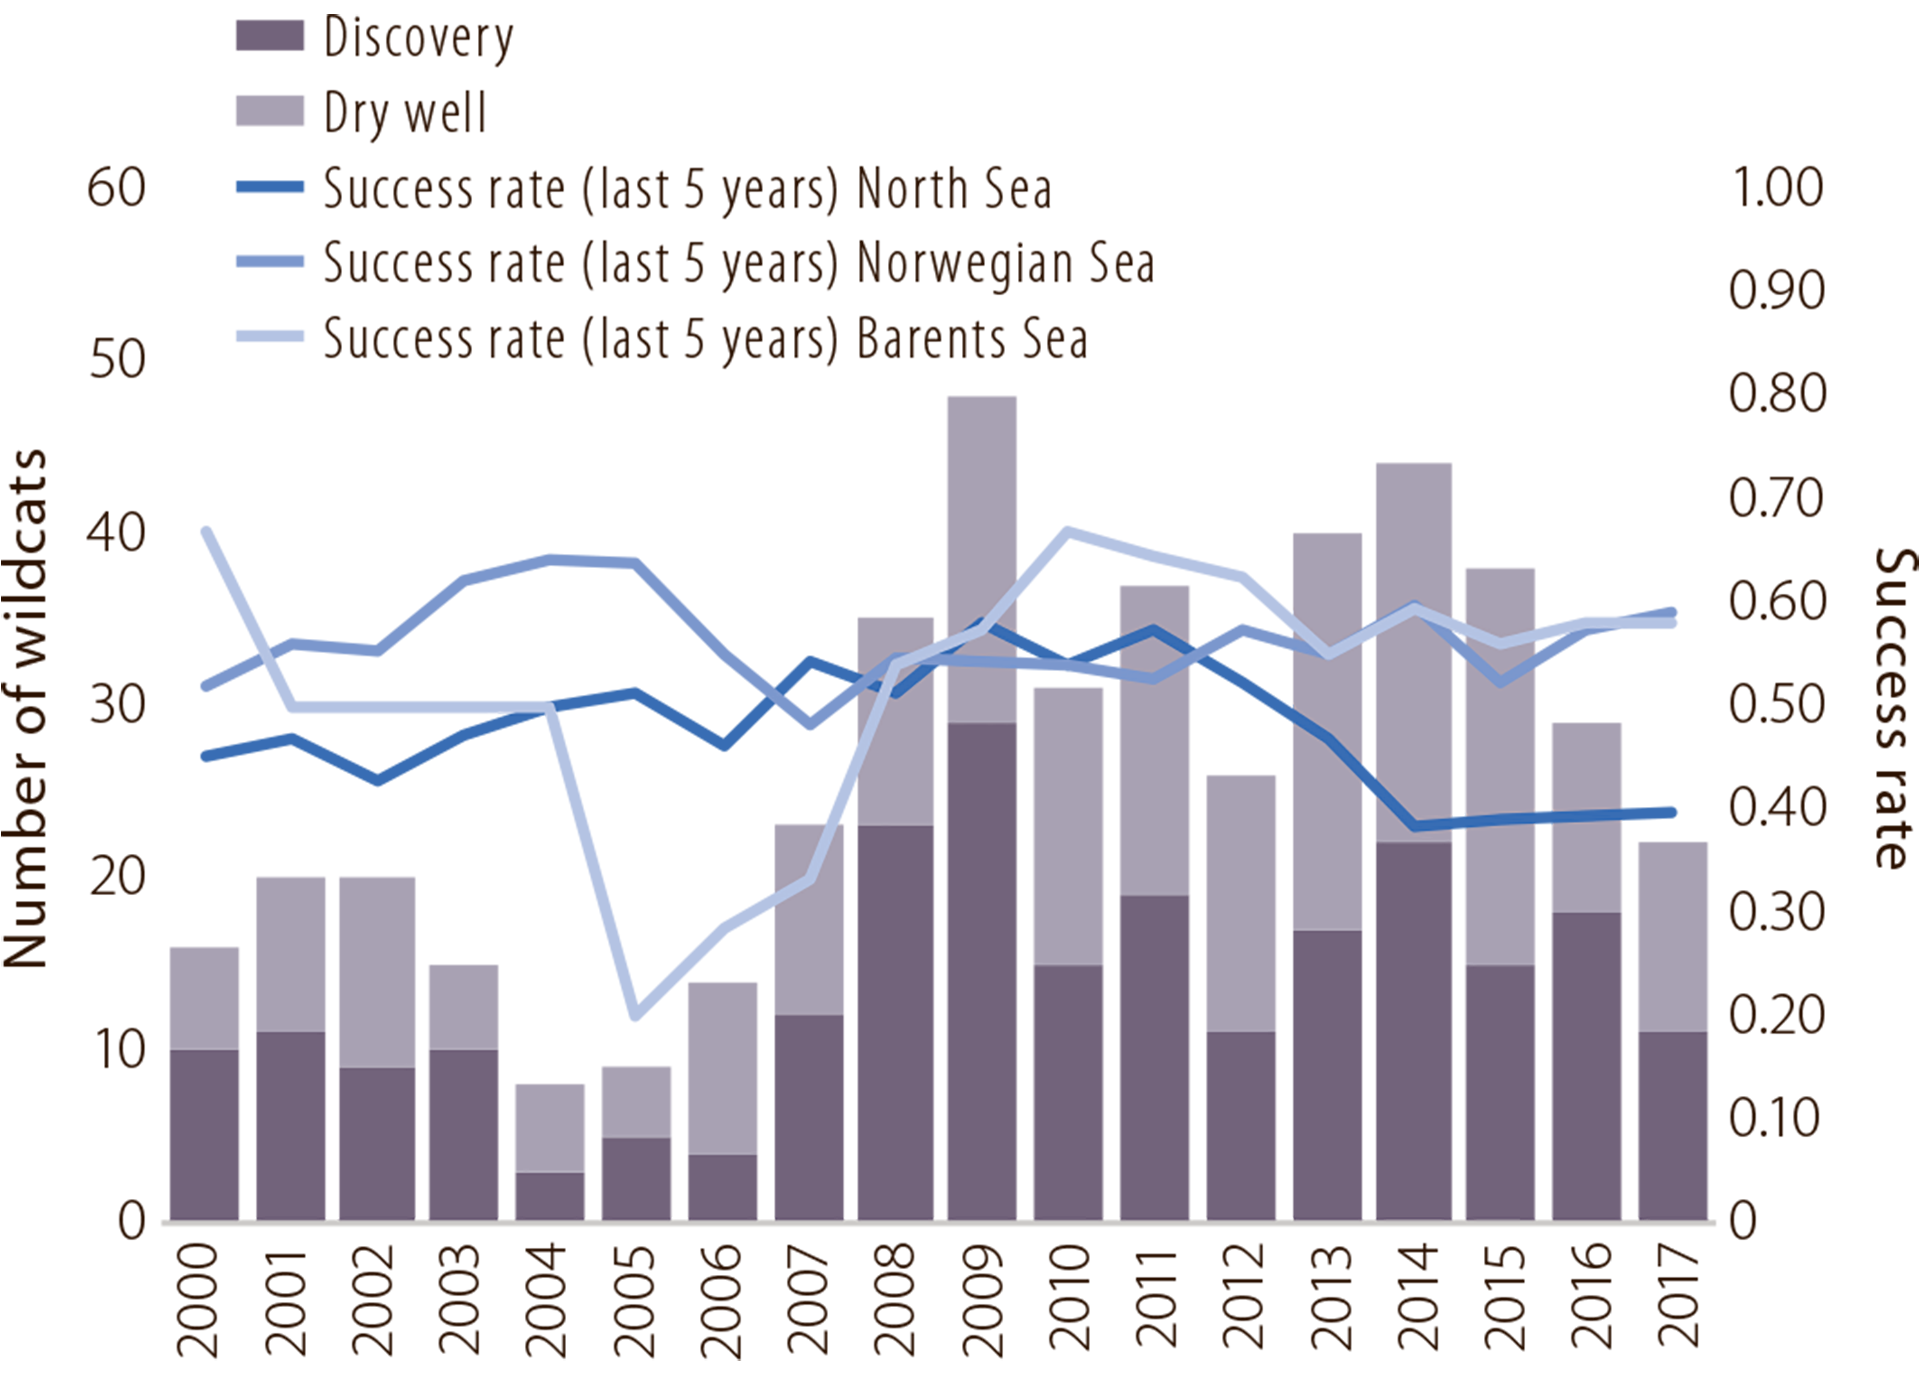
SUCCESS RATES
The average technical success rate (discoveries as a proportion of wildcats) has varied over time and between the different areas (figures 2.16 and 2.17). It has lain around 50 per cent in recent years (see chapter 6).

Figure 2.16
Technical success rate and average discovery size.

Figure 2.17
Technical success rate and wildcats by area.
ACCUMULATED RESOURCE GROWTH BY AREA
Overall resource growth in the Norwegian and Barents Seas during the past 18 years has been somewhat lower than in the North Sea (figure 2.18). A total of 257 discoveries were made in 2000-17, of which 36 were larger than 10 million scm oe. One really large find (Johan Sverdrup) was made in this period, and accounted for 24 per cent of total resource growth.6
6 The resource estimate for Johan Sverdrup is about 400 million scm oe, including phase two of the development project. Source: Equinor
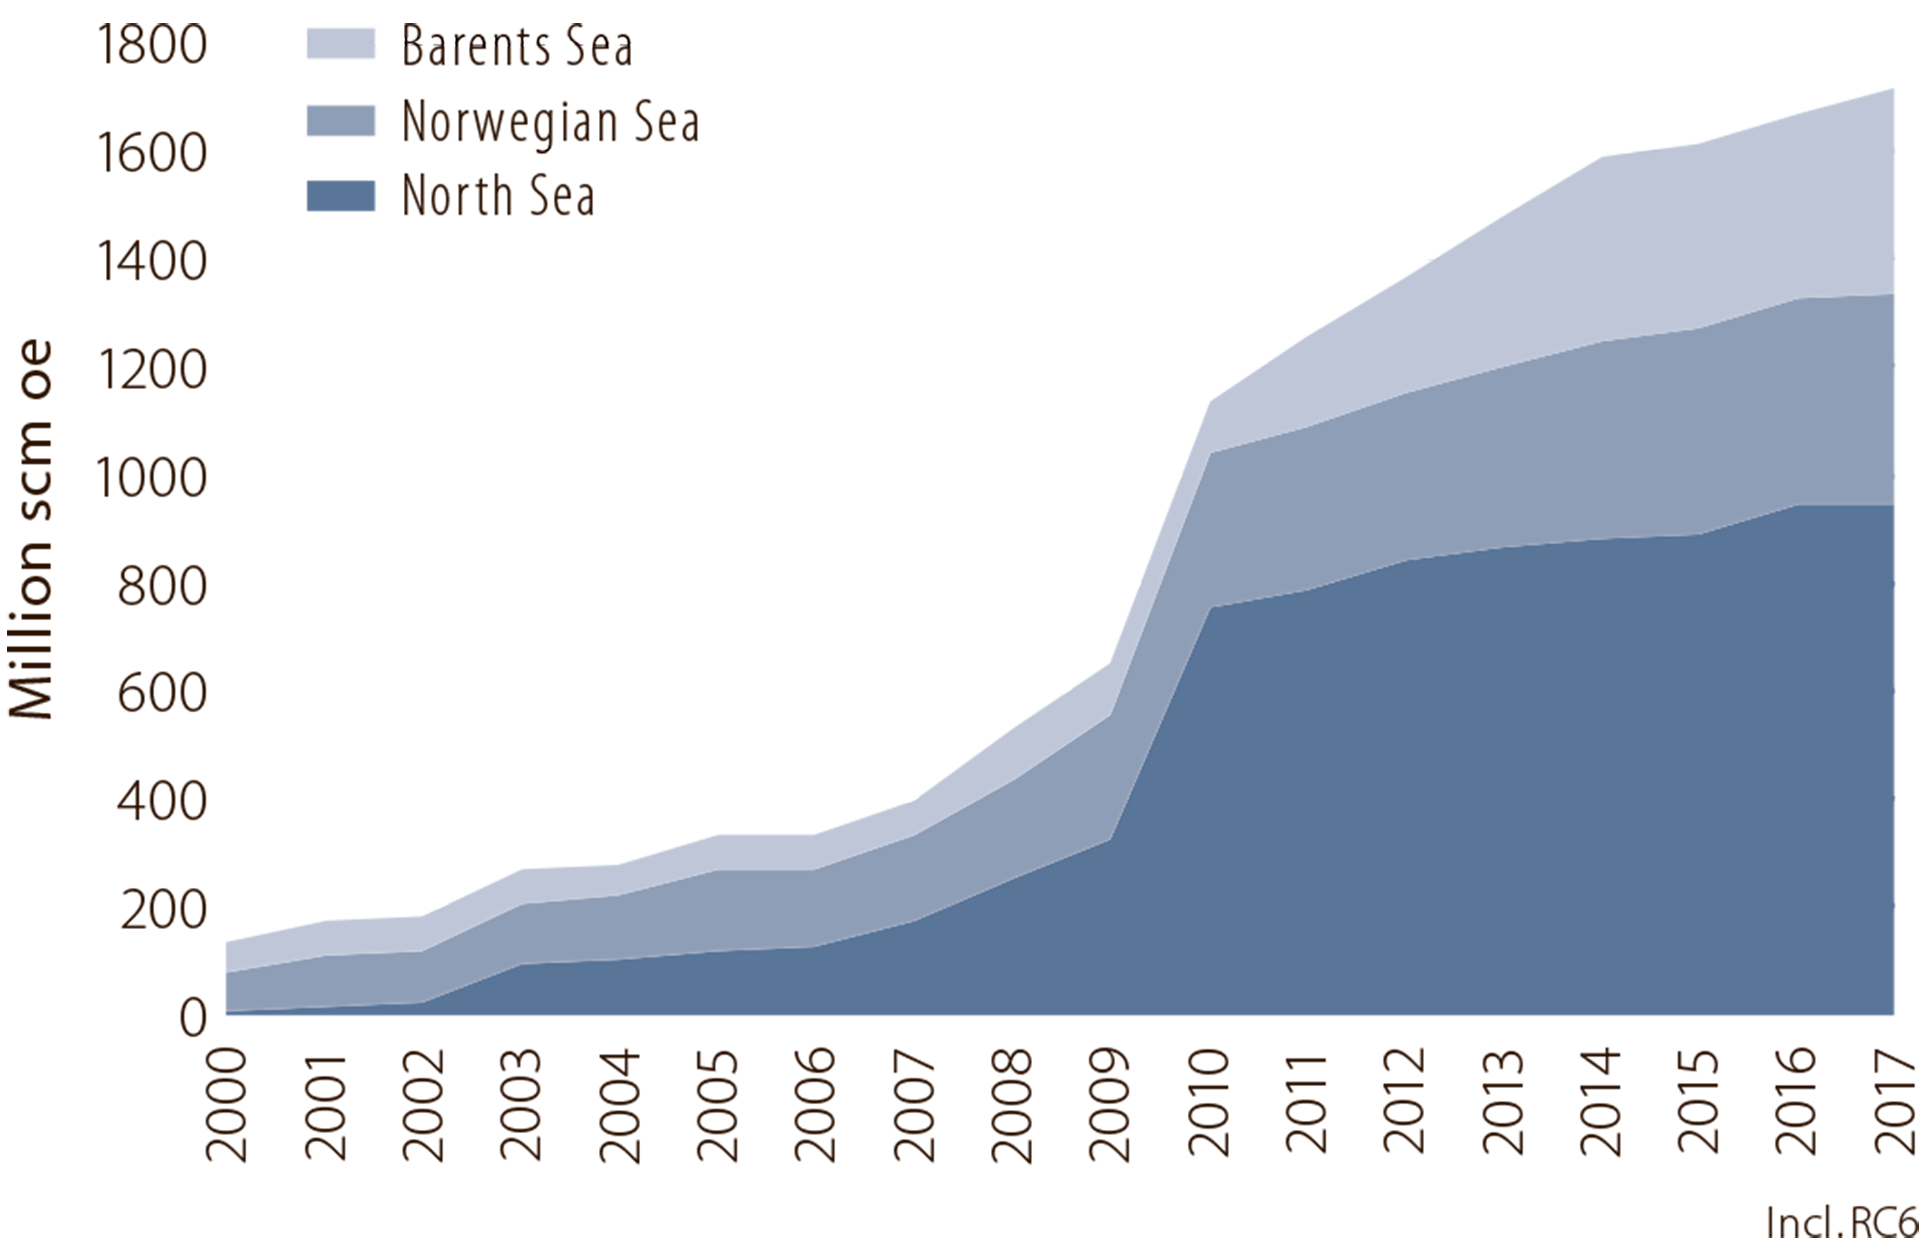
Figure 2.18
Accumulated resource growth by area.
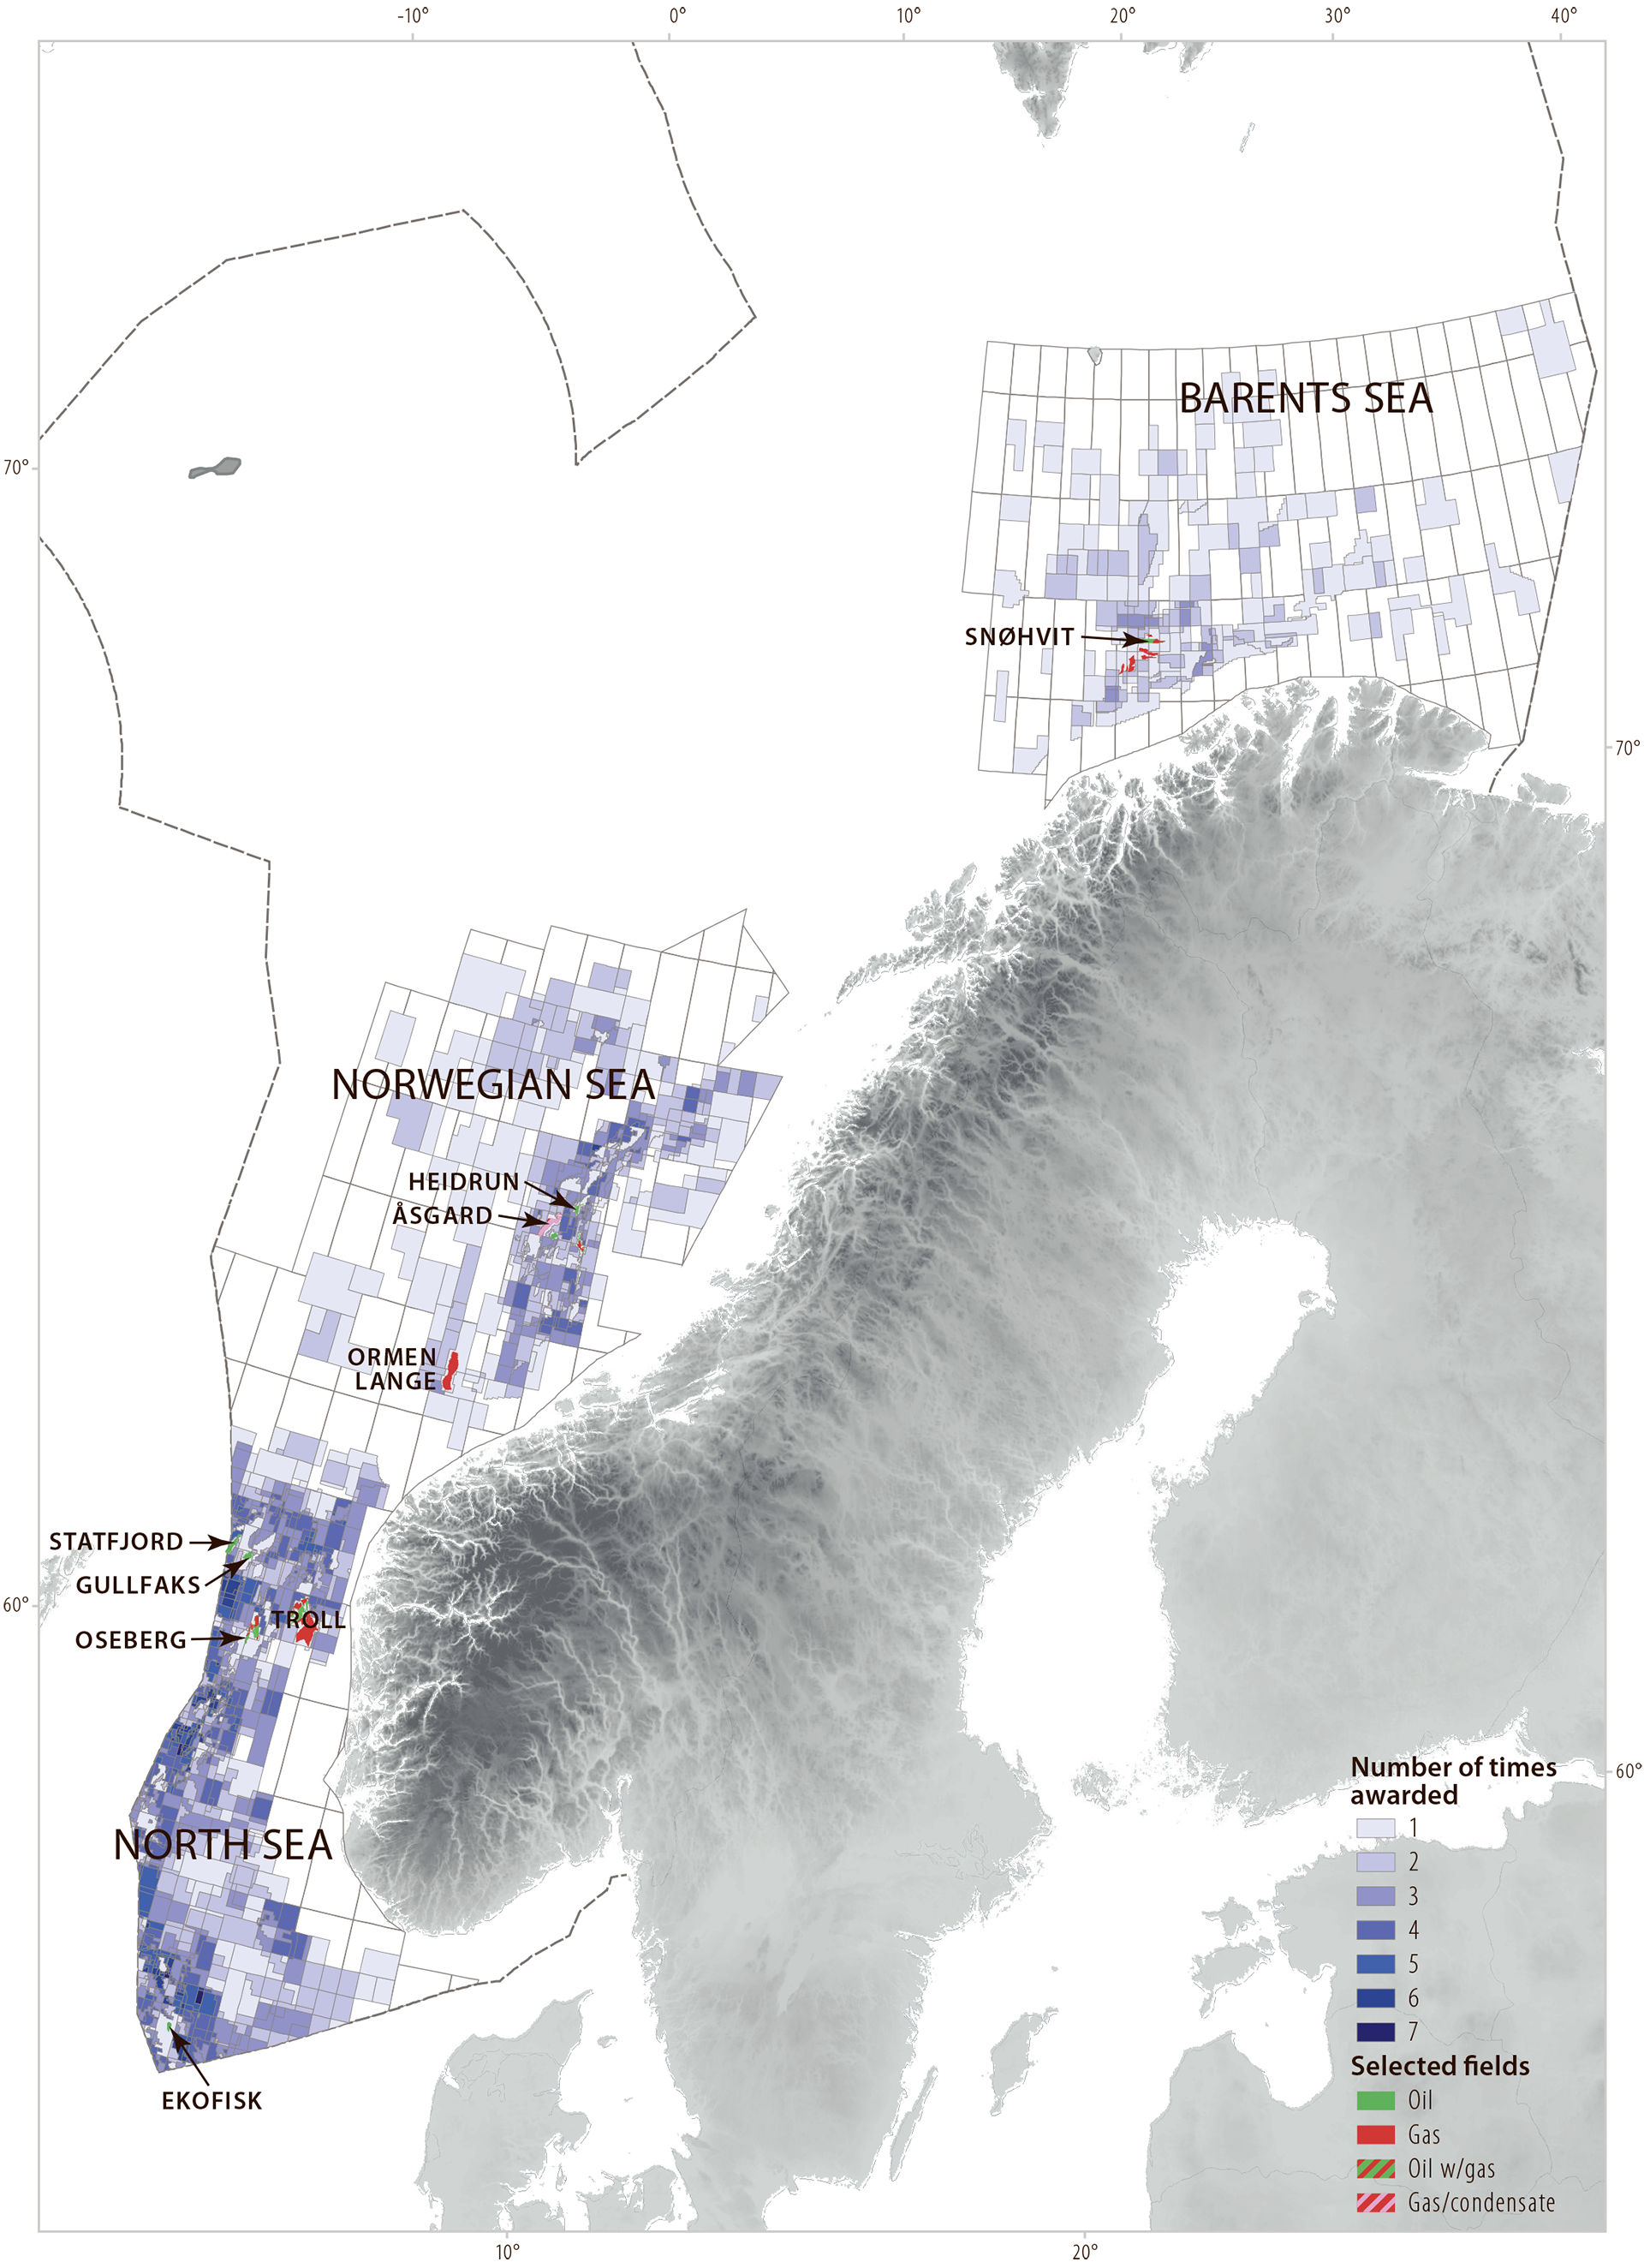 Figure 2.19
Number of times acreage has been awarded.
The biggest contributions to resource growth in the Barents Sea have come from 7324/8-1 (Wisting), 7220/7-1 (Havis) and 7220/8-1 (Skrugard). Contributors in the Norwegian Sea include 6507/5-3 (Ærfugl) and 6406/3-8 Maria. Of the 257, 175 are below five million scm oe. Such smaller discoveries account for 14 per cent of resource growth. Fact box 2.5 presents resource growth in the various areas of the NCS.
EXPLORATION RESULTS 2016-17
Seventy-one exploration wells were completed on the NCS in 2016-17, of which 52 were wildcats. A total of 29 discoveries were made, giving a success rate of 62 per cent in 2016 and 50 per cent in 2017. The biggest finds in this period were 36/7-4 (Cara) and 31/7-1 (Brasse) in the North Sea, and 7219/12-1 (Filicudi) and 7435/12-1 (Korpfjell) in the Barents Sea. Figure 2.20 shows all the finds made in the period, while fact box 2.5 presents resource growth in the various sea areas.
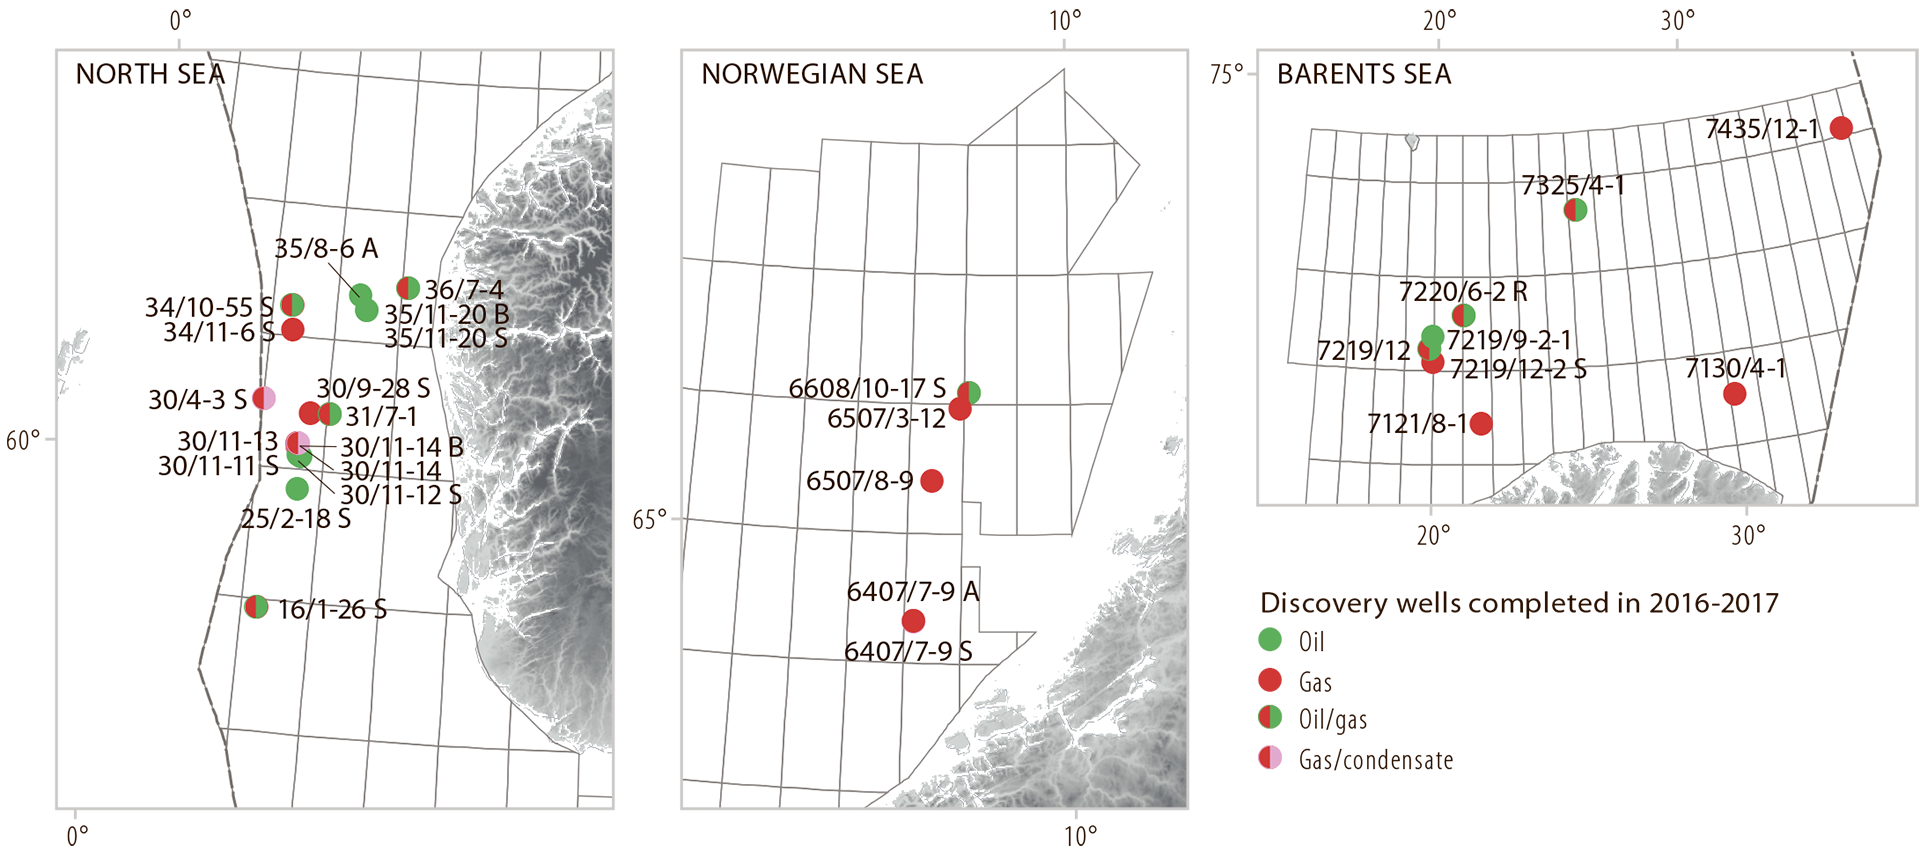
Figure 2.20
Discoveries on the NCS in 2016-17.
Thirty exploration wells were completed in the North Sea during 2016 and 12 in 2017. Twelve were appraisals. Sixteen of the wildcats encountered hydrocarbons. While exploration activity in the Norwegian Sea was low during 2016, with only three wildcats, there was a slight increase in 2017 to five wells (four of them wildcats). Five discoveries were made in 2016-17.
Four exploration wells were drilled in the Barents Sea during 2016 – three wildcats and one appraisal. Activity increased in 2017, when a new exploration record was set with 17 completed wells. Five were appraisals. A total of seven discoveries were made in 2016-17.
Expectations were high for Statoil’s 7435/12-1 (Korpfjell) wildcat, the very first to be spudded in Barents Sea South-East after the area was opened for exploration in 2013. It was drilled on the Haapet Dome, a large structure close to the boundary with the Russian sector. Many had hoped for a big oil discovery, but instead the well encountered small quantities of gas. Although the result was disappointing, it lay within the NPD’s expected uncertainty range. Preliminary estimates put the size of the discovery at eight to 11.5 million scm oe. Although the find is not commercial at present, the well has contributed important new geological knowledge about the area.
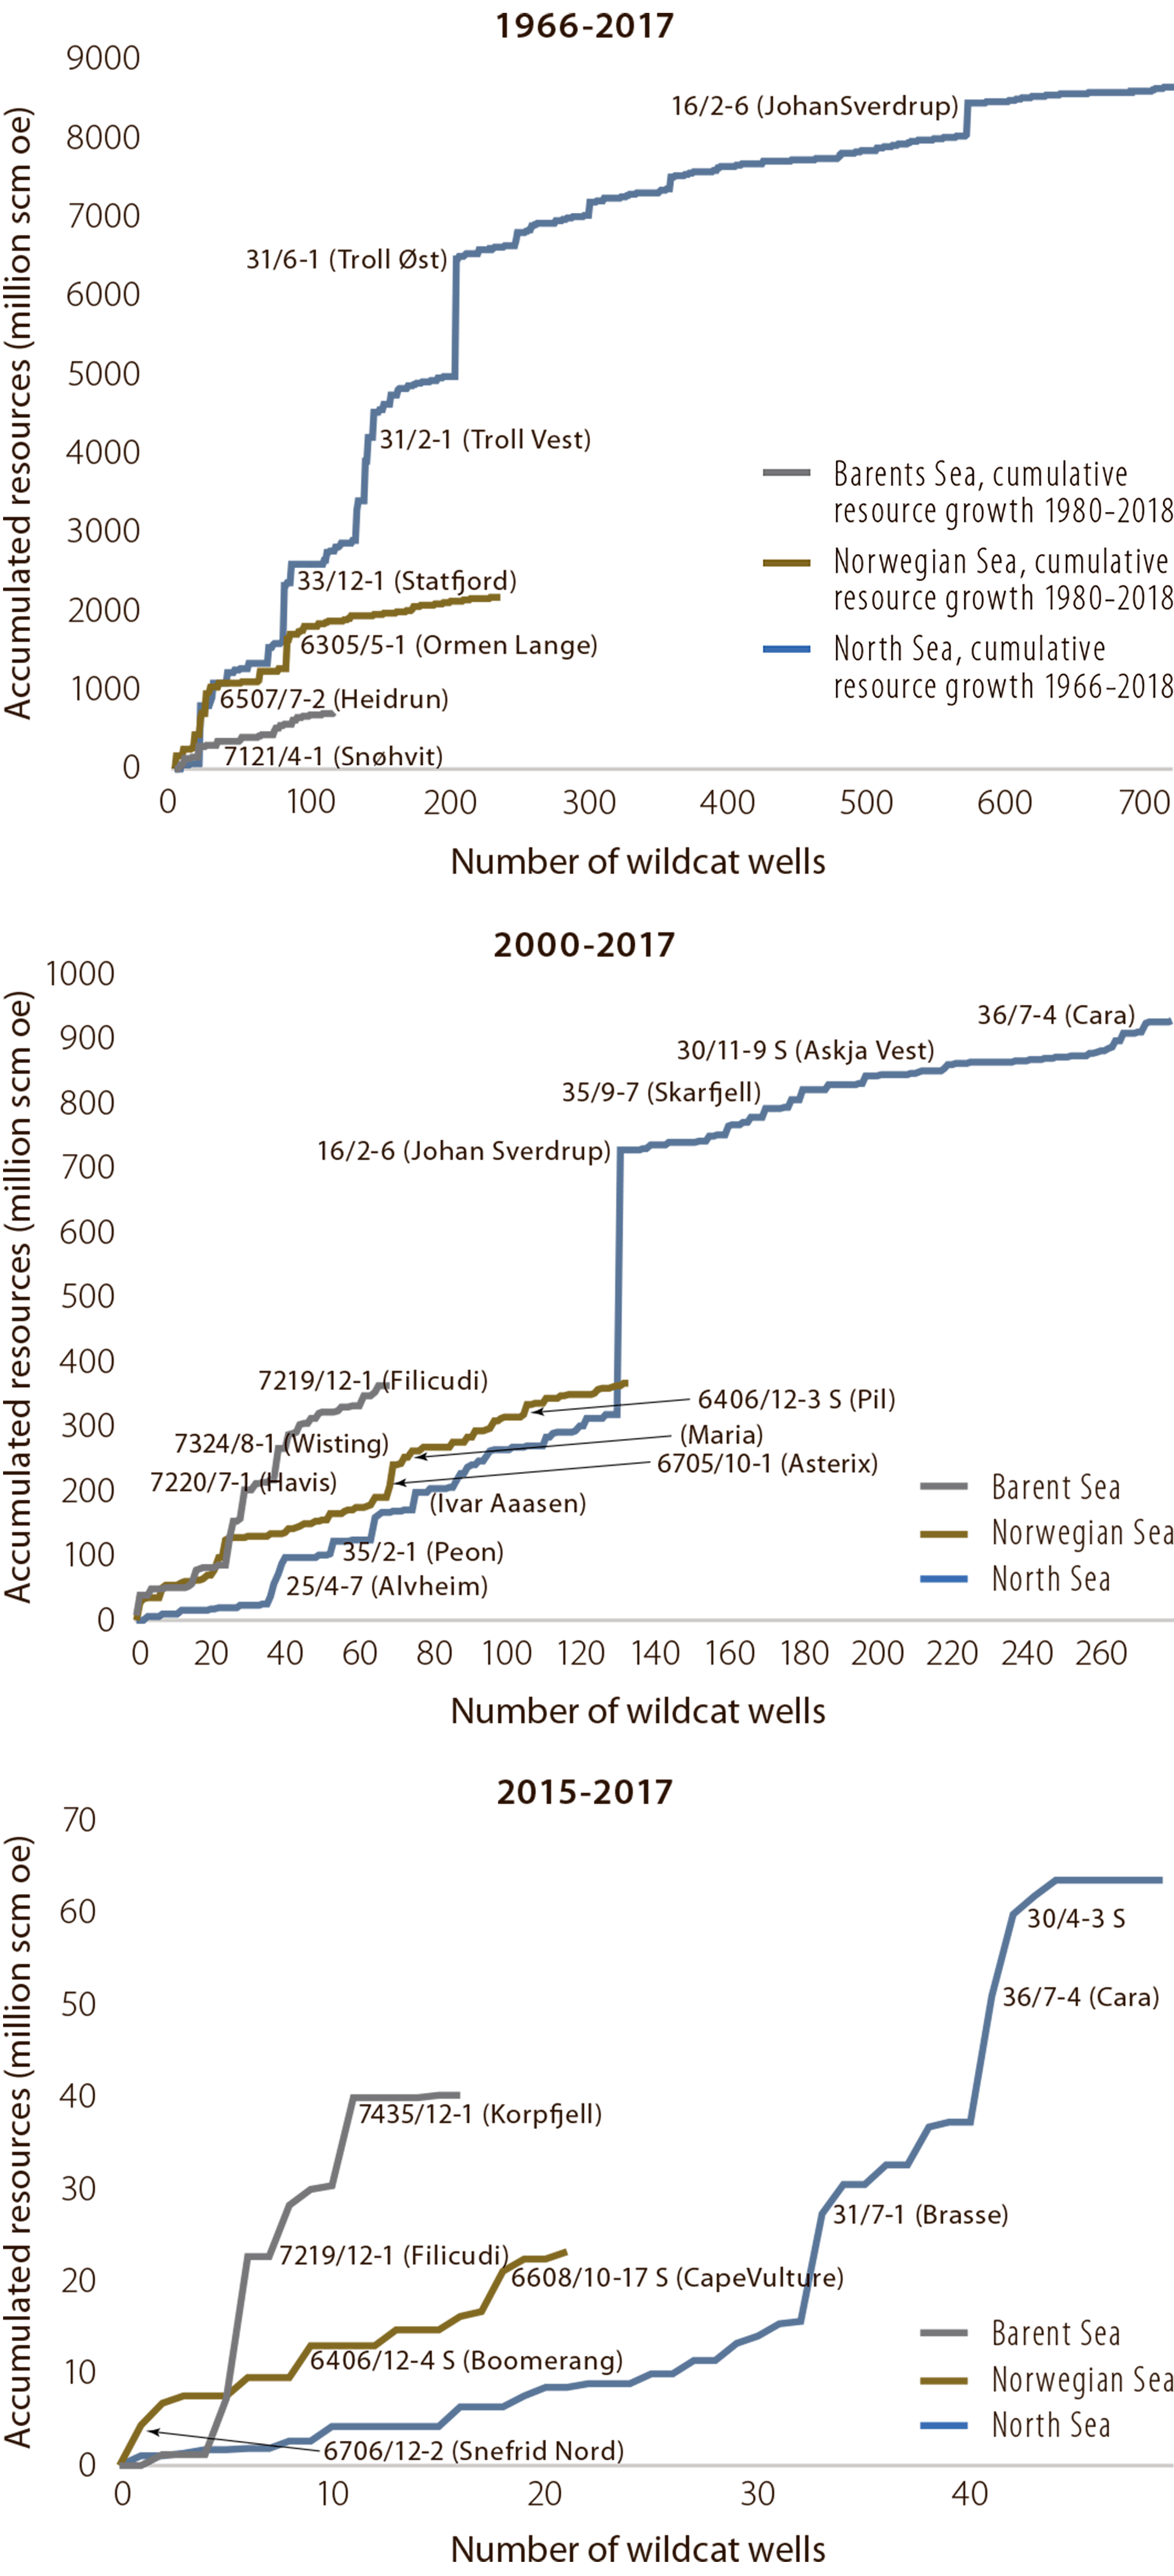
Fact box 2.5: Exploration curves |
|
The exploration curve for 1965-2017 shows that the largest number of wells drilled and the biggest resources found were in the North Sea. The Norwegian and Barents Sea were opened for exploration in 1980. More wells were drilled and resources found in the Norwegian Sea than in the Barents Sea. In 2000-17, the largest number of wells drilled and the biggest resources were again found in the North Sea. Resource growth was about the same in the Norwegian and Barents Seas, but with almost twice as many wells drilled in the former area as in the latter. The largest number of wells and the highest resource growth in 2015-17 were in the North Sea. Resource growth in the Barents Sea was roughly 60 per cent of the level in the North Sea, but fewer wildcats were drilled there. The Norwegian Sea accounted for the smallest resource growth, even though a few more wells were drilled there than in the Barents Sea. The horizontal axes show the number of wildcats in the order they were drilled. When a new discovery is made, the resources involved are represented as accumulated values along the vertical axis. A steep curve shows that a lot of resources were found with relatively few wells, while a shallow curve indicates that proven discoveries were small. |