Exploration look-back analyses
Exploration is a learning process.
The oil industry is known to overestimate the volume in prospects and understate the probability of success. This has been confirmed by the NPD’s analyses. The sector has long been working to achieve more accurate estimates. Miscalculations can undermine exploration decisions, and thereby reduce value creation for society. To an even greater extent than before, the industry should collaborate on methods and share experience.
A good factual and knowledge base is a prerequisite if the government is to play a decisive role in resource management on the Norwegian continental shelf (NCS). Given its unique databases, the NPD considers that part of its task involves preparing integrated exploration look-back analyses which can help enhance the efficiency of these activities. Experience from the NCS so far is that lessons from history can contribute to better assessments and estimates, and thereby to improved decisions. A good grasp of the factors which govern company decisions forms part of this knowledge base.
In its 1997 resource report, the NPD presented an analysis which compared company assessments of discovery size and the probability of success for mapped prospects with post-drilling discovery sizes and success rates. Not unexpectedly, this analysis found that the industry overestimated resource expectations and understated the probability of success. These results were in line with studies based on data from beyond the NCS.
Understating the probability of success and overestimating discovery size mean that exploration portfolios at the companies deliver below expectations. That could result in incorrect assessments and exploration decisions, leading to lower-than-desirable value creation for society.
A number of factors can cause errors in such estimates. Called biases in the literature and usually divided between cognitive or motivational,13 these are well-known in the sector (see chapter 6).
13 See, for example, Tversky, A and Kahneman, D (1981): “The framing of decisions and the psychology of choice”, Science, vol 211, pp 453-458; Rose, Peter R (2001): “Risk Analysis and Management of Petroleum Exploration Ventures”, A APG, Methods in Exploration series, no 12; Milkov, A V (2015): “Risk tables for less biased and more consistent estimation of probability of geological success (PoS) for segments with conventional oil and gas prospective resources”, Earth-Science Reviews, vol 150, pp 453-476.
The industry has long worked purposefully to avoid biases in its decision basis, but a number of analyses show that an improvement potential still exists. That finding is underlined by the NPD analyses presented in this chapter.
ESTIMATING DISCOVERY SIZE
COMPARING PRE-AWARD PROGNOSES WITH POST-DRILLING RESULTS
When oil companies apply for new licence awards, their application must document the resource potential in the blocks sought and provide resource estimates for mapped prospects.
Results for eighth to 14th rounds
A study comparing expected values from companies for mapped prospects in the eighth to 14th licensing rounds with discovery size was presented in the NPD’s 1997 resource report. This analysis showed that resource expectations were overstated by an average factor of 2.2 (figure 7.1).
Prospect estimates are usually given as a distribution. Even when this was taken into account, discovery size fell within the specified range in only two of 10 cases.

Figure 7.1
Expected values from companies before award compared with (expected) discovery size (eighth-14th rounds). Vertical red lines link differences in estimates from various companies for the same discovery. Some finds have an estimate from only one company.
Source: NPD resource report 1997.
Results 16th-22nd rounds and APA 2003-2011
The industry has long worked on processes which can help correct overestimates. Against that background, the NPD conducted an analysis of discoveries in acreage licensed through the awards in predefined areas (APA) from 2003 to 2011, and through the 16th-22nd numbered rounds (figure 7.2). This analysis was presented by the NPD at the NCS Exploration 2016 – Recent Discoveries conference in May 2016. Comparing the expected value given by the companies for mapped prospects with post-drilling estimates, it again showed that discovery size was overestimated.
COMPARING PRE-DRILLING PROGNOSES WITH POST-DRILLING RESULTS
Results 1990-1997
A shortcoming in the analysis of company resource estimates in licensing-round applications is that these can be influenced by strategic considerations, which add an extra bias. To take account of this possibility, the NPD initiated an industry project in 1997 on Evaluation of Norwegian Wildcat Wells. One aim was to look at resource size before and after drilling.14
14 Ofstad, K, Kittilsen, J E a nd Alexander-Marrack, P (2000): Improving the Exploration Process by Learning from the Past, Norwegian Petroleum Society, special publication no 9.
The analysis showed that the companies overestimated both oil and gas resources before drilling by an average factor of 2.5 (figure 7.3). The overestimate was largest for oil prospects.

Figure 7.3
Pre-drilling resource estimates from the companies compared with actual discovery size (195 wildcats drilled in 1990-97).
Source: Ofstad, Kullerud and Helliksen (2000).15
15 Ofstad, K, Kullerud, L and Helliksen, D (2000): Evaluation of Norwegian Wildcat Wells (Article 1), in Ofstad et al (2000).
Results 1998-2007
With effect from 1998, operators report prognosed resource estimates and results six months after drilling a wildcat. The estimates provided represent the views of the operators at that time. Figures reported show a distribution with a high estimate (P10), expected value (mean) and low estimate (P90).
The NPD conducted a study in 2008 of pre- and post-drilling results for reported prospects drilled in 1998-2007. A majority of these prospects were based on three-dimensional (3D) seismic data. The analysis was presented at the 33rd International Geological Congress (33IGC) in Oslo during August 2008 (Prognoses and results of wildcat wells drilled between 1998 and 2007 on the Norwegian continental shelf), and subsequently in the 2011 resource report.
Once again, the companies turned out to overstate their resource estimates by a factor of 2.5.
Results 2007-2016
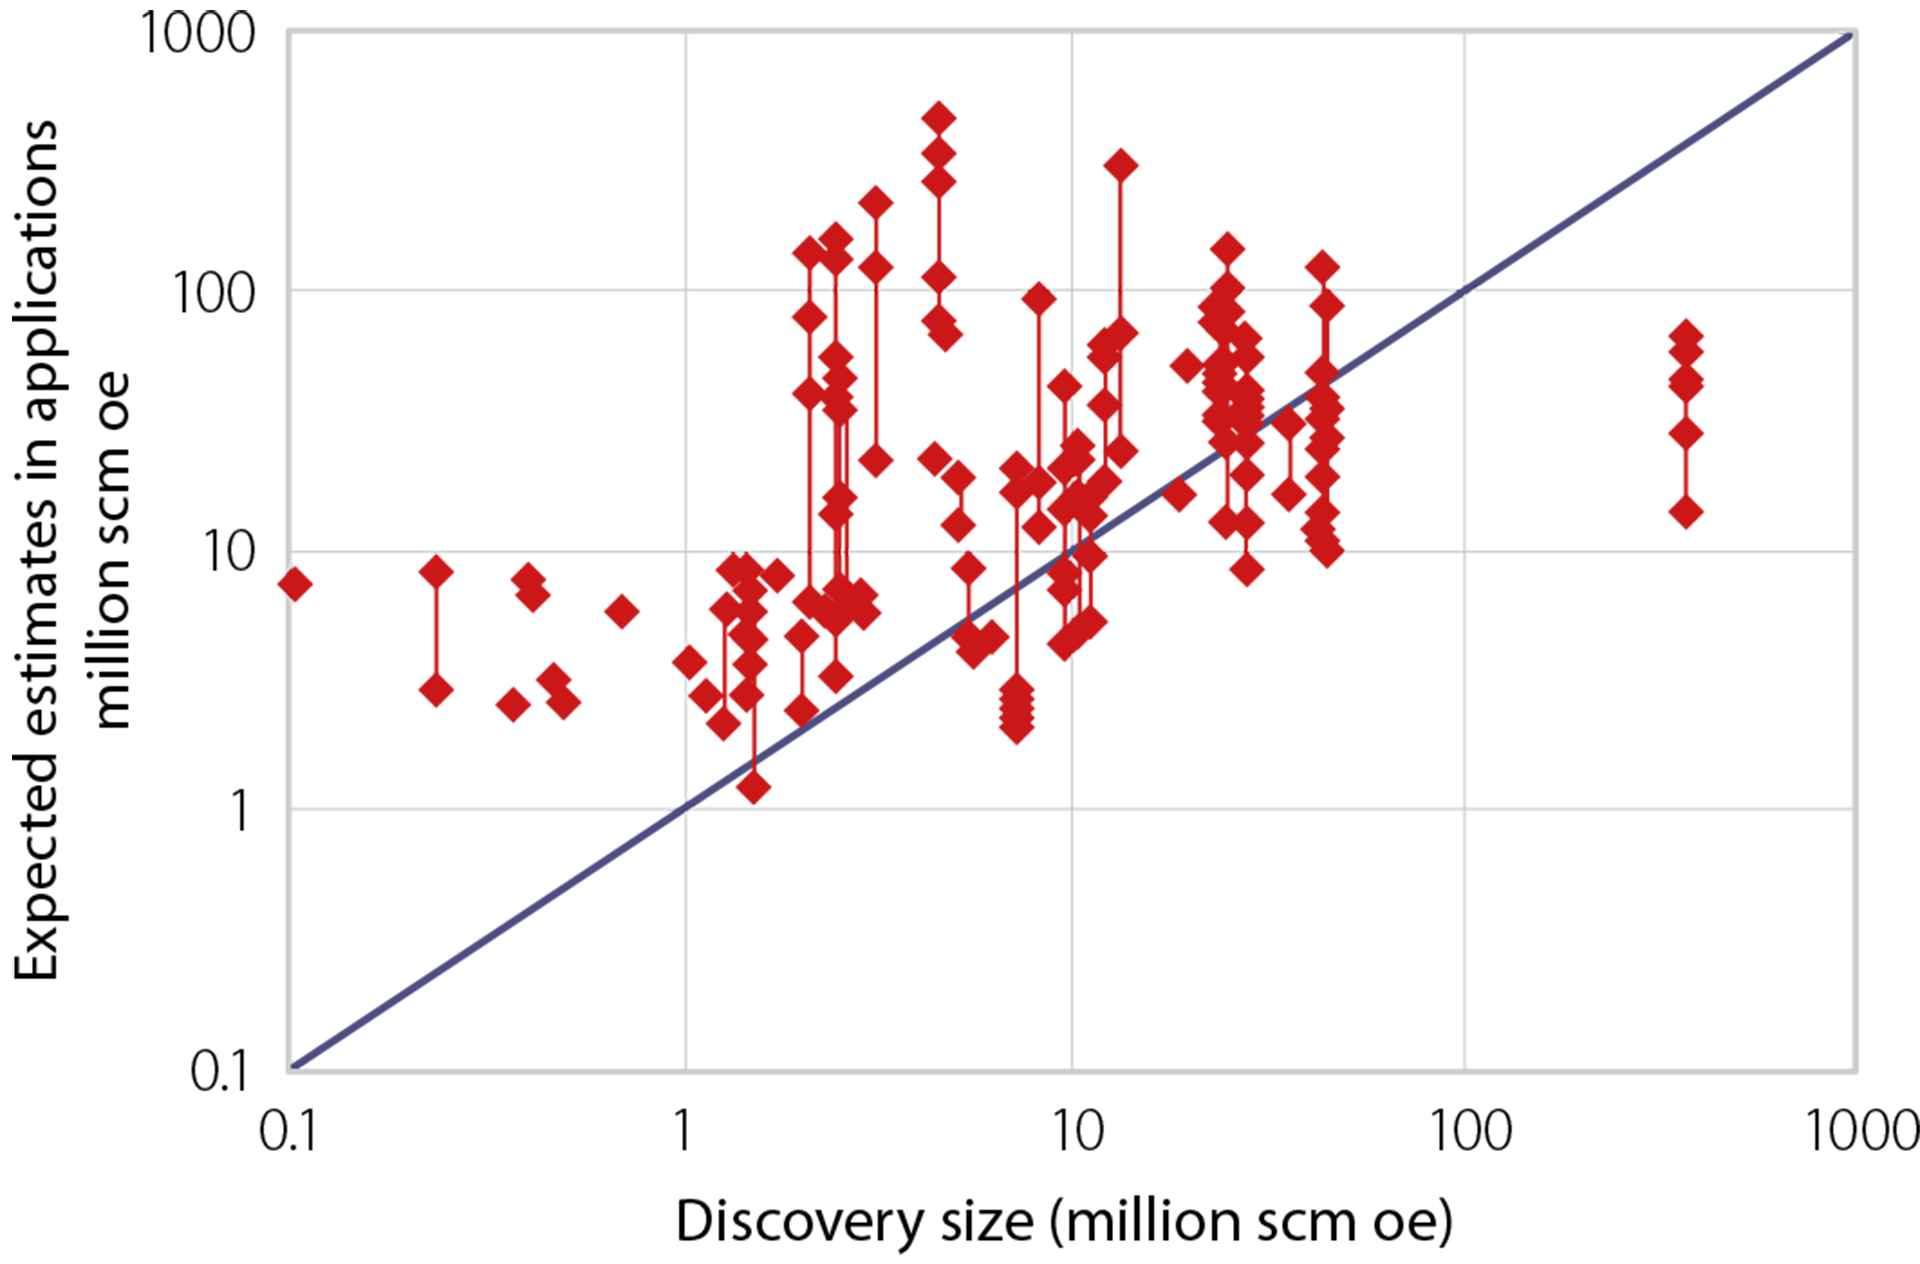
The NPD carried out a new analysis of pre- and postdrilling results in 2016-17, based on data reported for 2007-16. This work was presented by the NPD to a Force seminar – the Frontier Exploration Workshop – in Stavanger during June 2017.
Results from the study are illustrated in figures 7.4 and 7.5, They show oil volume in place for oil discoveries compared with prognoses (figure 7.4) and gas volume for gas discoveries compared with prognoses (figure 7.5).

Figure 7.4
Company pre-drilling resource estimates for oil in place, compared with post-drilling discovery size. The green area shows the P10-P90 range. The squares are the expected discovery size pre-drilling, while the triangles represent the estimated discovery size post-drilling.

Figure 7.5
Company pre-drilling estimates for gas, compared with post-drilling discovery size. The red area shows the P10-P90 range. The squares are the expected discovery size pre-drilling, while the triangles represent the estimated discovery size post-drilling.
Drilling targets with oil as the main phase are entered as oil discoveries, and correspondingly for gas. The associated phase is not included. It is also important to note that the study does not address wells but drilling targets. Each column represents a target which yielded a discovery. Earlier NPD studies were based on resource estimates per well. Since a well may have several targets, this study cannot be directly compared with the earlier analyses.
Discoveries with insufficient reporting or which were described as a “surprise find”, and thereby lacked a prognosis, are not included in the study.
The analysis shows that about 58 per cent of oil discoveries fell within the uncertainty range in the prognosed estimate. About six per cent were above and 36 per cent below this range. The companies overestimated resource expectations by an average factor of 1.4.
Where gas is concerned, roughly 47 per cent of finds were within, 16 per cent above and 37 per cent below the uncertainty range. The companies overestimated resource expectations by an average factor of 2.1. As with earlier studies, the results indicate a clear tendency to overestimate in prognoses.
ANALYSIS OF DRY WILDCATS
The NPD’s analyses reveal a tendency to overestimate discovery size and underestimate the probability of success. These results are in line with industry analyses based on company data (Milkov, 201716).
16 Milkov, A V (2017): "Integrate instead of ignoring: Base rate neglect as a common fallacy of petroleum explorers", AAPG Bulletin 101 (12): 1905-1916.
Dry-well analysis can help to improve estimates by companies. Most of them base such studies on their own data. The NPD also regularly carries out analyses of this kind based on reported company information. Its studies cover all wells on the NCS, and provide useful knowledge which could help to boost exploration success. The NPD’s latest dry-well analysis was conducted in 2017.
Covering wells drilled in 2007-16, this study was presented by the NPD for the first time at the Exploration Revived 2017 conference.
DATABASE FOR THE ANALYSIS
Pursuant to section 24 of the resource regulations, operators must specify prognoses for and results of wildcats when submitting their final report six months after such wells have been drilled. Reporting uses a standard form developed by the oil companies and the NPD in the 1997 project on Norwegian wildcats mentioned above.
Limited specification of the reported trap type for many of the targets meant this analysis could only distinguish between structural and stratigraphic types. Such factors as total success rate and the most frequently tested stratigraphic reservoir levels were also investigated.
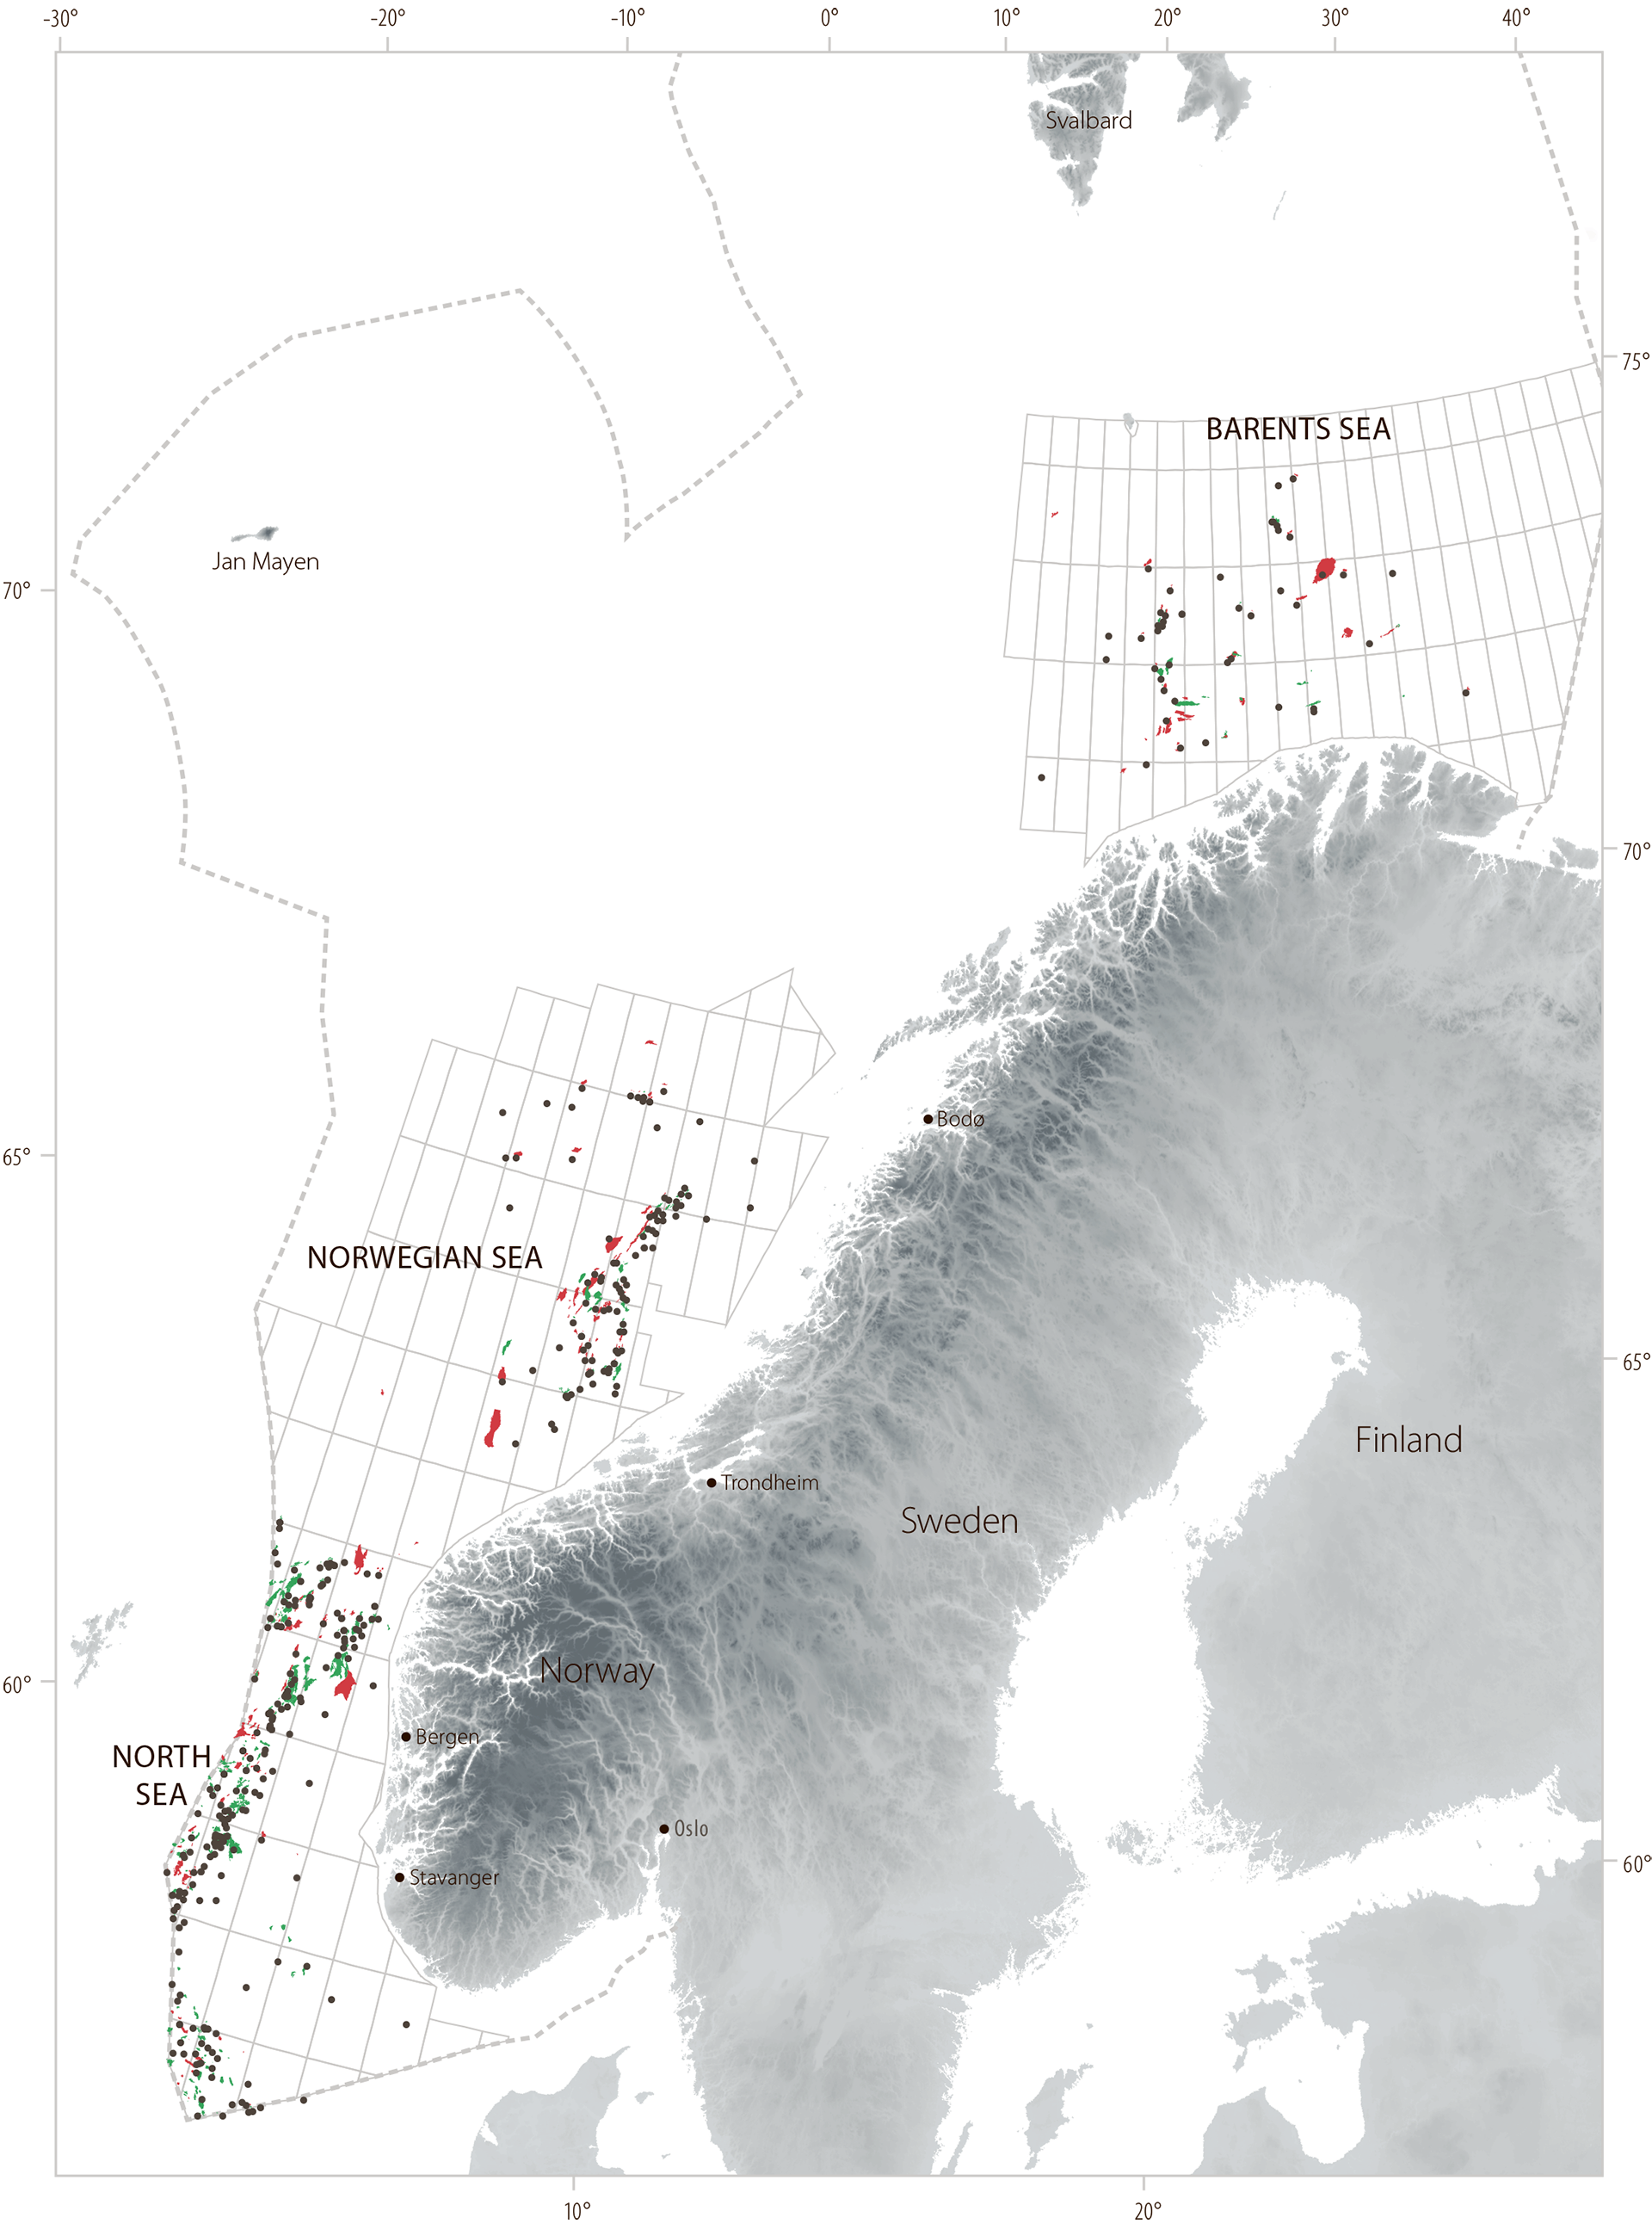
The database varies between the sea areas because of differences in the number of wells drilled. One well can have several targets, and a target can be dry for more than one reason. The North Sea accounts for around 200 targets in the database, the Norwegian Sea about 100 and the Barents Sea roughly 70 (figure 7.6).

Figure 7.6
Wells from 2007-16 included in the analysis.
TRAP TYPE
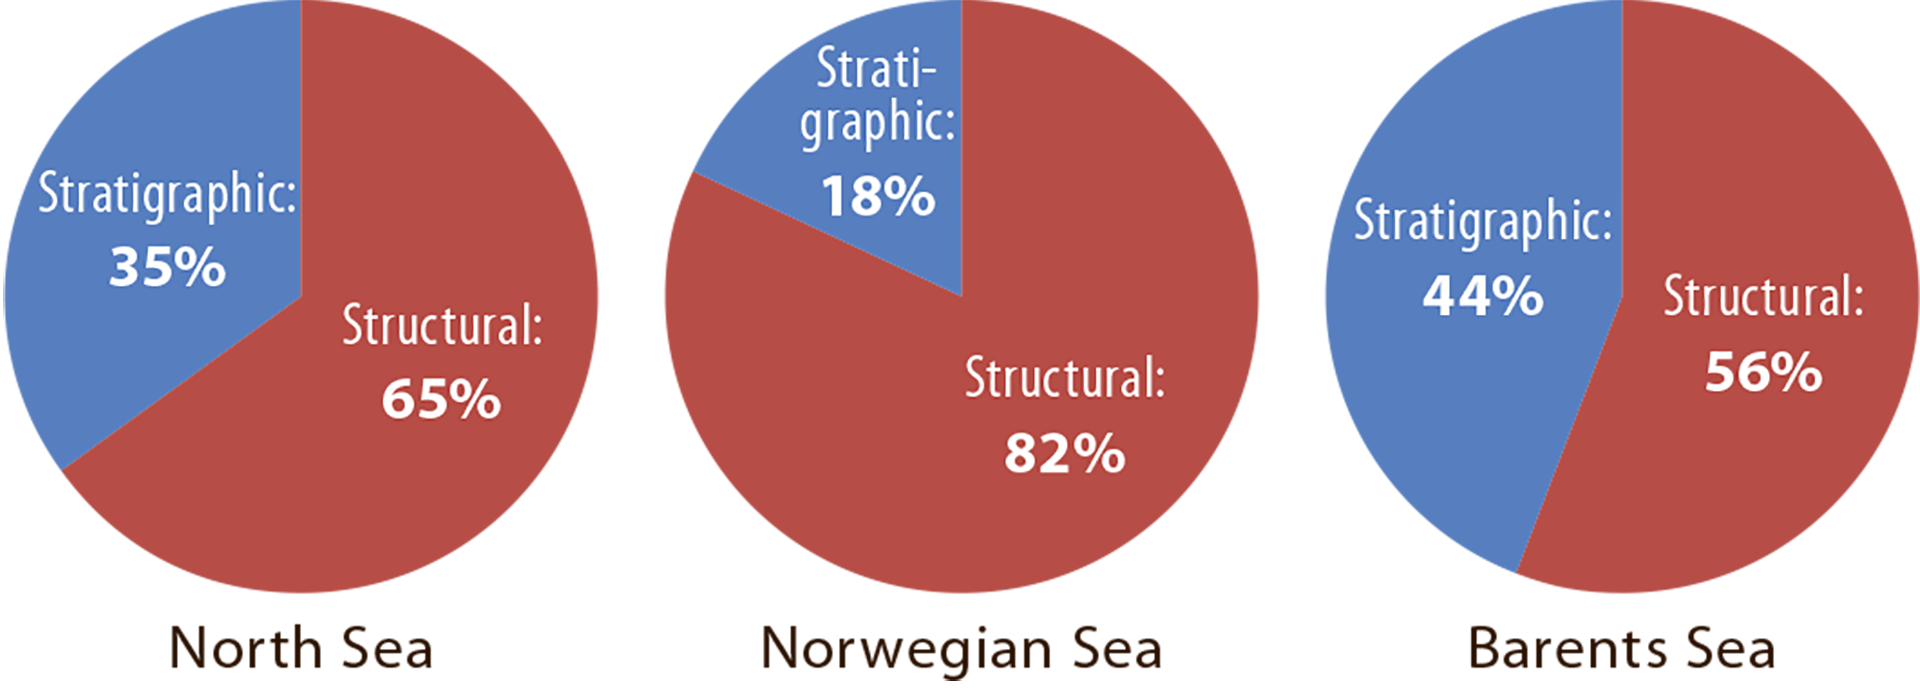
The study reveals big variations between the various areas with regard to the frequency of testing the different trap types – structural or stratigraphic (figure 7.7). It shows that most targets lay in structural traps – 65 per cent in the North Sea and 82 per cent in the Norwegian Sea. The difference between how often the two trap types were tested was smaller in the Barents Sea. Fifty-six per cent of targets there tested structural types.

Figure 7.7
Relationship between exploration targets in structural as against stratigraphic traps in the various areas.
STRATIGRAPHIC LEVELS TESTED
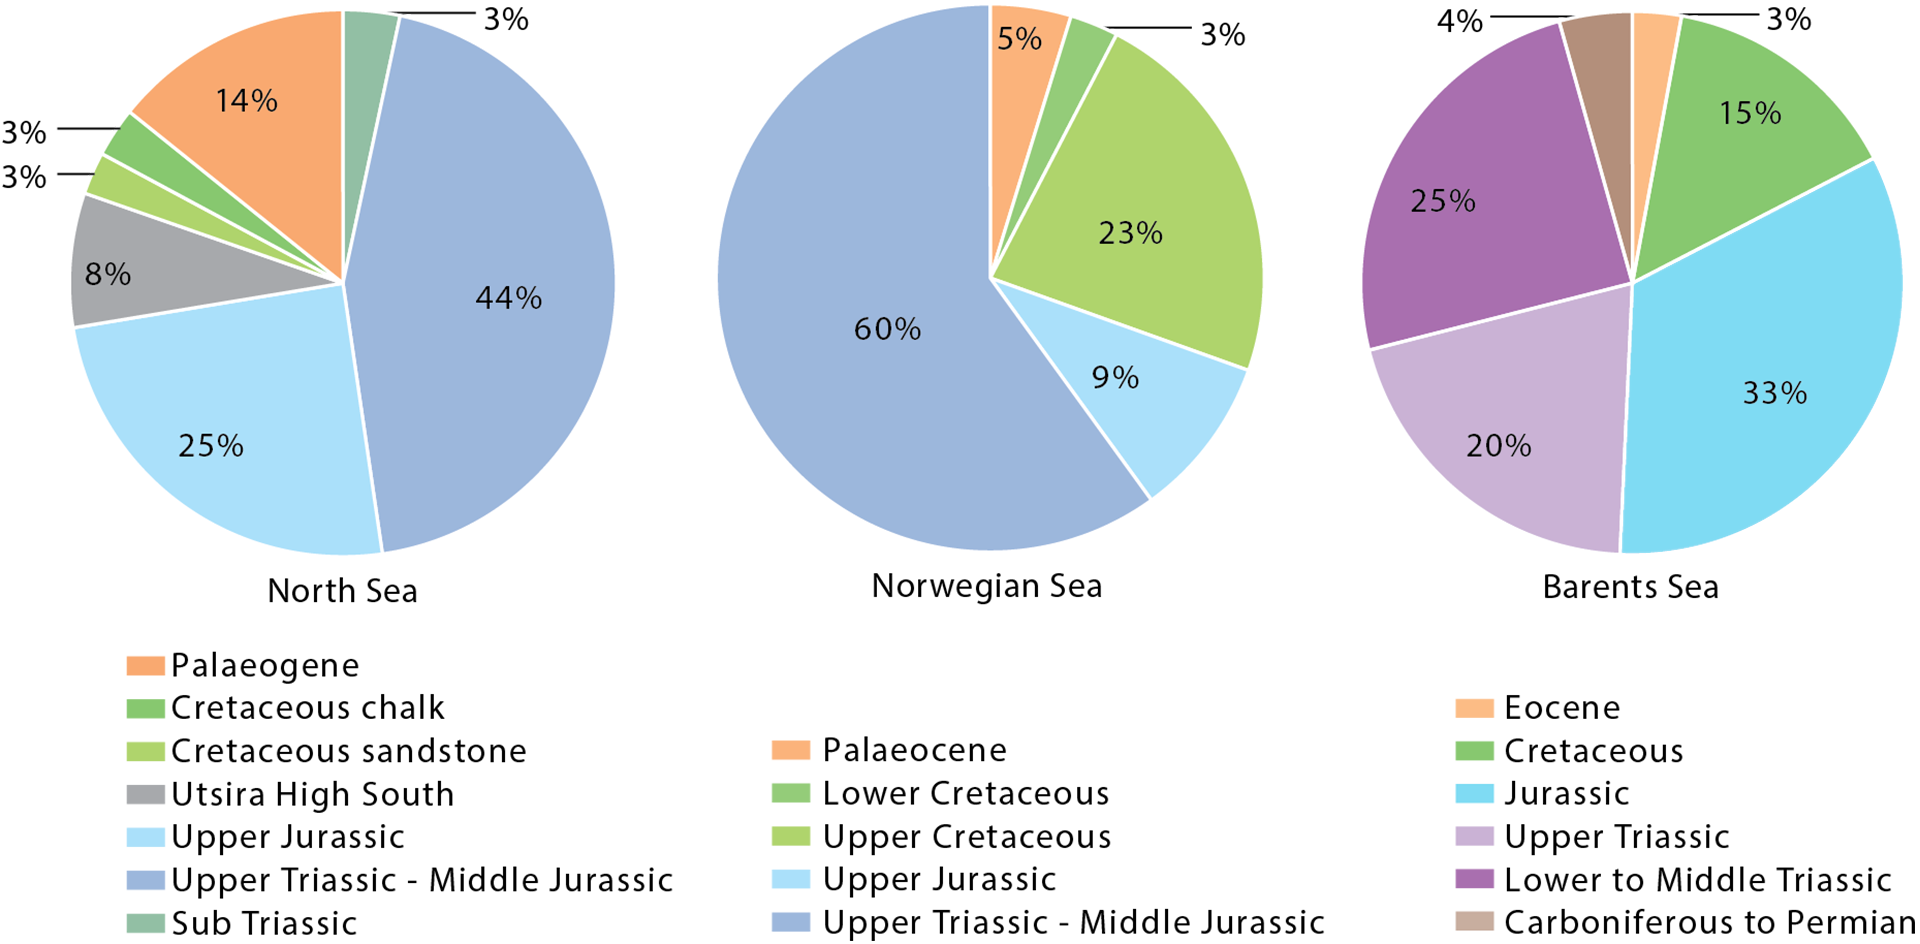
The analysis also reveals clear geographical differences between the stratigraphic levels explored, which reflects the unique geological histories of each sea area.
North Sea results (figure 7.8) show that Late Triassic to Middle Jurassic reservoirs were the most frequently tested (44 per cent of targets). Late Jurassic reservoirs were tested in one of four targets (25 per cent), while both Cretaceous and Sub Triassic were tested relatively infrequently (three per cent).
In the Norwegian Sea, 60 per cent of targets were in Late Triassic to Middle Jurassic reservoirs (figure 7.8), followed by Late Cretaceous (23 per cent) and Late Jurassic (nine per cent). Only eight per cent lay in Early Cretaceous and Palaeocene reservoir rocks.
The picture in the Barents Sea is very different (figure 7.8). Triassic reservoirs were tested in almost every other target (45 per cent), followed by 33 per cent in Jurassic rocks.

Figure 7.8
Proportion of stratigraphic levels explored in the North, Norwegian and Barents Seas during 2007-16.
REASONS FOR DRY TARGETS
The main reasons for dry wells relate to one or more of the following factors:
- reservoir absence
- reservoir quality
- absence of sufficient volume/mature source rock
- lack of oil/gas migration into prospect/target
- absence of effective trap
A limited level of detailing in the reported data meant that the following four main factors were assessed, but a dry target often results from the combination of several of these:
- reservoir absence
- reservoir quality
- source and migration
- trap
In the North Sea, the NPD’s analysis shows that the lack of source and/or migration is the main reason why 46 per cent of targets explored were dry (figure 7.9). In most of these cases, the main reason given is failure of migration from source to target. Failed traps are cited as the principle cause in 28 per cent of cases, with reservoir absence accounting for 16 per cent and inadequate reservoir quality for 10 per cent.
Where the Norwegian Sea is concerned, 38 per cent of dry targets are primarily attributed to failed traps, 35 per cent to source and migration, and 12 and 15 per cent to reservoir absence and poor quality respectively (figure 7.9).
In the Barents Sea, failed traps are the commonest reason given for dry targets, followed by reservoir absence for 27 per cent and source/migration for 20 per cent. Inadequate reservoir quality is cited in 12 per cent of cases.
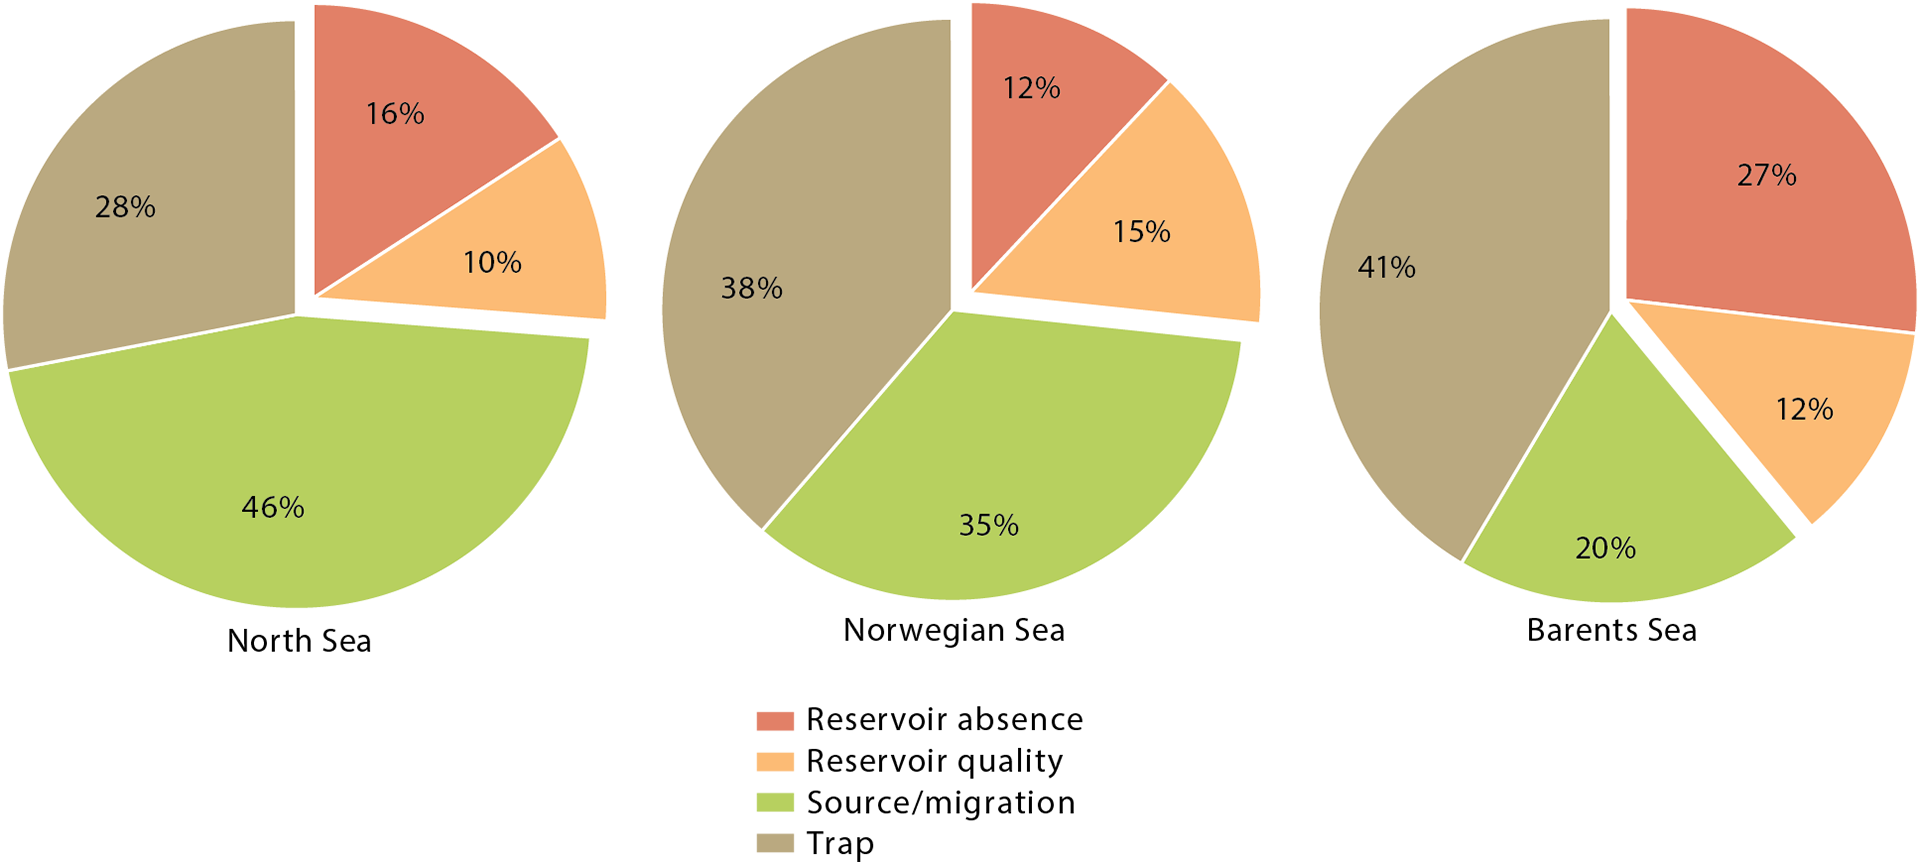
Figure 7.9
Main reasons reported for dry targets in the North, Norwegian and Barents Seas in percentages.
FACT BOX 7.1:
|
|
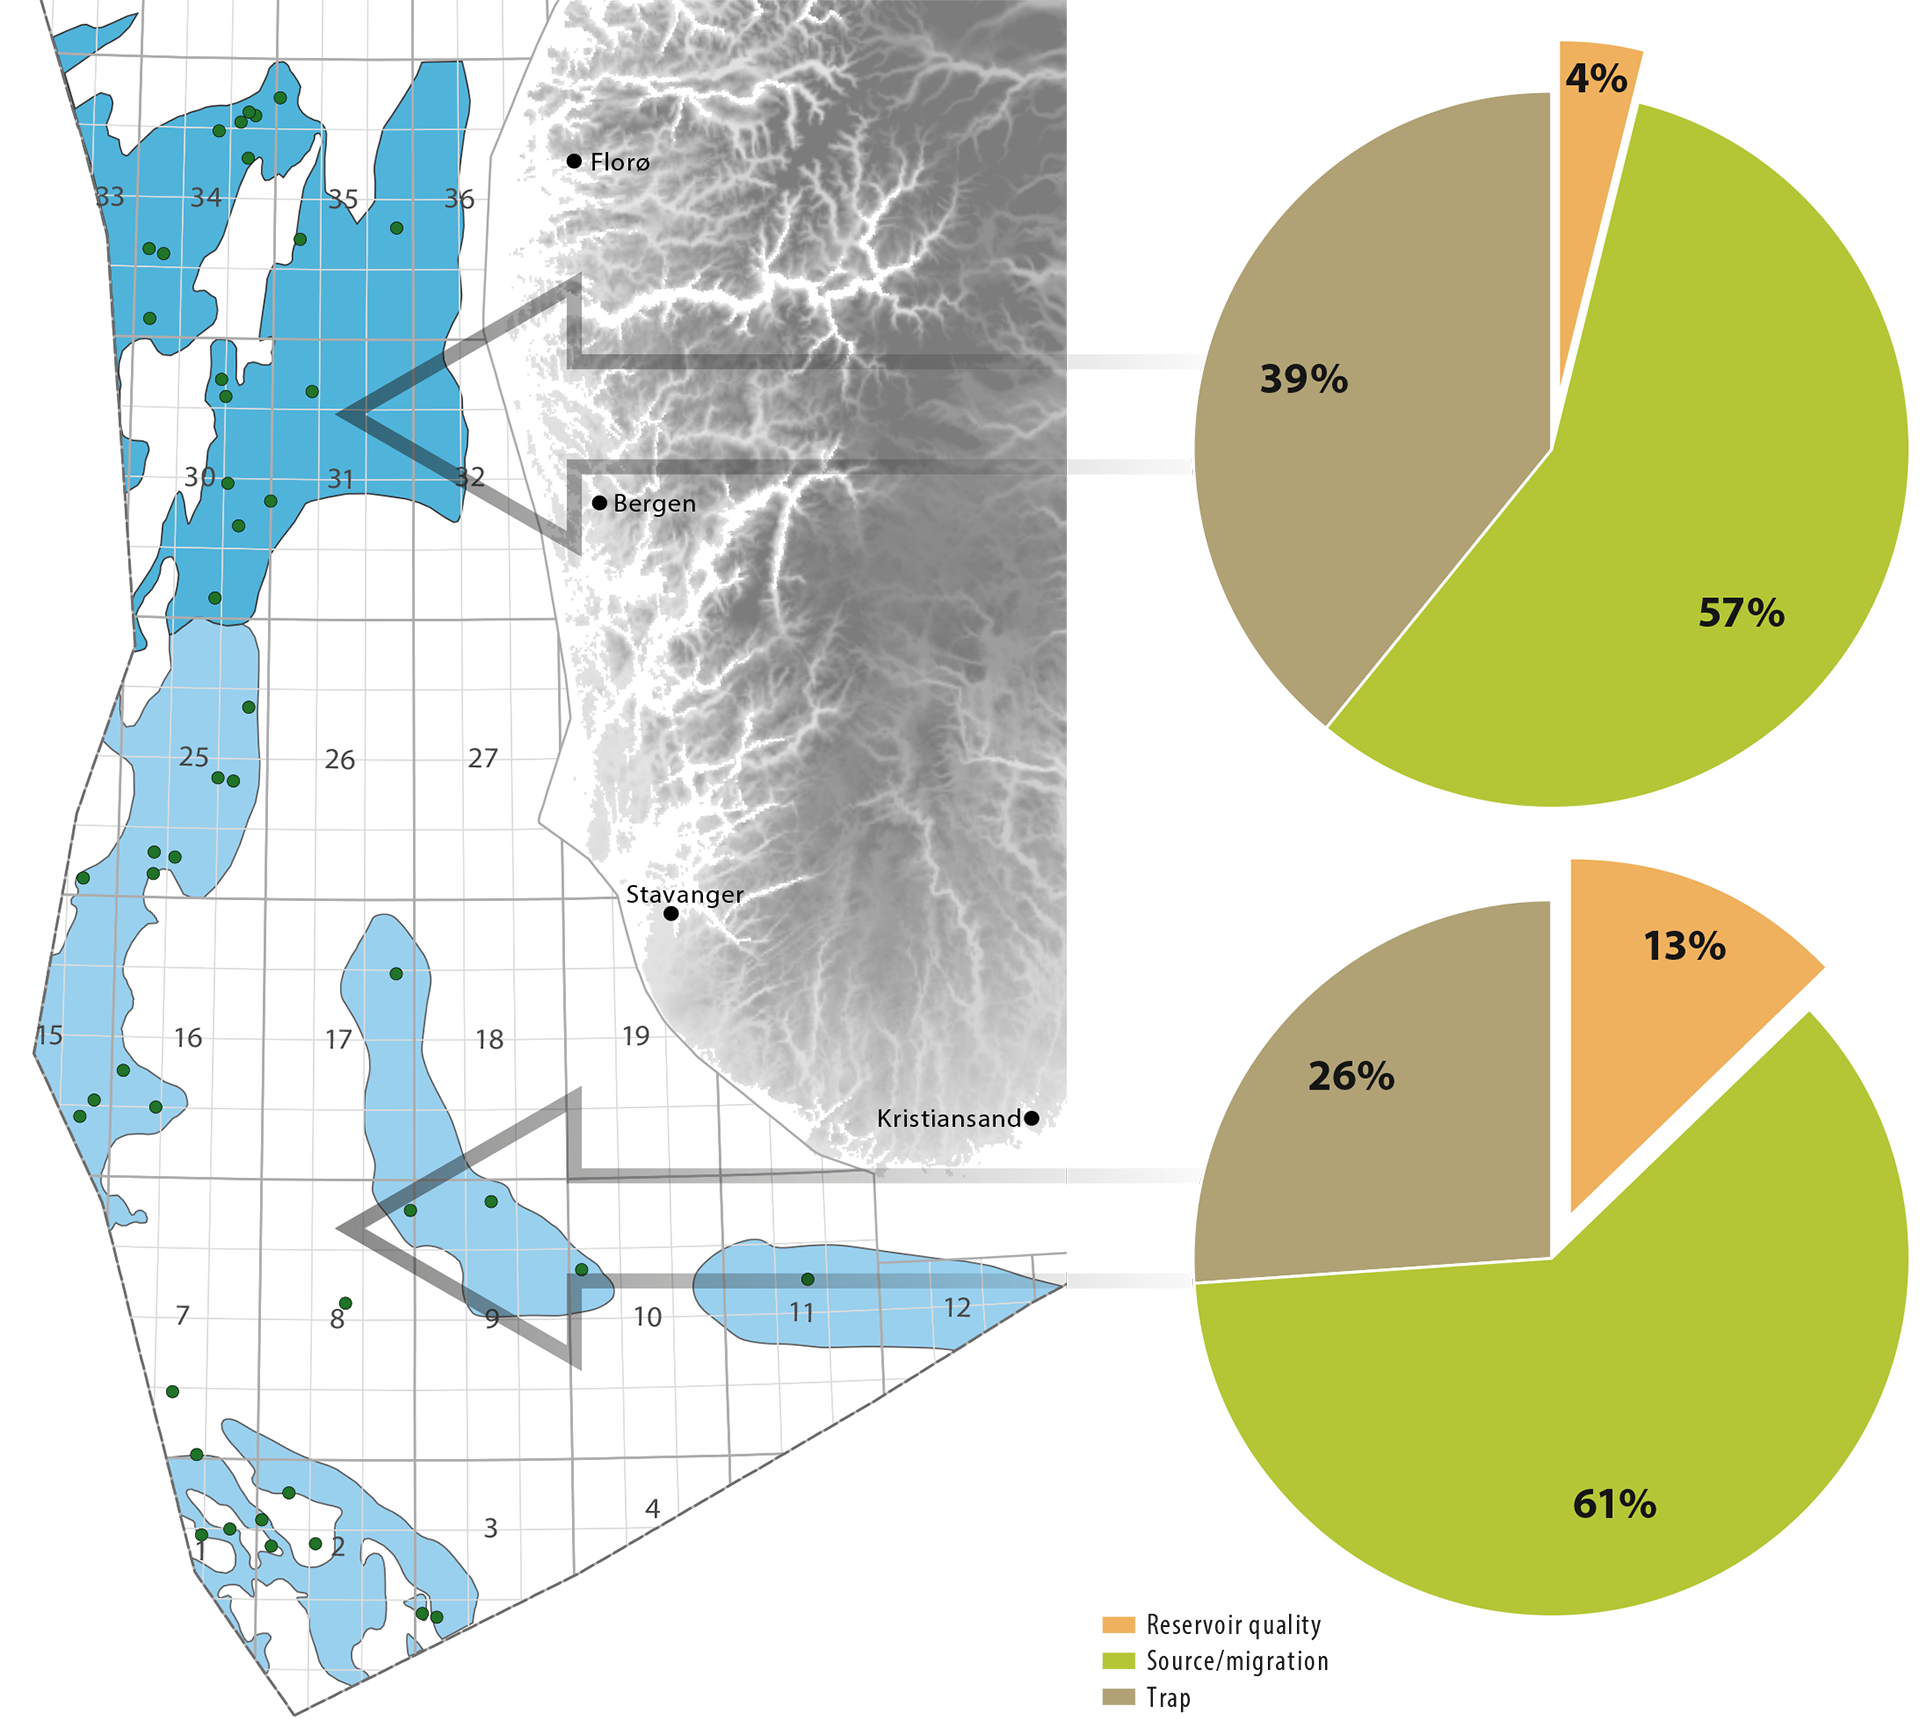
Where plays with Late Triassic and Middle Jurassic reservoirs are concerned, findings accord with the general trend in the North Sea (figure 7.10). The plays studied have been well explored and include fields such as Statfjord, Sleipner Vest and Yme. Nobody has reported absent reservoirs as a reason for dry targets in any of these plays. The analysis included 18 targets in the northernmost play and 28 in the southern plays. It is important to emphasise that these analyses are based only on company reports six months after well completion. A dry target usually results from a combination of several factors, and the cause can be difficult to determine with complete certainty.
Figure 7.10.
|
FACT BOX 7.2:
|
|
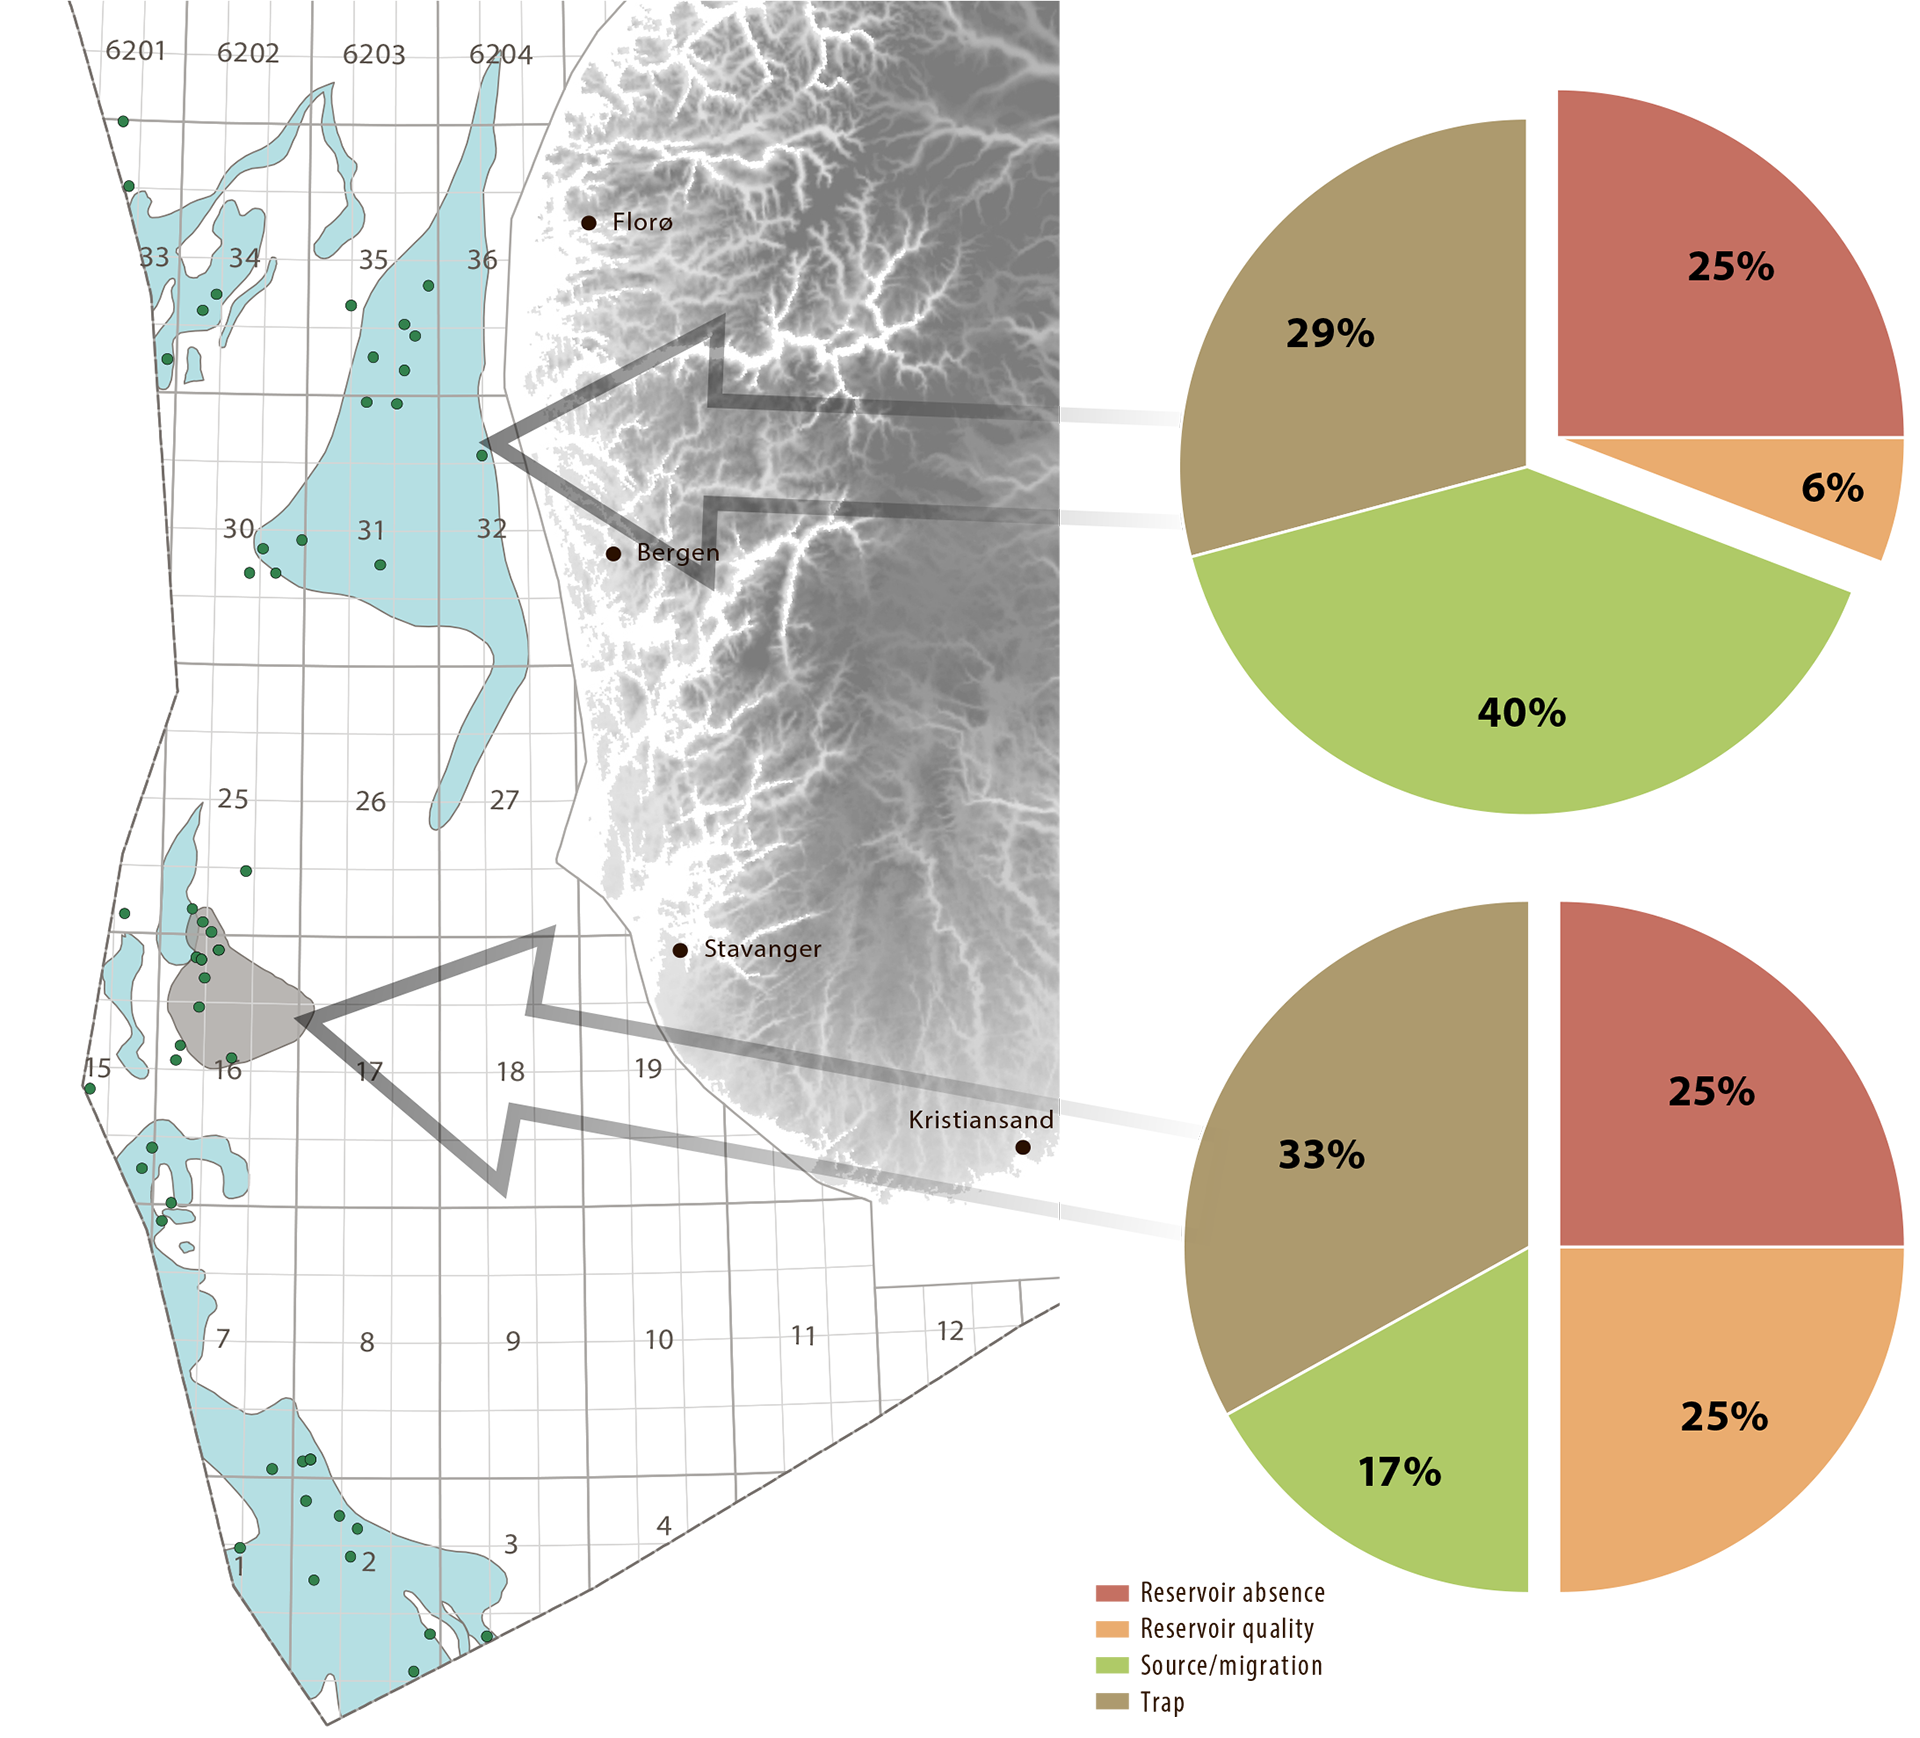
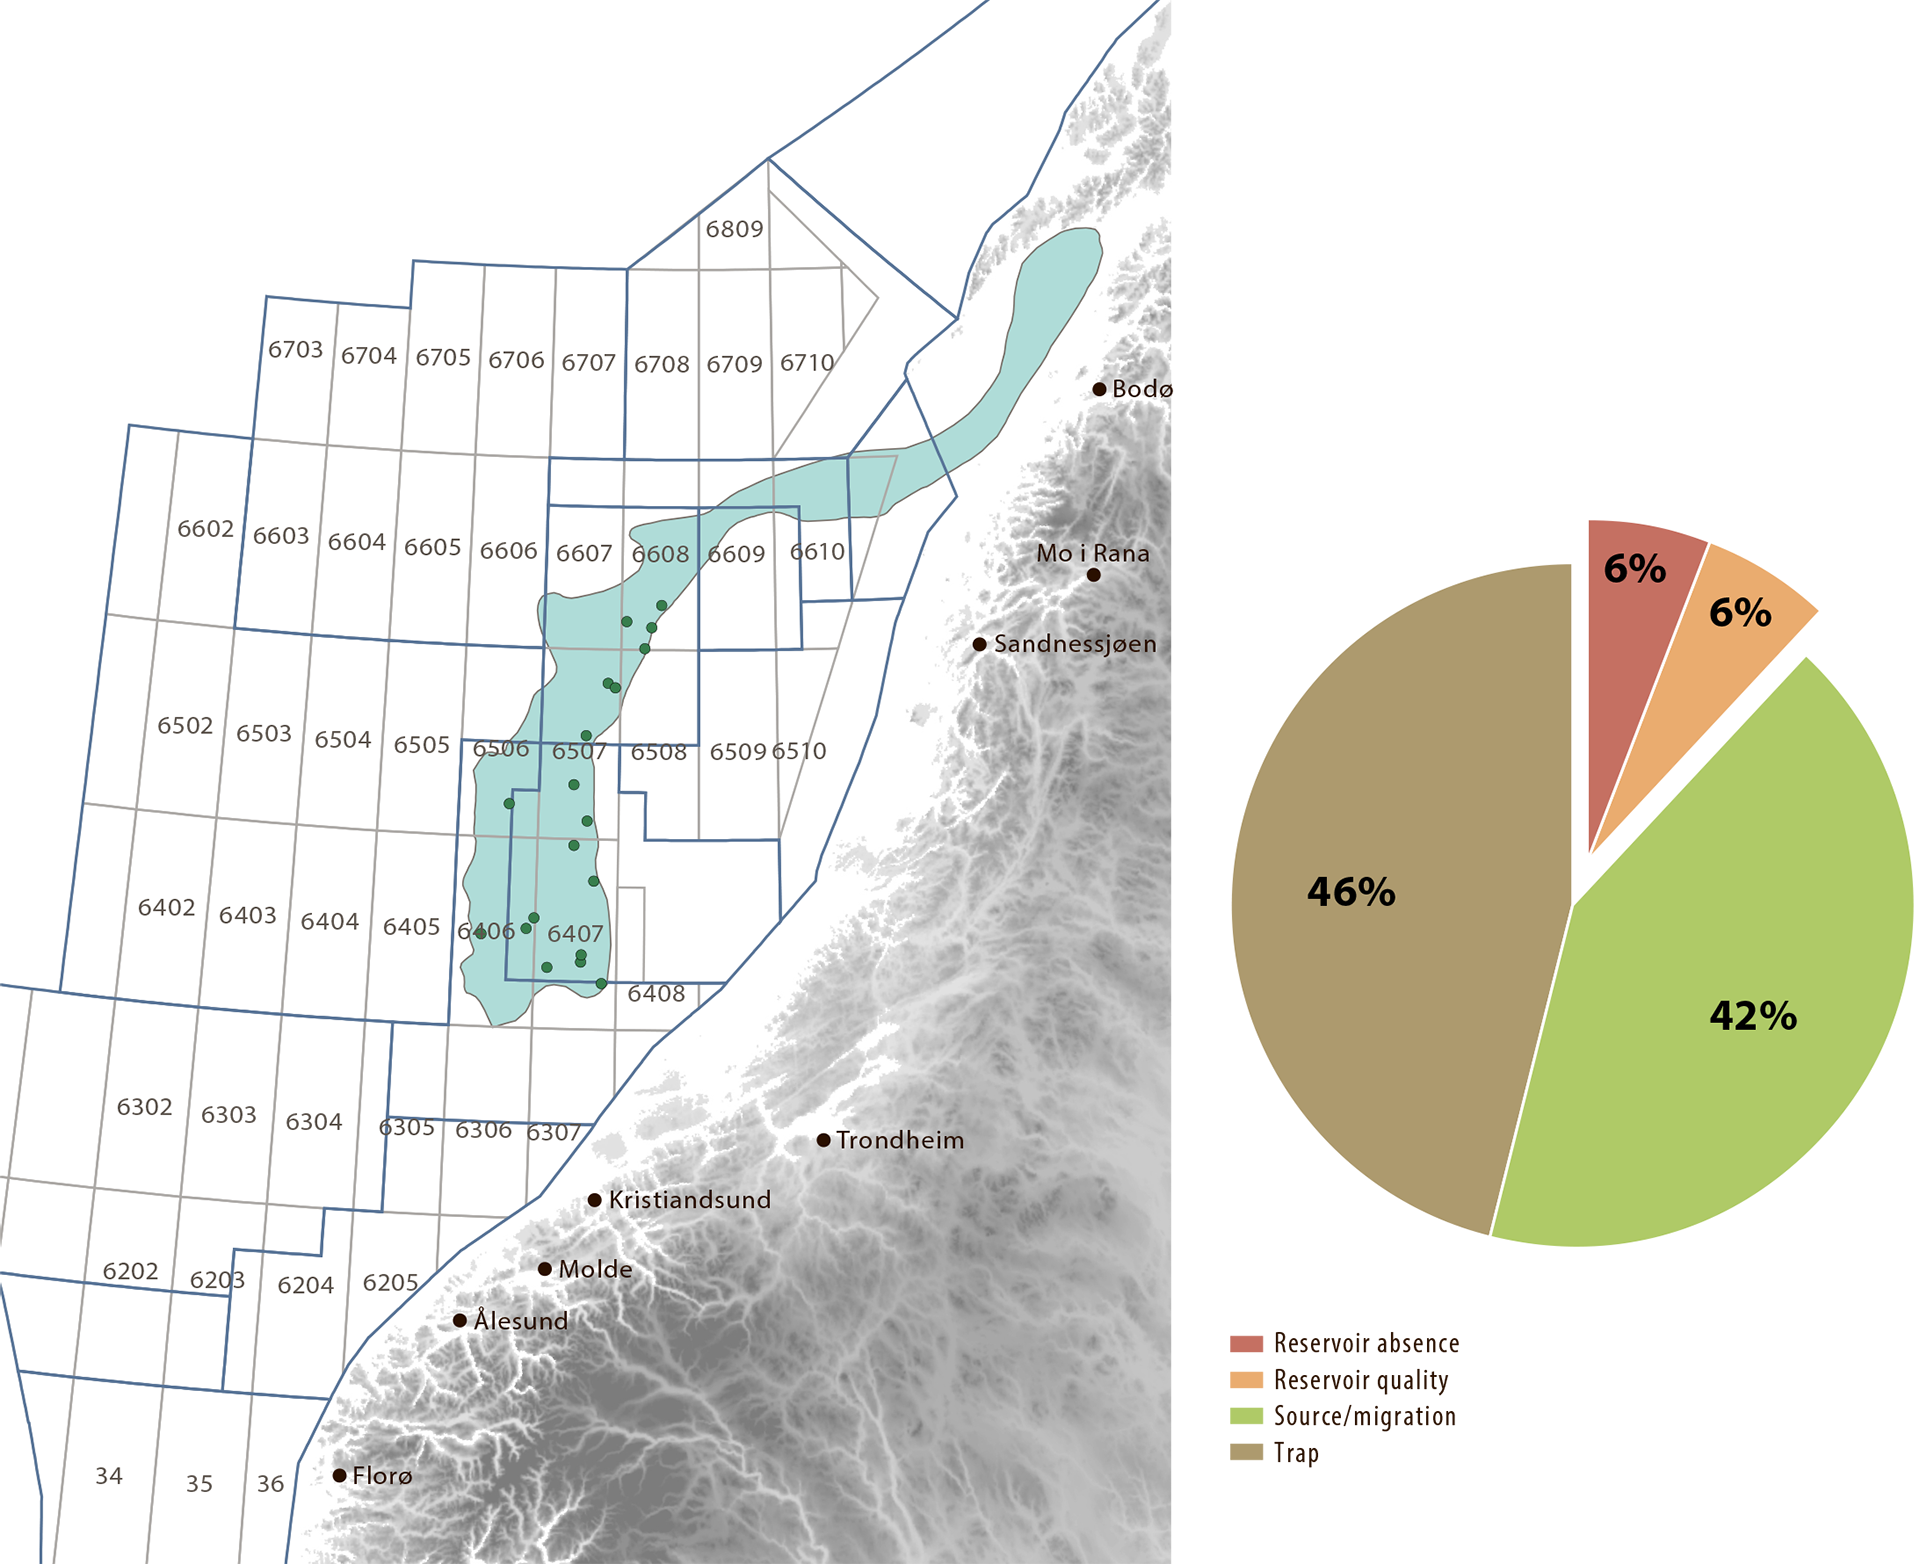
One of the best-explored plays in the Norwegian Sea from 2007-16 was Late Triassic to Middle Jurassic reservoirs. Examples of fields in this play are Njord, Norne, Åsgard, Alve and Heidrun. The database is nevertheless modest, with only 25 exploration targets. Figure 7.12 shows that failed traps and source/migration are reported as the two dominant reasons for dry targets. It also shows that reservoirs are generally present and their quality is too poor in only a few cases.
Figure 7.12
|
