Undiscovered resources
Updating the estimate for undiscovered resources shows that the amount remaining provides the basis for exploration and oil and gas production over several decades to come.
The NPD’s updated estimate for undiscovered resources is 4 000 million standard cubic metres of oil equivalent (scm oe), up by almost 40 per cent from the previous figure. This big growth reflects the NPD’s mapping of resources in the northern part of Barents Sea East. The new estimate shows that remaining resources can provide the basis for oil and gas production over many decades.
The NPD regularly updates its estimate for undiscovered resources on the Norwegian continental shelf (NCS) (see the section on resource classification and resource accounts at 31 December 2017 in chapter 1). Its previous assessment was made in 2015 (see the NPD’s resource report for 2016). The calculation method has remained unchanged since the mid-1990s, which provides a good basis for comparing estimates over time.
UPDATED ESTIMATES FOR UNDISCOVERED RESOURCES
Total undiscovered resources are estimated to lie between 2 330 (P95) and 6 200 (P05) million scm oe (fact box 3.1 and figure 3.1). The expected value is 4 000 million scm oe, up by 37 per cent from 2 920 million in 2015. This big increase primarily reflects the new estimate for Barents Sea North in 2017.
Fact box 3.1: Expected value |
|
The estimate for undiscovered resources is uncertain. Great uncertainty prevails about the mapped prospects, and even more over the number and size of those which have yet to be identified. The method used by the NPD to estimate undiscovered resources (fact box 3.2) quantifies the uncertainty. Estimates are expressed as probability distributions, not single figures. When this report cites the estimate as a single figure, the expected value of the probability distribution is used. The example shows that the probability of finding more than 2 330 million scm oe is 95 per cent, and of finding more than 6 200 million scm oe is five per cent (figure 3.1).
Figure 3.1
|

Fact box 3.2:
|
|
The estimate for undiscovered resources is based on the NPD’s analyses of available data from the NCS. These assessments cover company and NPD interpretations of seismic data, mapping, studies and evaluations of prospectivity in areas both open and closed for petroleum operations. Data from wells, discoveries, fields and mapped prospects occupy a key place in this work. The NPD uses this information to define plays and then to develop a resource estimate for each of these. A play is a geographically delineated area where several geological factors interact so that producible petroleum can be proven. These are as follows. 1) A permeable/porous reservoir rock, where petroleum can accumulate. Reservoir rocks in a specific play will be at specified lithostratigraphic levels. 2) A trap, which is a tight rock or geological structure encasing the reservoir rock so that petroleum is retained and accumulated. The trap must have formed before petroleum has ceased to migrate. 3) A source rock, such as shale, limestone or coal, containing organic material which can be converted to petroleum. This rock must also be mature – in other words, temperature and pressure must be such that petroleum actually forms. A migration route has to exist so that petroleum can move from source to reservoir rock. A play is confirmed when it yields producible petroleum. Production does not have to be commercial. If producible petroleum has yet to be proven, a play is unconfirmed. A prospect is a possible petroleum trap with a mappable, delineated rock volume. For a more extensive description of the methodology, see the resource report for 2016. |
DISTRIBUTION BY AREA
Estimates for undiscovered resources in the North and Norwegian Seas and in Barents Sea South at 31 December 2017 (figure 3.2) are virtually the same as in 2015.

Figure 3.2
Undiscovered resources by area within the spread from P95 to P05. The numbers shown are the expected values.
Uncertainty in these estimates is greatest in areas with little information and a short exploration history, such as much of the Barents Sea. That applies particularly to Barents Sea South-East and North. Uncertainty is considerably smaller in the North Sea and the wellexplored part of the Norwegian Sea.
The estimate for undiscovered resources shows that the amount remaining could provide the basis for exploration and oil and gas production over several decades to come.
More than 60 per cent of undiscovered resources are expected to lie in the Barents Sea, with the remainder divided more or less equally between the North and Norwegian Seas (figure 3.3).
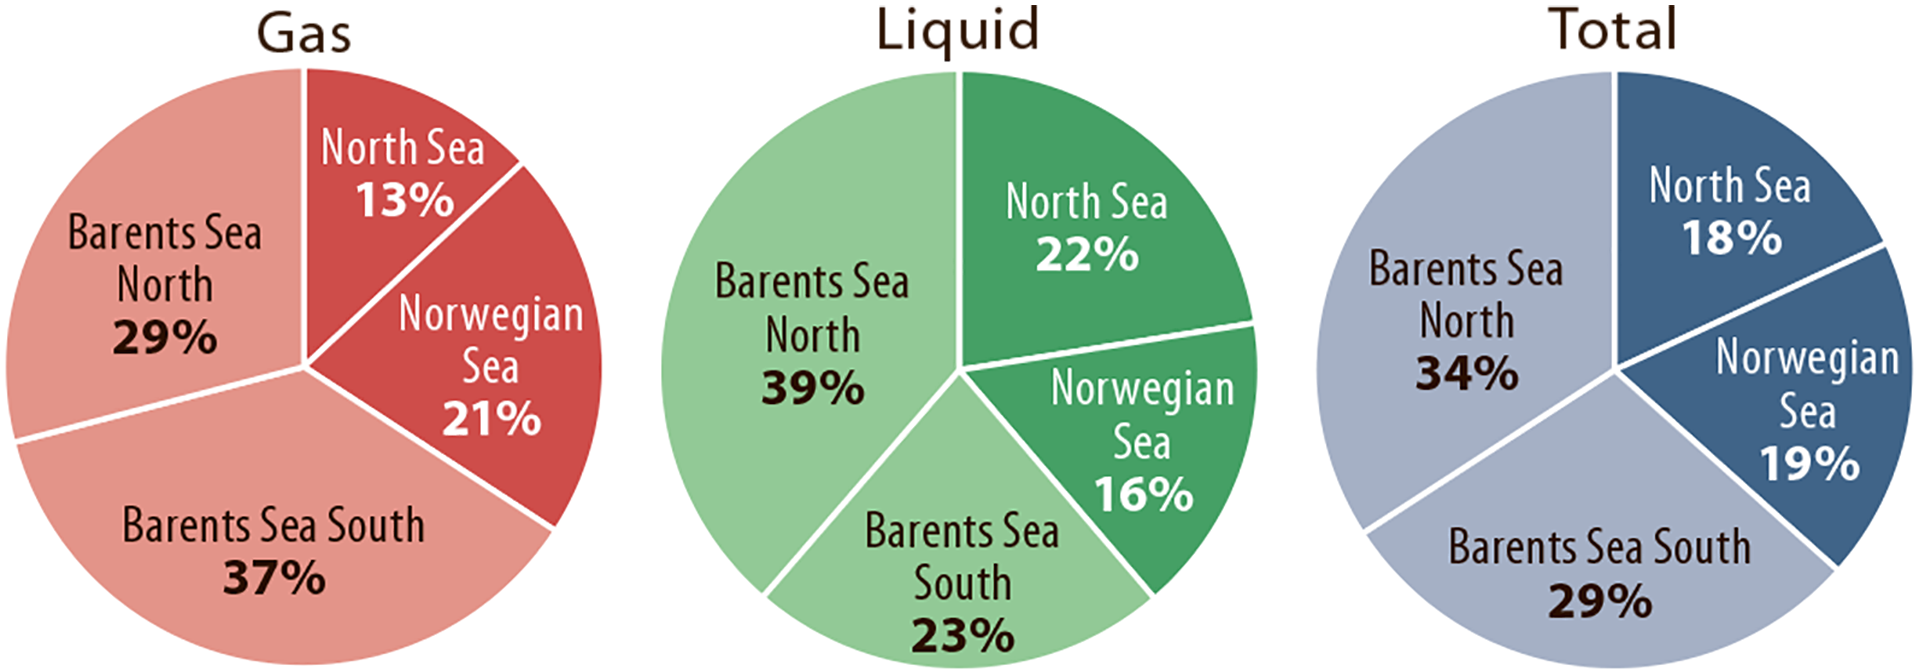
Liquids are expected to account for just over half the undiscovered resources. As figures 3.3 and 3.4 show, the distribution between liquid and gas varies from one sea area to another.

Figure 3.3
Distribution of undiscovered resources in each area: gas, liquids and total.
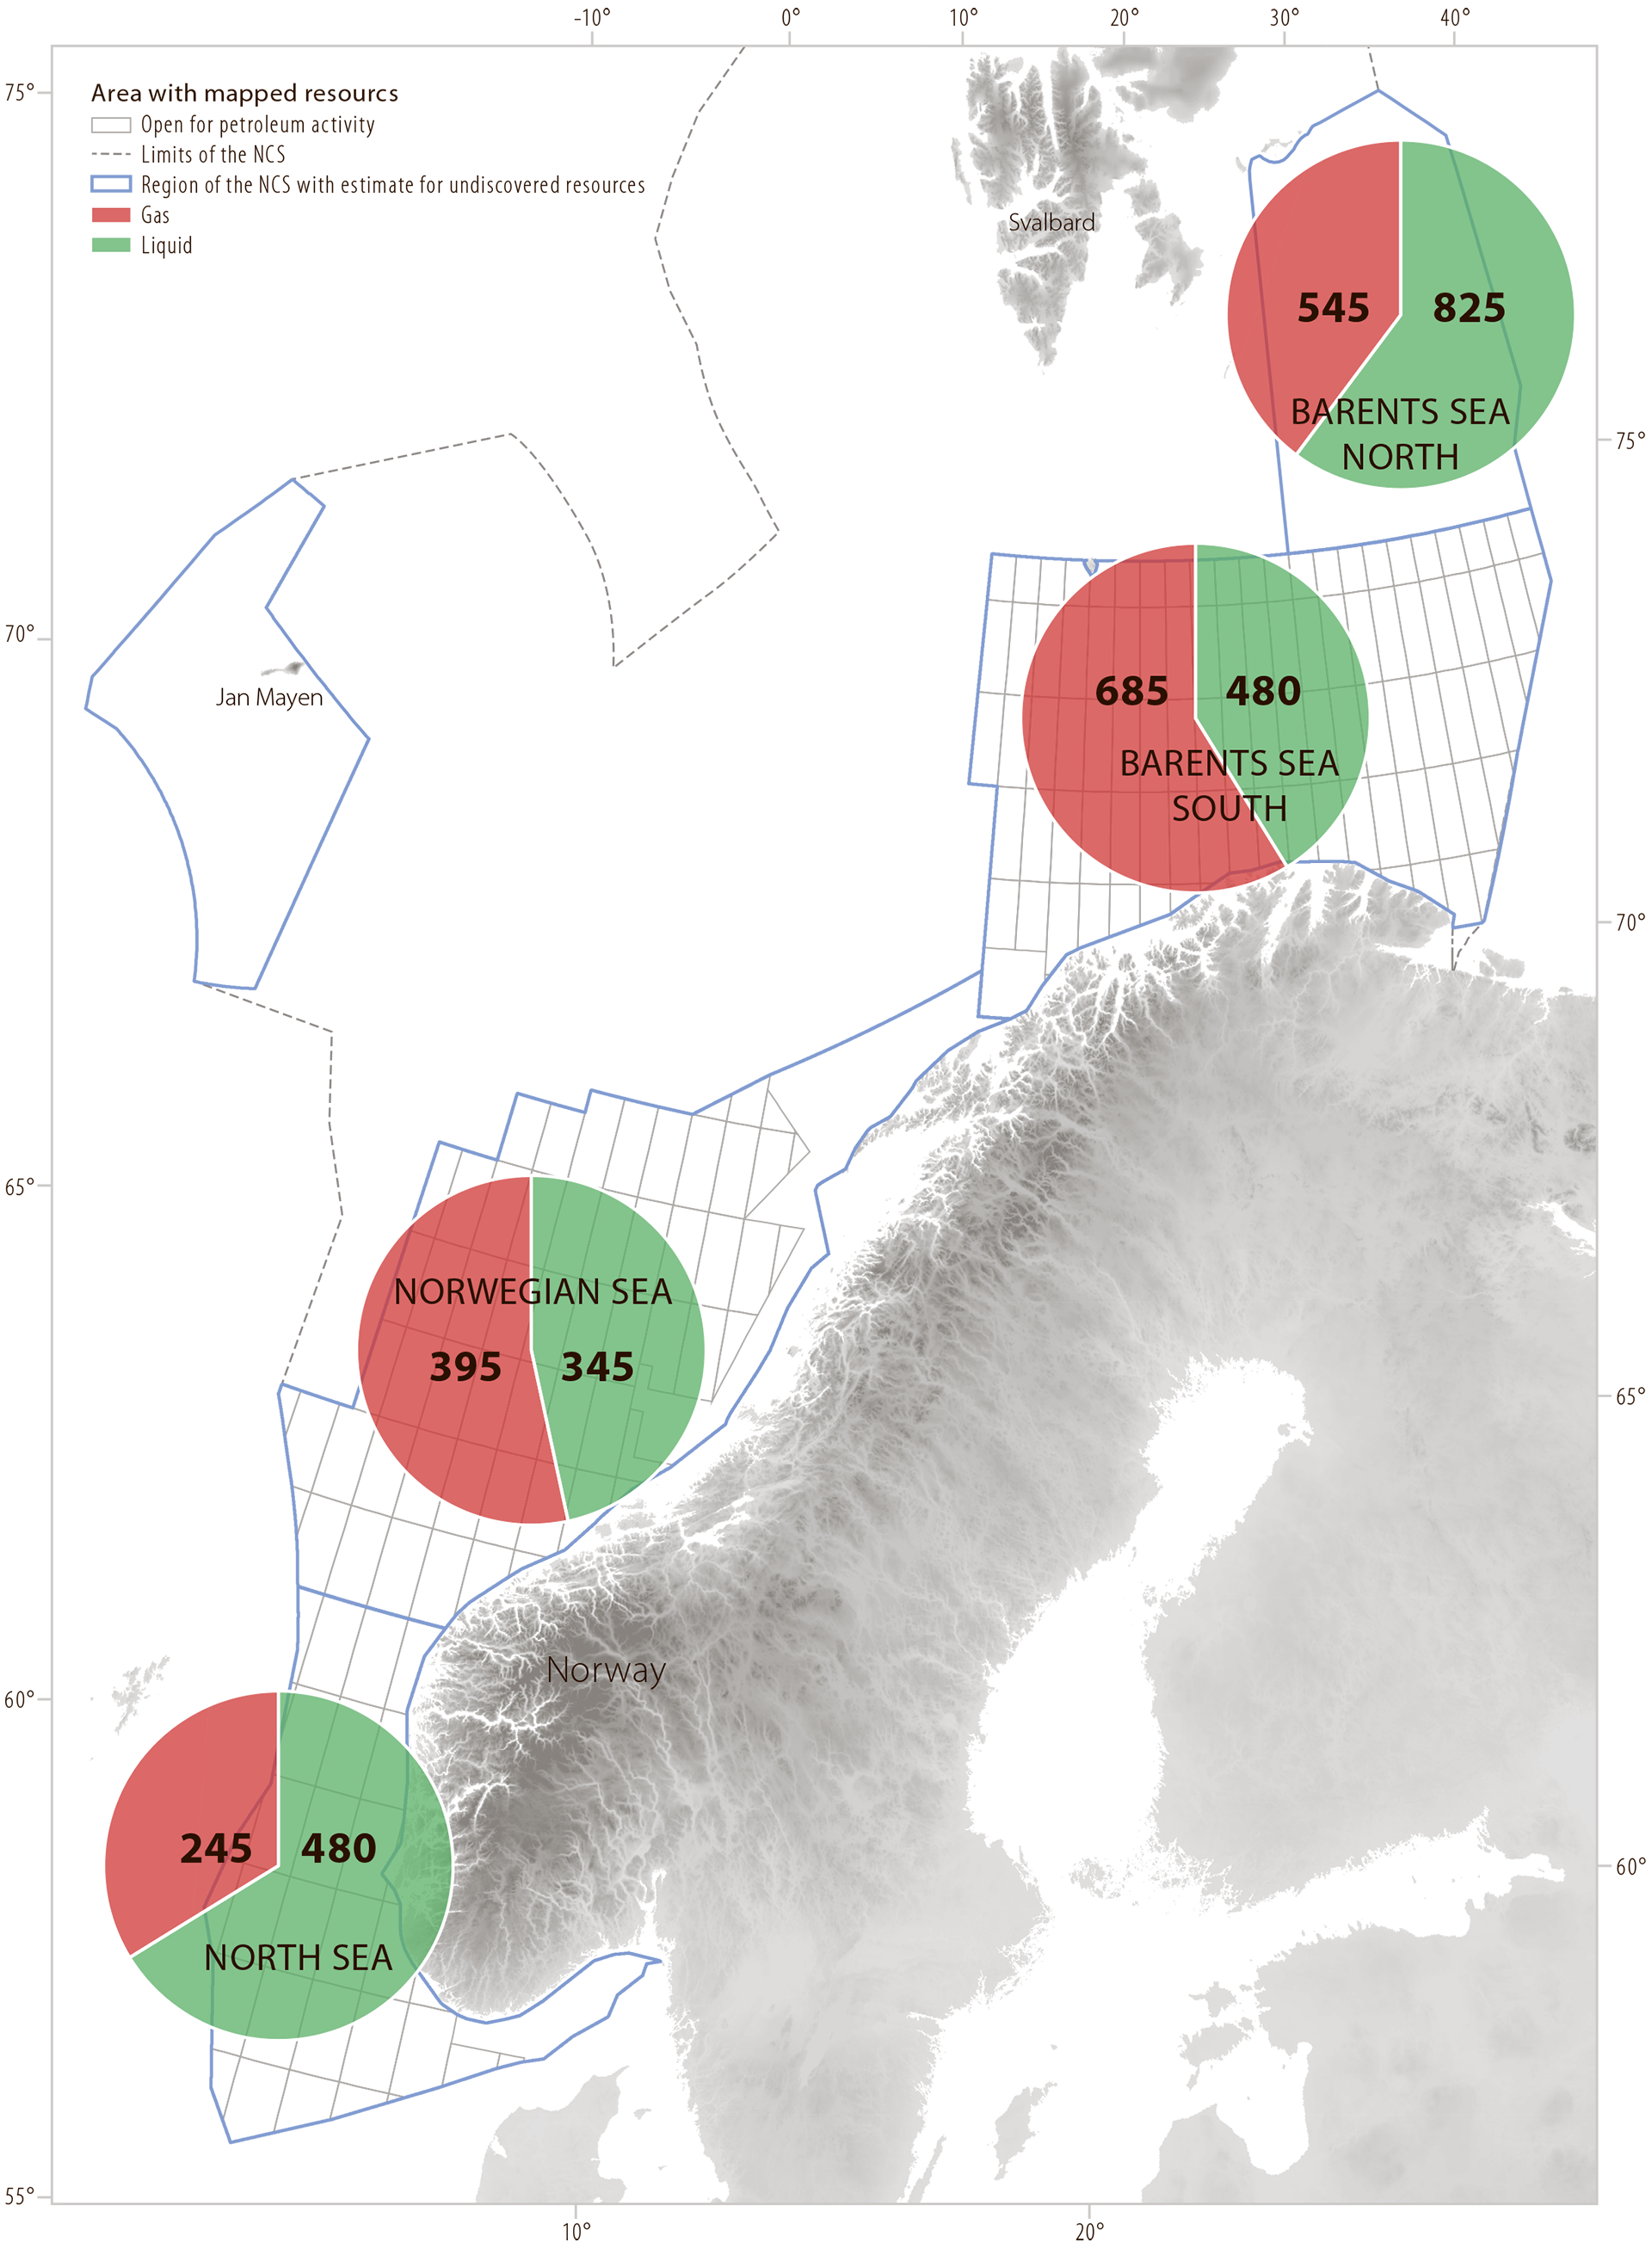
Figure 3.4
Expected relationship between undiscovered liquid and gas in the various areas. Figures in million scm oe.
HISTORICAL CHANGES
The estimate for total undiscovered resources has varied over time (figure 3.5). New knowledge from mapping and exploration wells may lead to substantial revisions of the figures, both positive and negative. Over time, however, estimates will reduce naturally as prospects are drilled.
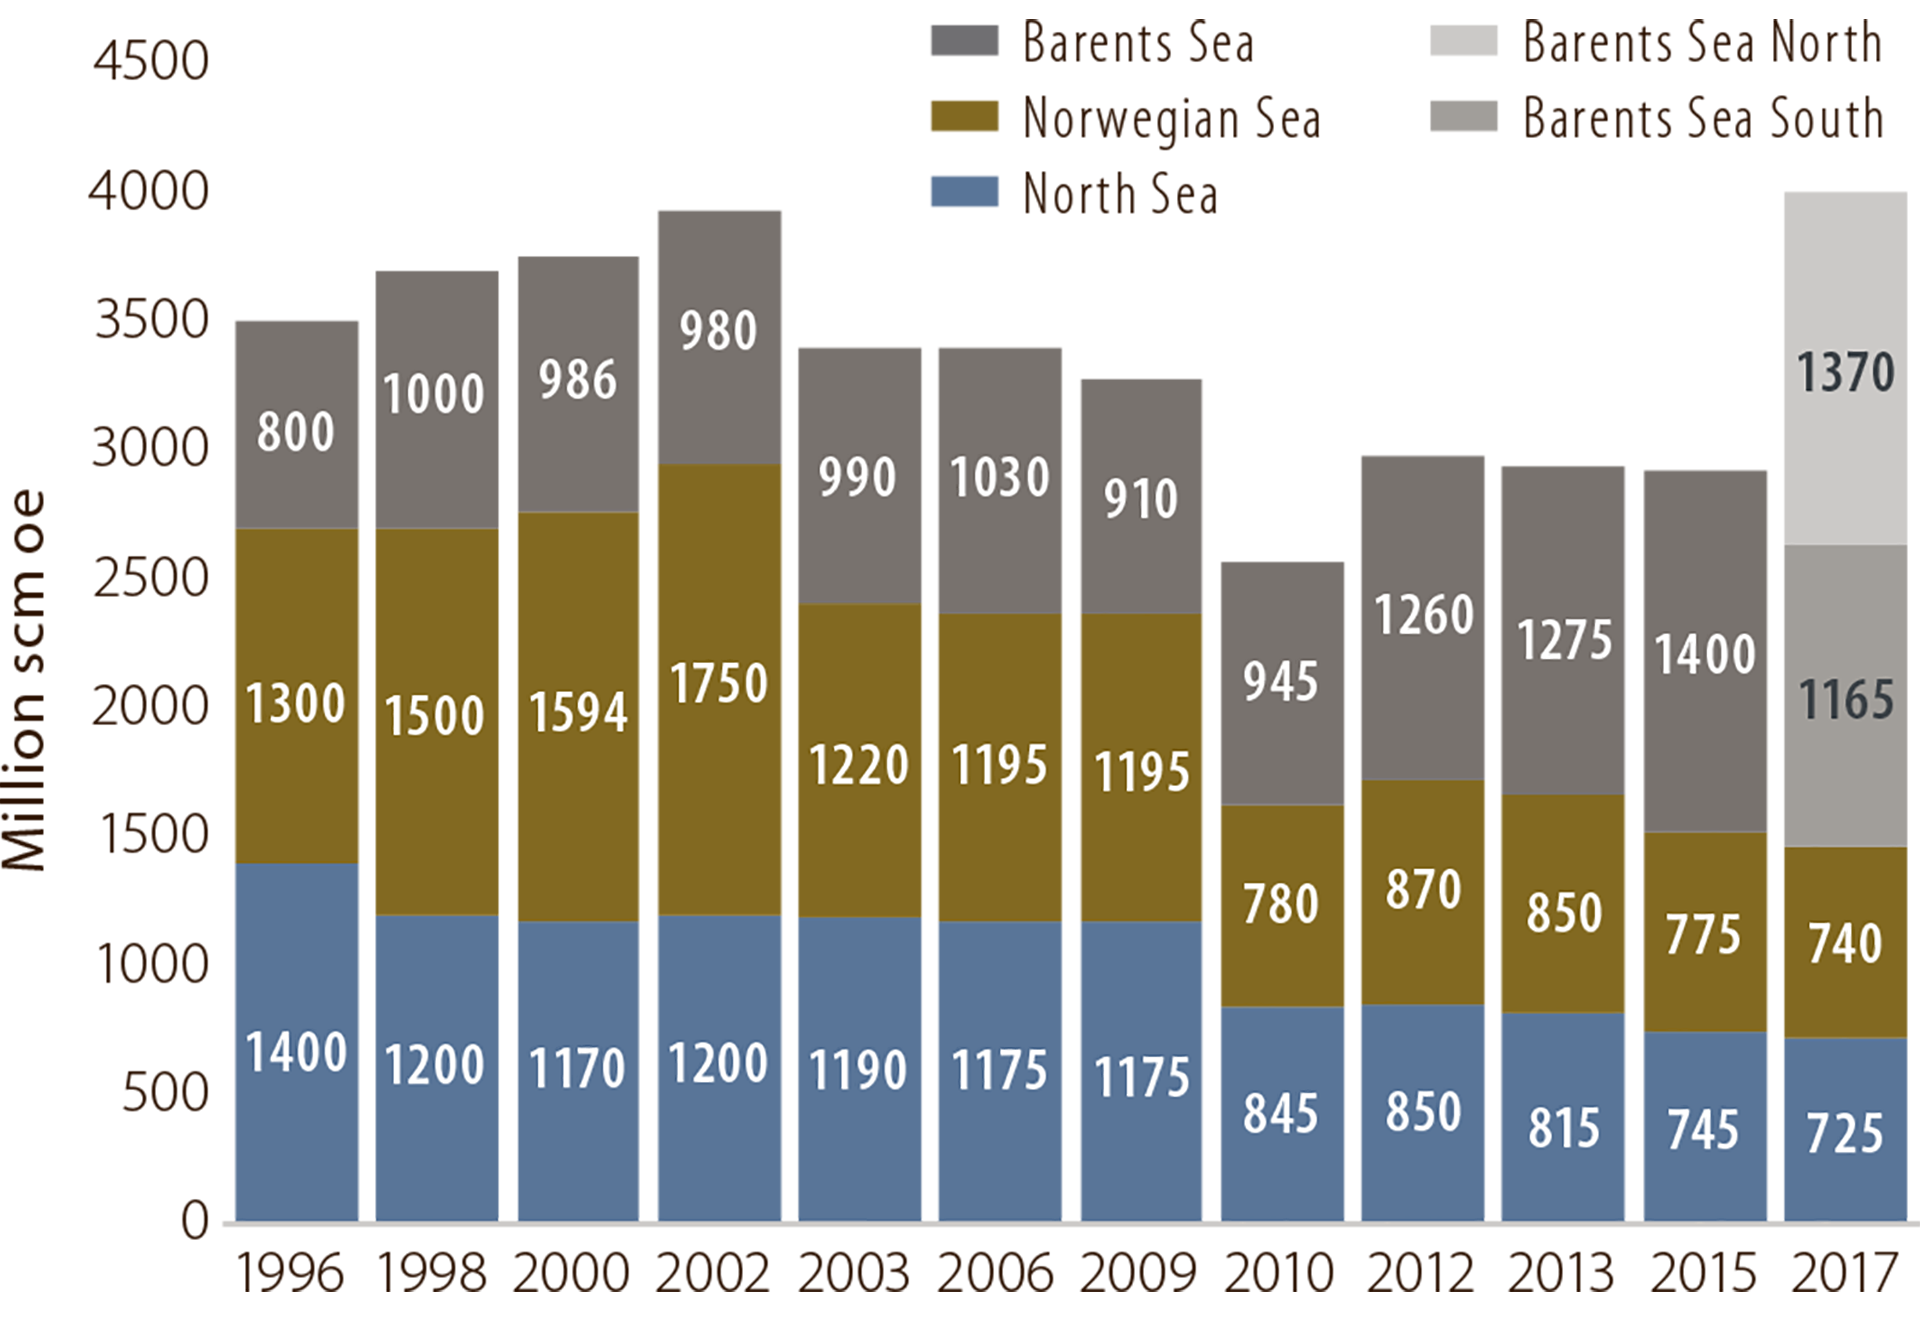
Figure 3.5
Development in estimates for undiscovered resources over time. The 2017 estimate includes the eastern part of the Norwegian sector in Barents Sea North.
After rising from 1996 to 2002, the estimates declined up to 2017. The discovery of Ormen Lange in 1997 raised great expectations for a number of large structures in the deepwater areas of the Norwegian Sea. However, disappointing wildcats prompted a downgrading of the estimates in 2003. That related particularly to the gas potential in the deepwater areas.
While the estimate for the Barents Sea increased in 2010, those for the North and Norwegian Seas were reduced. These reductions primarily reflected lower expectations for gas. The main reason in the Norwegian Sea was further disappointing exploration results with large structures in the deepwater areas. Changed expectations of the potential off Lofoten, Vesterålen and Senja, based on seismic data acquisition and mapping by the NPD, also affected the results. See the NPD’s 2010 reports on Petroleum resources in the sea areas off Lofoten, Vesterålen and Senja and Geofaglig vurdering av petroleumsressursene i havområdene utenfor Lofoten, Vesterålen og Senja (in Norwegian only).
The background for the 2012 increase in the Barents Sea was the NPD’s mapping and inclusion of Barents Sea South-East. This area was incorporated in the Norwegian sector after the boundary treaty with Russia came into force in 2011. In the same year, the sea areas around Jan Mayen were included in the estimate for the Norwegian Sea. That increased the total estimate for undiscovered resources.
Before 2017, the resource estimate for the Barents Sea primarily covered undiscovered resources in Barents Sea South – including those in plays which extend into Barents Sea North. The NPD’s mapping of the latter area in 2016-17 led to the eastern part being separated out with its own estimate. See the NPD report on Geological assessment of petroleum resources in eastern parts of Barents Sea North 2017. This area accounts for about 35 per cent of the undiscovered resources, and thereby contains the largest proportion of these on the NCS. No similar mapping has been carried out in the other parts of Barents Sea North.
ESTIMATES BY STRATIGRAPHIC LEVEL
How contributions to resources break down by geological time period varies between the areas. That reflects their geological development.
Figure 3.6 shows that about 80 per cent of the undiscovered resources in the North Sea are expected to lie in Jurassic plays, while the corresponding figures for the Norwegian Sea, Barents Sea South and Barents Sea North are about 50 per cent,7 35 per cent and 18 per cent respectively. The Norwegian Sea contains a larger proportion of younger rocks, while these (Late Jurassic, Cretaceous and Palaeocene) have been eroded away in parts of the Barents Sea. That means older rocks, primarily Triassic, lie at depths favourable for petroleum generation.
7 The upper part of the Triassic is included in Early to Middle Jurassic plays in the North and Norwegian Seas, but makes a limited contribution to resources in these plays.
Fifty-five per cent of undiscovered resources in Barents Sea South are expected to lie in Triassic or older plays, while the corresponding estimate for Barents Sea North is about 80 per cent.

Figure 3.6
Recoverable undiscovered resources in each area by stratigraphic level. The percentage distribution reflects the geological development in each area.
WELL AND RESOURCE DENSITY
With some exceptions, the North and Norwegian Seas and Barents Sea South have been opened for petroleum operations. These areas total about 579 000 km2. By comparison, mainland Norway covers some 324 000 km2.
Wildcats completed at 31 December 2017 totalled 731 in the North Sea, 241 in the Norwegian Sea and 116 in Barents Sea South. Figure 3.7 shows the number of wildcats per block as an illustration of the degree of exploration.
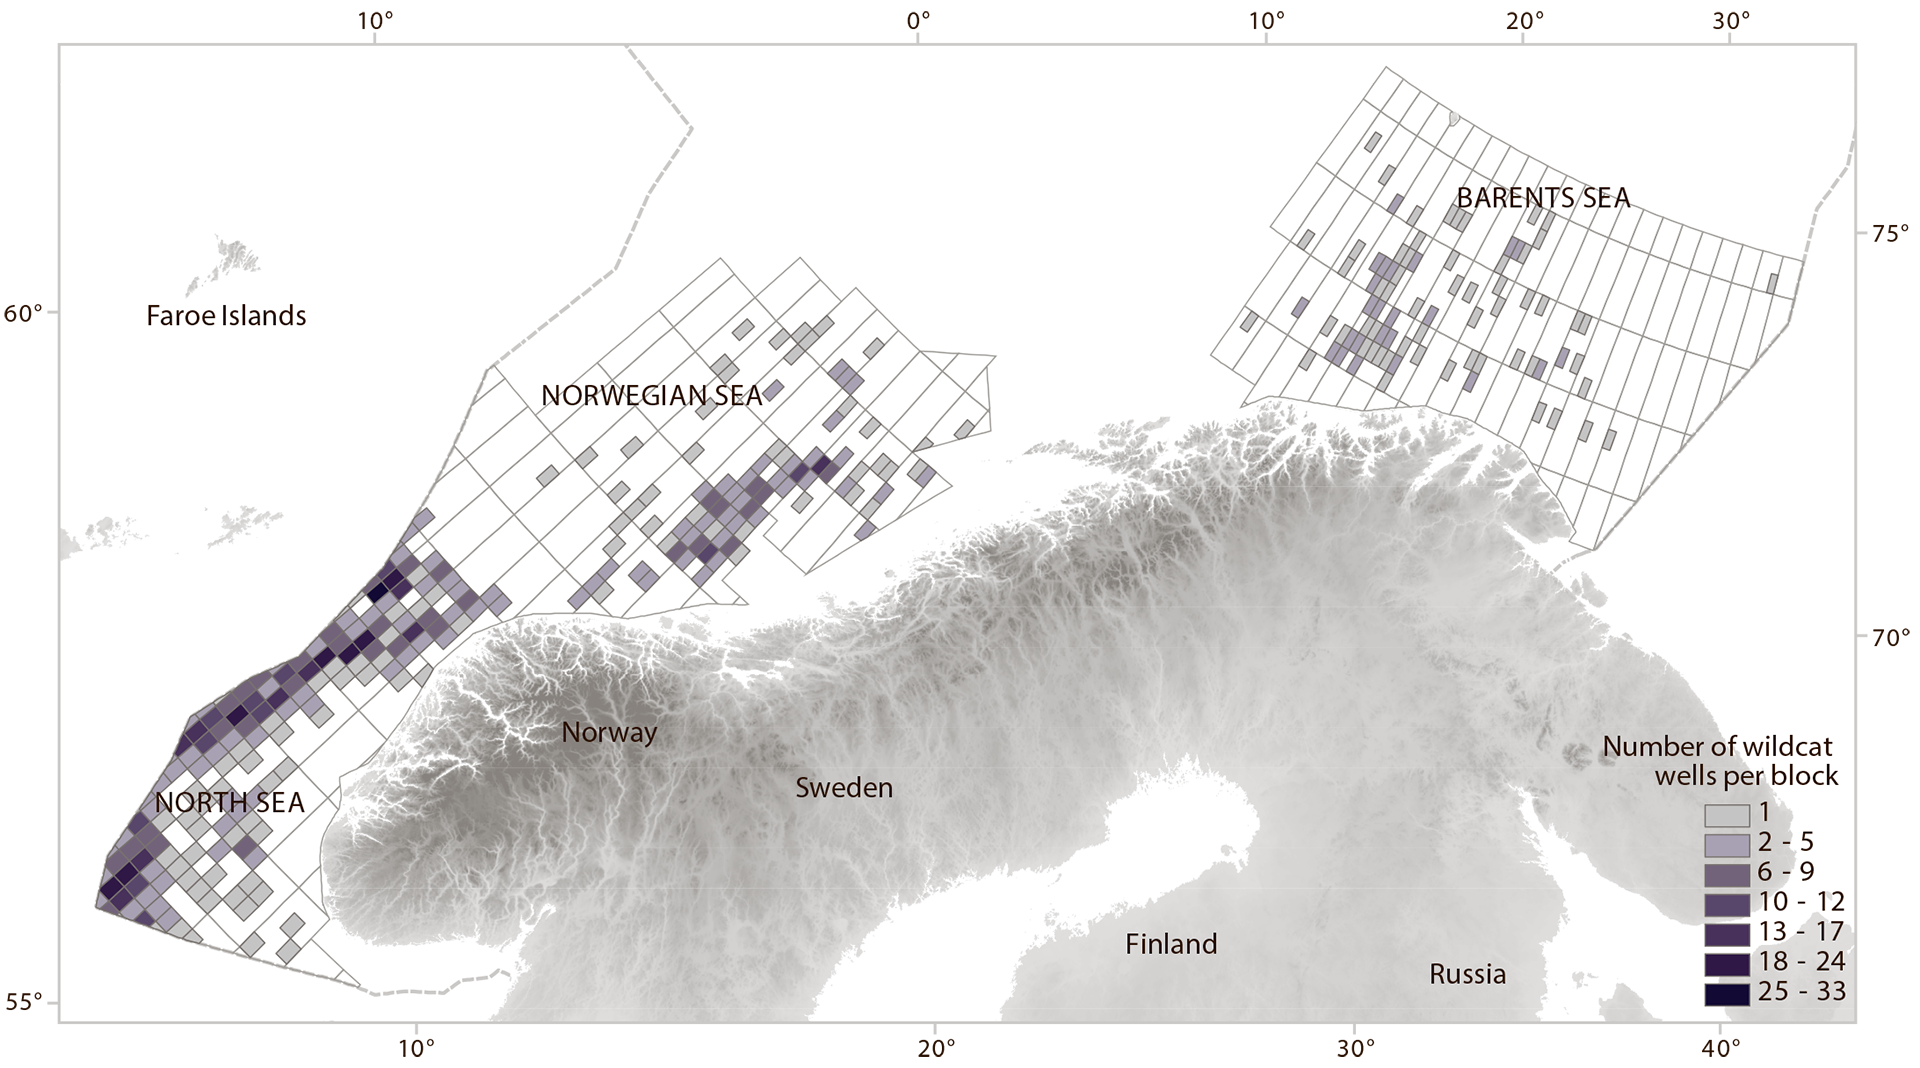
Figure 3.7
Wildcats per block.
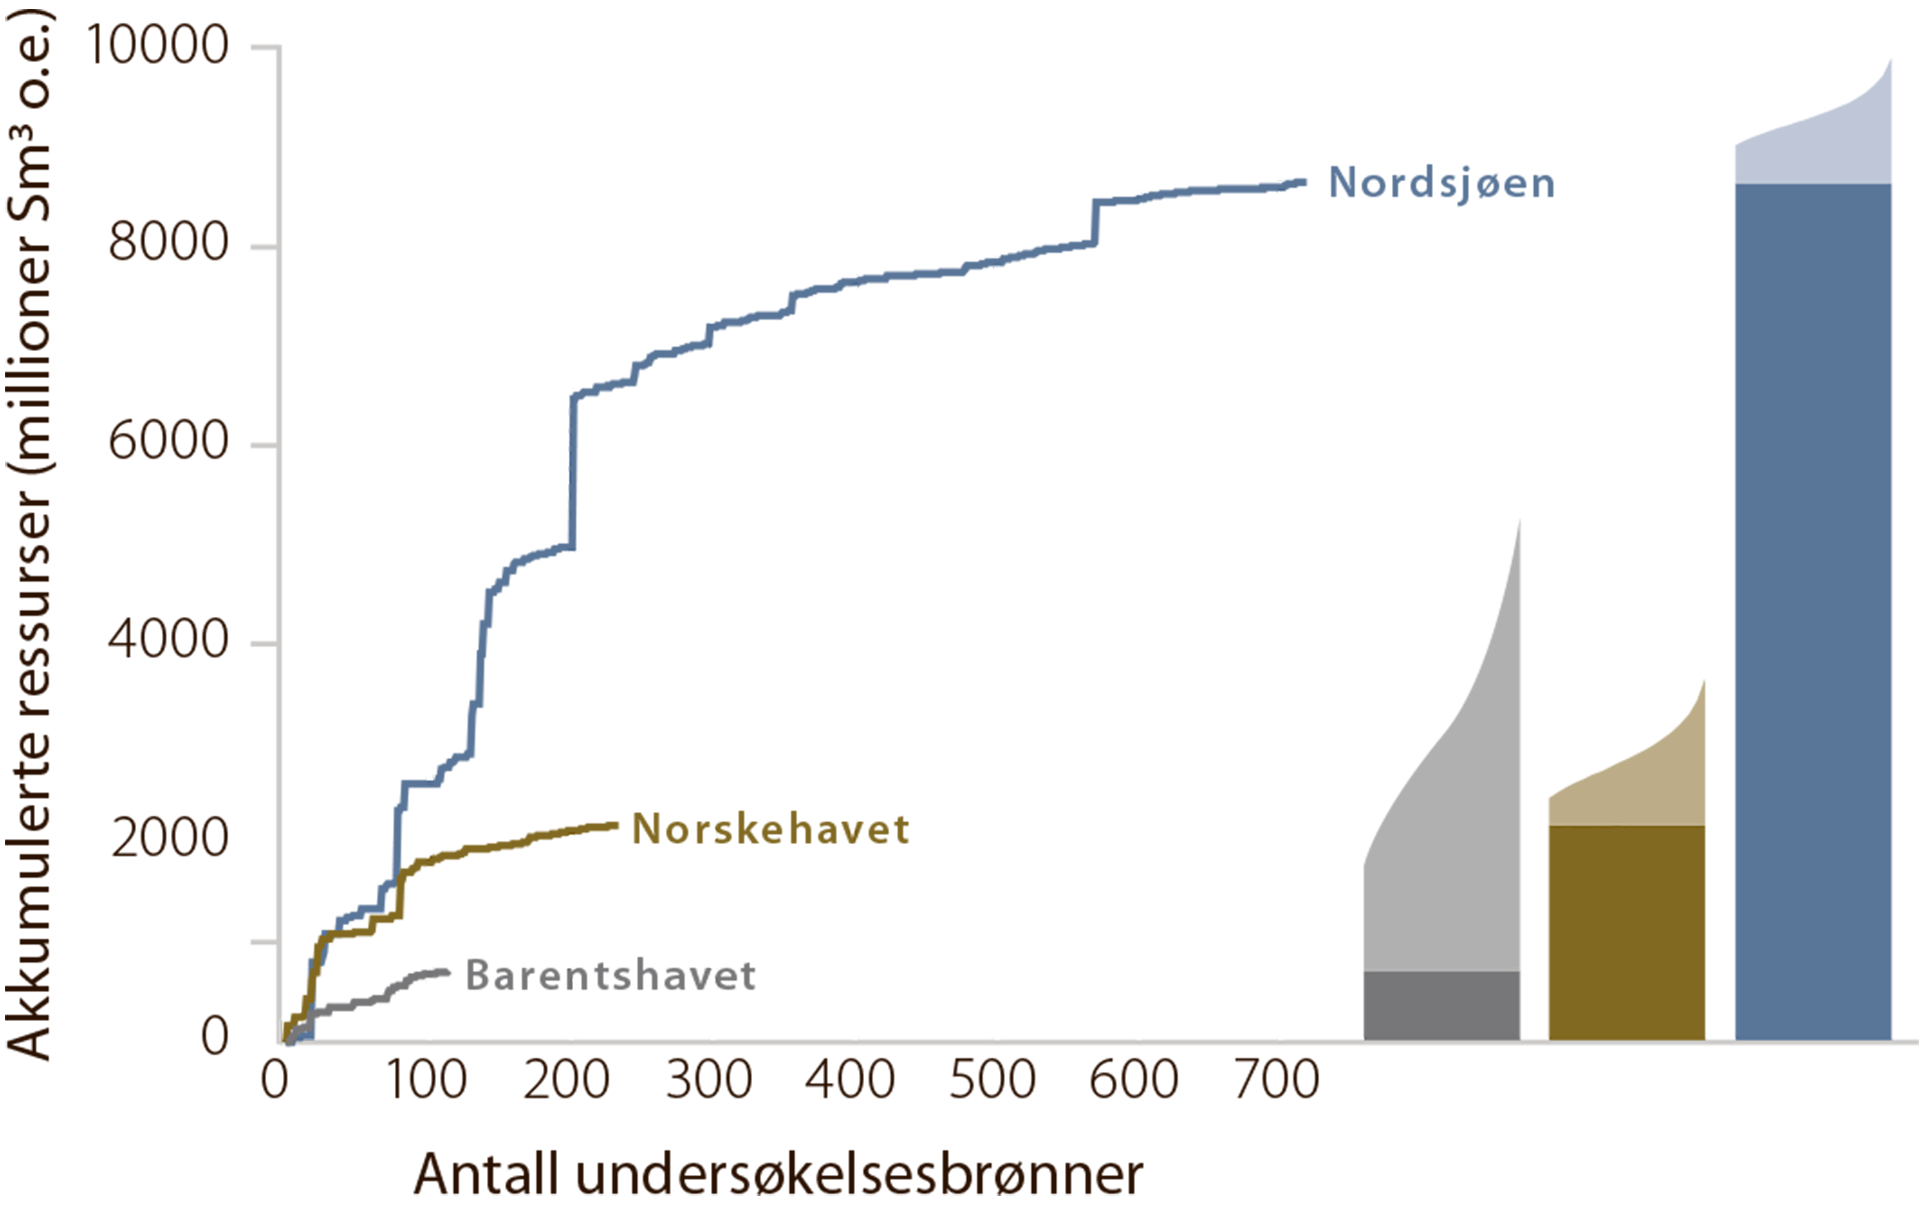
Total resource density (proven and undiscovered) in Norway’s North Sea sector is very high, at 66 million scm oe per 1 000 km2. This is very high, also in a global context, and comparable with the best petroleum provinces in the Middle East.
The Norwegian and Barents Seas cannot be compared with the North Sea, which represents a unique petroleum province (figure 3.8). Total resource density in the Norwegian Sea and Barents Sea South averages 10 million and 5.5 million scm oe per 1 000 km2 respectively. The estimate for undiscovered resources in the mapped part of Barents Sea North gives a relatively high average resource density of about 10 million scm oe per 1 000 km2.

Figure 3.8
Accumulated resources by area.
Resources already discovered are shown in dark colours. Undiscovered resources are shown with their uncertainty range in lighter colours on top.8
8 The figure does not show the uncertainty in proven resources.
The North Sea ranks as a unique petroleum province because of its combination of a very extensive and productive source rock and good reservoir formations of varying geological age. The most important source of oil and gas is organically rich Late Jurassic shales. These rocks extend across much of the North Sea at a favourable depth for generating hydrocarbons. Moreover, the traps formed at a favourable time in relation to hydrocarbon migration. Similar conditions are found on the Halten and Dønna Terraces in the Norwegian Sea. However, traditional plays with Jurassic source and reservoir rocks do not function in the deepwater areas to the west. These sediments lie too deep. On the other hand, a potential exists in younger Cretaceous and Palaeocene rocks.
Geological developments in the Barents Sea have differed greatly from those in the North Sea, and were strongly influenced by several phases of burial, uplift and subsequent erosion. As a result, Jurassic rocks only lie at a favourable depth for generating hydrocarbons in certain areas. Uplift and erosion have also meant that petroleum is not always retained in the traps, primarily because of leakage. In areas where Jurassic rocks are absent or too shallow, Triassic or older sources could generate hydrocarbons. These source rocks do not appear to be as rich as their Jurassic equivalents in the North Sea.
The Barents Sea is a very large area, and extensive parts of it are relatively little explored. Its geological history is more complicated than in the other sea areas. Every well, whether dry or proving a discovery, provides new information about the geology and petroleum systems. Most of the prospects to be drilled in 2018 are geologically independent of those explored in 2017, and will extend knowledge of the various parts of the Barents Sea.
Fact box 3.3:
|
|
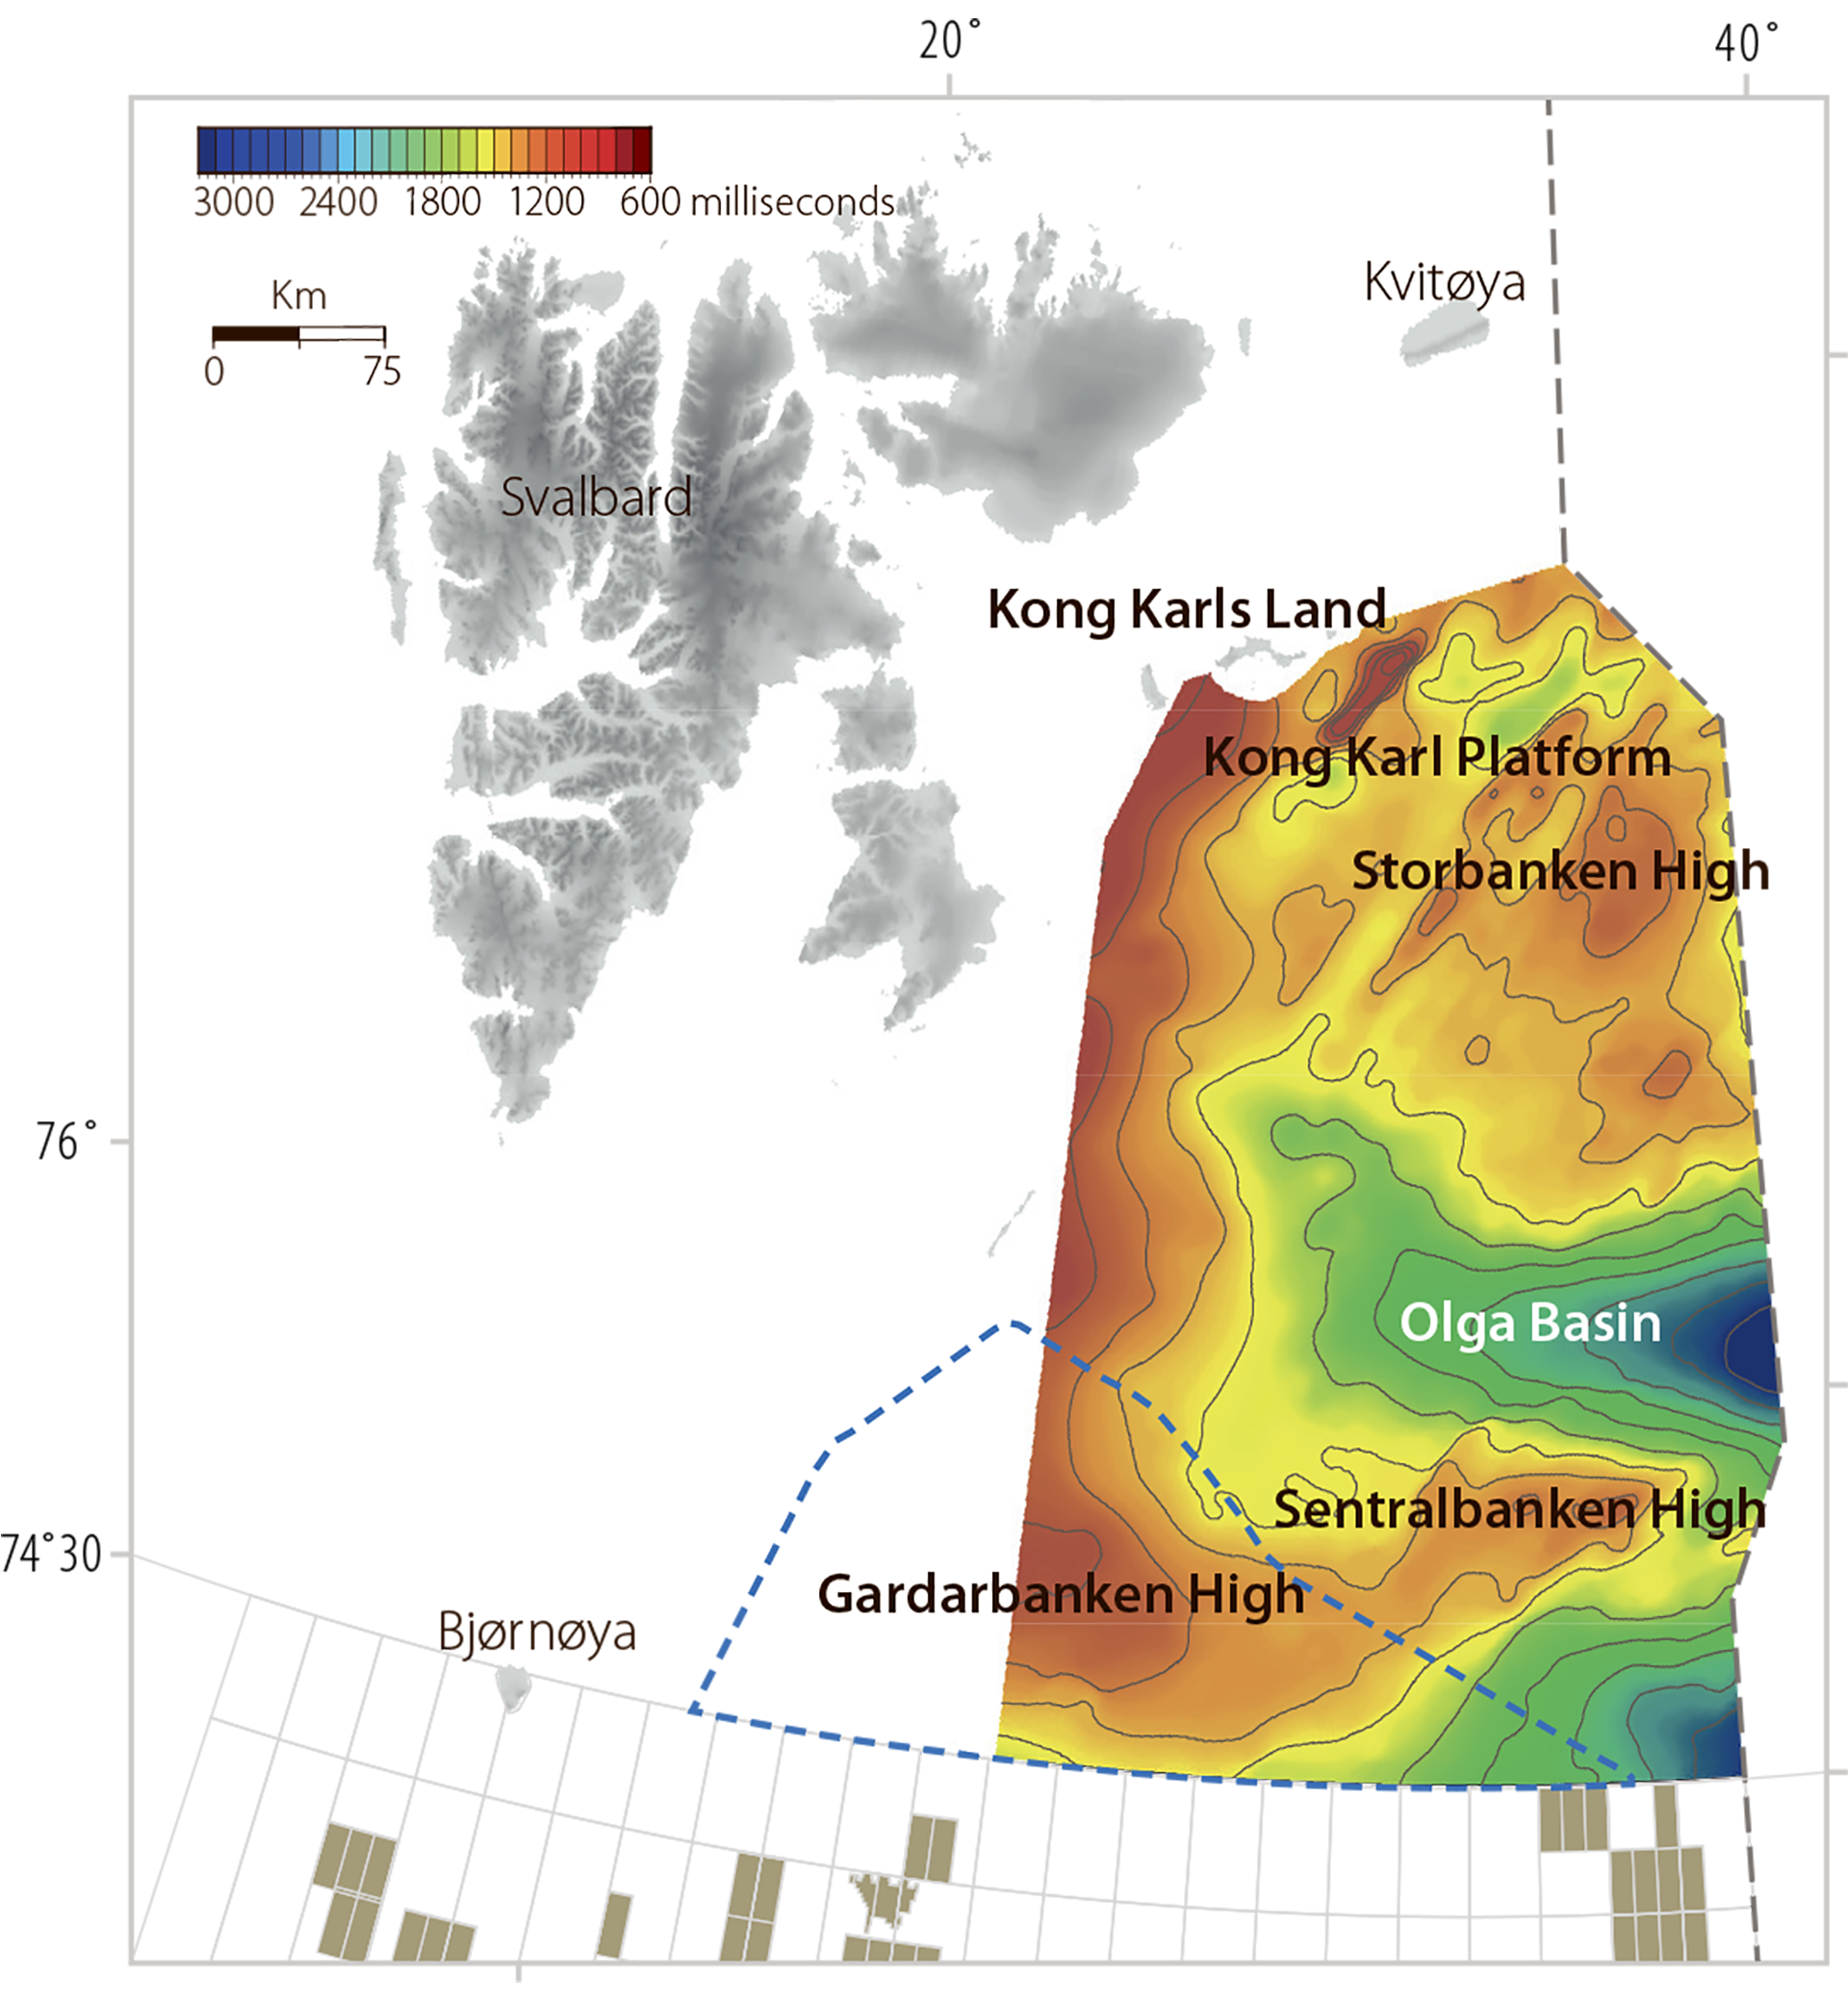
The NPD’s acquisition of geological information and mapping of unopened and little-explored parts of the NCS help to enhance understanding of the geology and increase data coverage of these areas. A good data and knowledge base is a prerequisite for the government to play a decisive role in resource management. The NPD’s mapping work is funded over the central government budget. In the autumn of 2017, the NPD acquired some 4 500 kilometres of two-dimensional seismic data on the Gardarbank High east and north-east of Bjørnøya in the Barents Sea. This geological ridge lies between the Spitsbergen Bank and the Hopen Deep. Seismic surveys were conducted by the NPD in the eastern part of Barents Sea North in 2012-16. Results from this work were presented in the spring of 2017 in the report Geological assessment of petroleum resources in eastern parts of Barents Sea North 2017. The survey on the Gardarbank High represented an extension of this work towards the west, and provided substantially better data coverage of the area. Plans call for work on processing the new seismic information to be completed in the third quarter of 2018, and the data will then be included in the NPD’s evaluation projects. |

Figure 3.9
Time contour map for the top of the Permian which shows the extent of the mapped area.
Source: Geological assessment of petroleum resources in eastern parts of Barents Sea North 2017. The dotted line shows the survey area around the Gardarbank. High in the autumn of 2017.
Fact box 3.4:
|
|
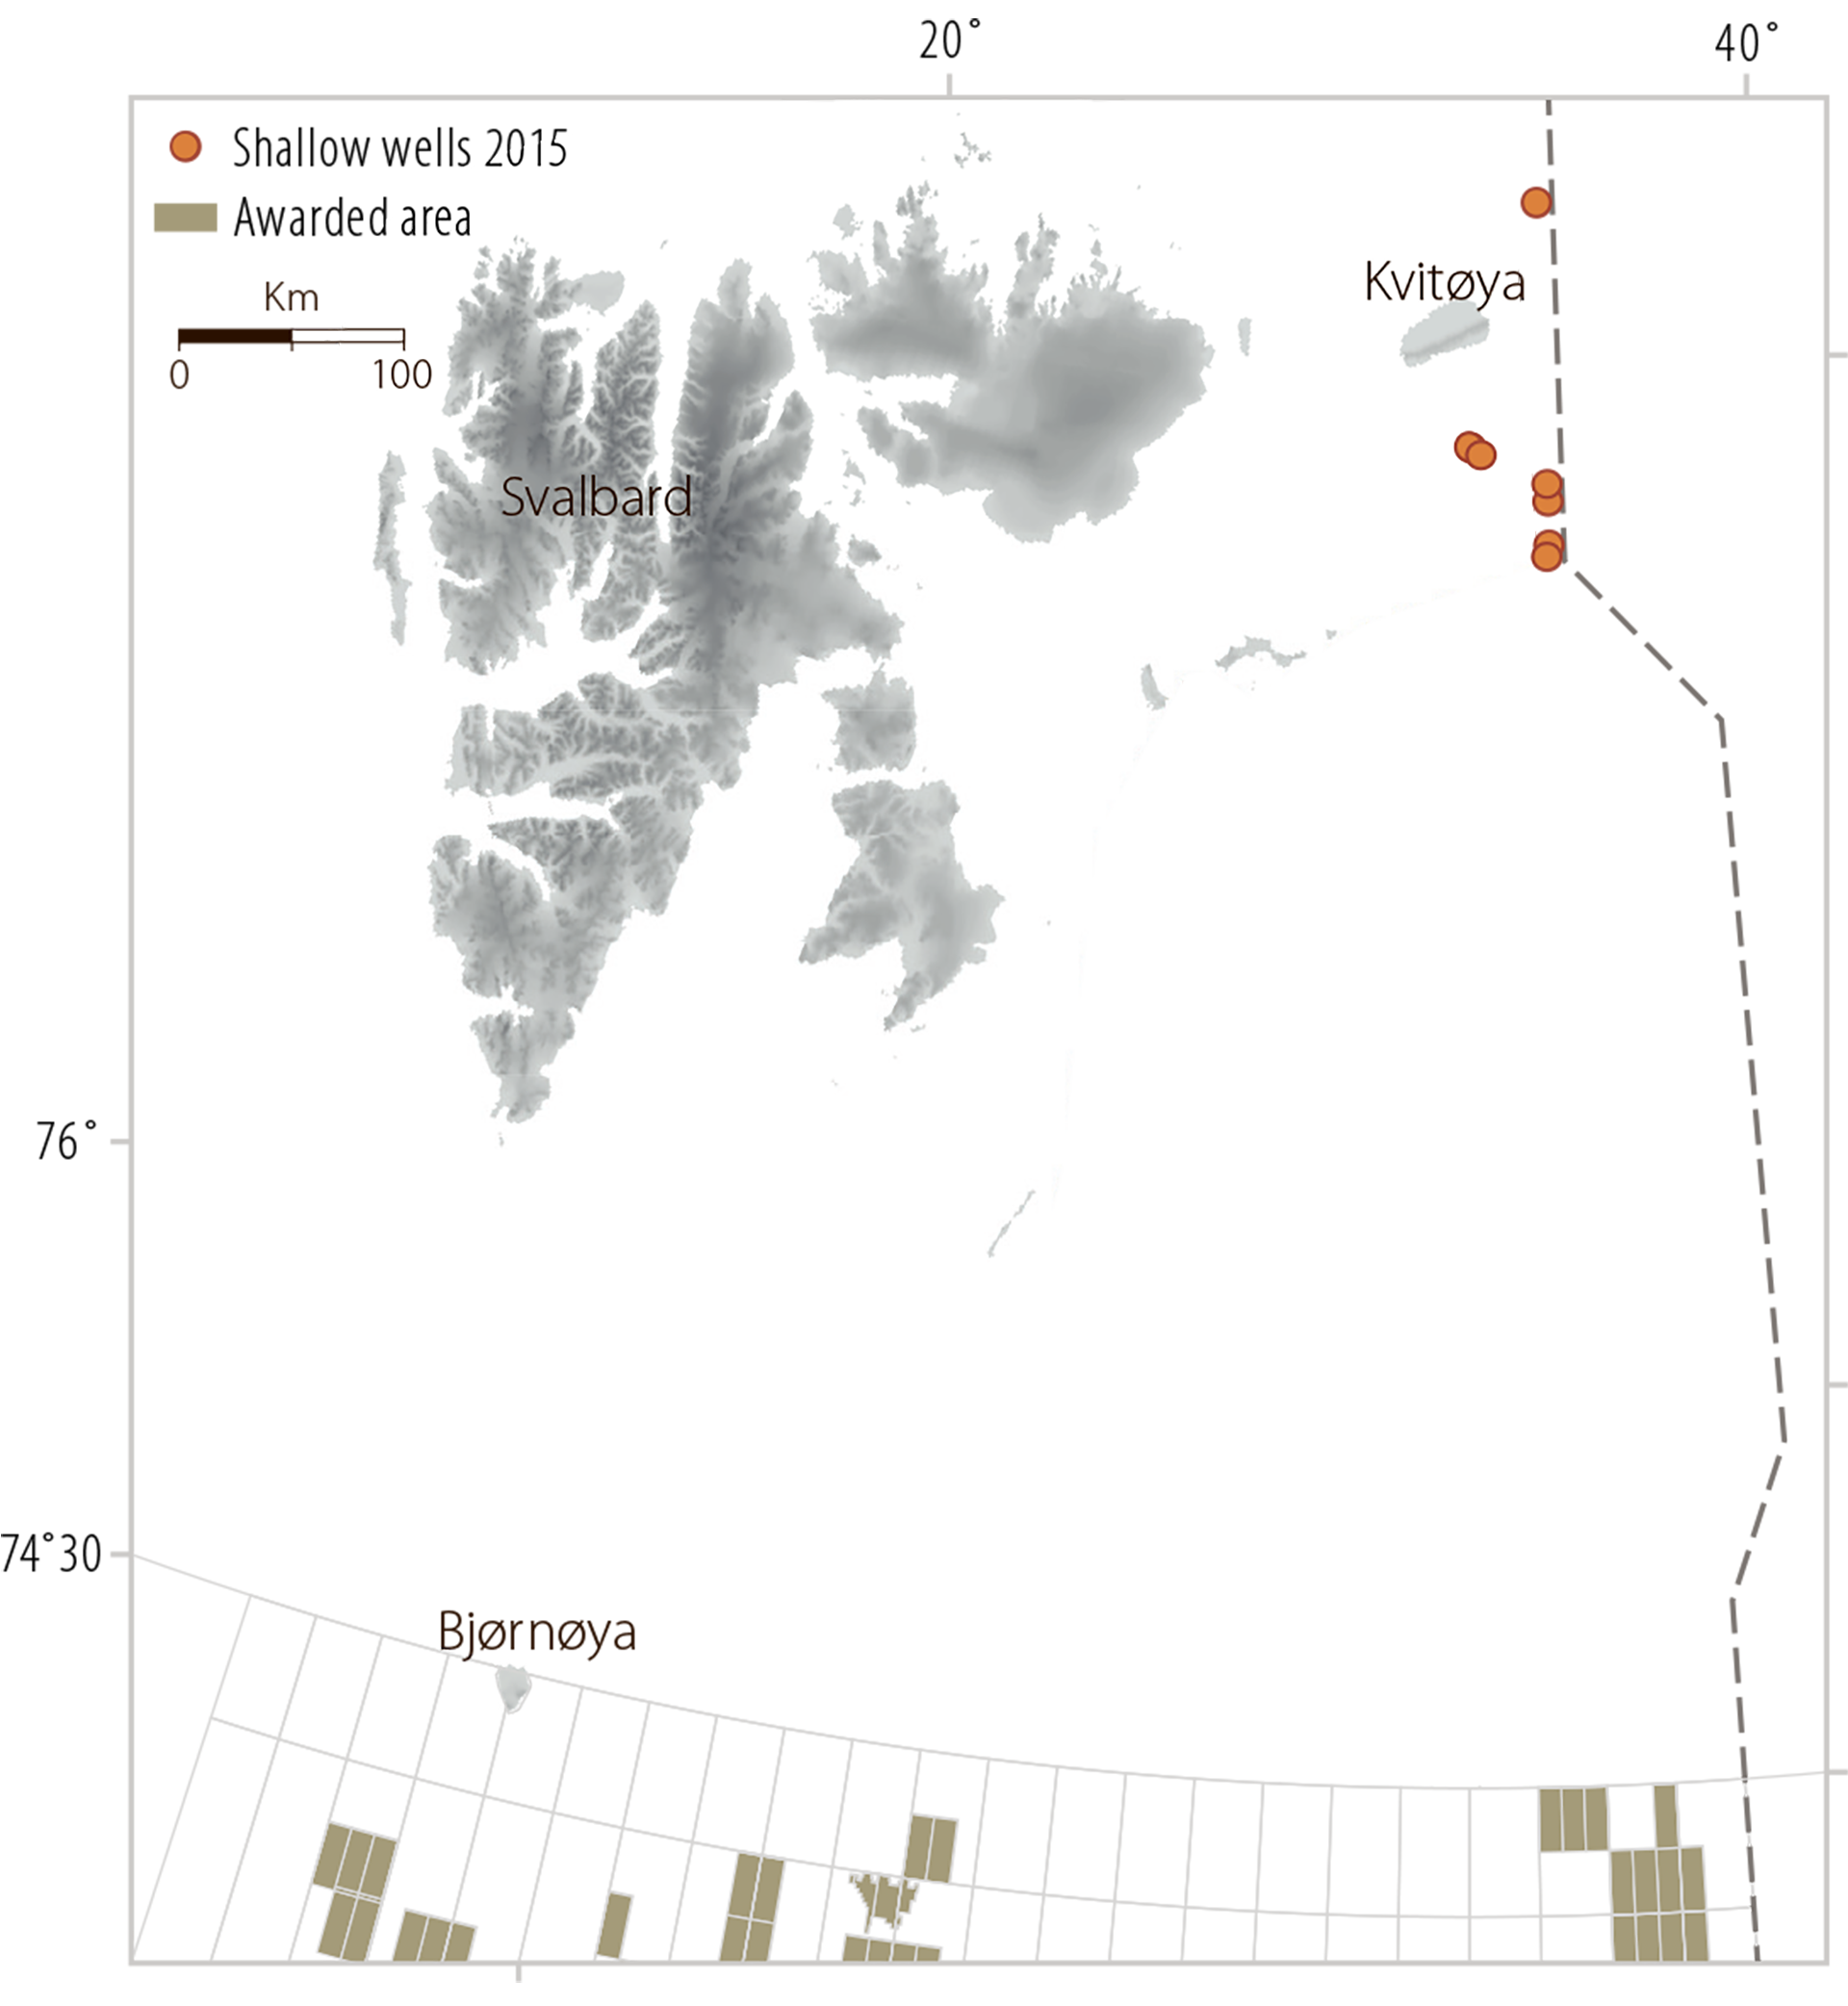
Shallow drilling is used to acquire data on the sedimentary strata. Measuring five-seven centimetres in diameter, the cores acquired provide information on rocks types and sedimentary structures. They can also provide the basis for indicating the potential of the formations to act as source, reservoir or cap rock. These cores provide a good foundation for regional correlations and increased understanding of geological developments. The drilling depth of this type of well is limited to 200 metres beneath the seabed. Geological investigation of Barents Sea North began with the acquisition of 2D seismic data in the mid- 1970s. A need eventually arose to acquire geological samples to understand which rocks (reflectors) were giving the signals which appeared on the seismic maps. Knowledge about the age of the rocks was also important for understanding geological developments in Barents Sea North over time. A number of scientific shallow wells were drilled in the late 1980s to learn more about the geology of the area. Funds were appropriated over the government budget in 2015 for shallow drilling, and geological material was obtained from cores up to 200 metres long. The primary area for this acquisition was south and north of Kvitøya. The NPD drilled seven wells at locations chosen on the basis of 2D seismic data (figure 3.10). The aim was to take cores from lithostratigraphic boundaries which occur mainly at deep levels in the Barents Sea but which, for various geological reasons, are shallower in the area investigated. A total of 1 048 metres of geological material were recovered, and these cores have increased understanding of the geology in northern parts of the Barents Sea. Results from the six shallow wells south of Kvitøya showed that the oldest rocks are Carboniferous and Permian carbonates and shales. The boundary between Permian and Triassic is well preserved in the cores. Cores were taken from a dark Middle Triassic shale. A well north of Kvitøya found dolomites, which are likely to have been deposited in the Carboniferous. Cores from the seven wells have been subjected to detailed geochemical analyses. Rocks with a good to very good source potential are found in the six southernmost wells. Gas analyses also show that the area has a functioning source rock. Oil samples from well 7933/4-U-3 show a marine source rock, probably from the Triassic. See the 2016 resource report and Geological assessment of petroleum resources in eastern parts of Barents Sea North 2017 (NPD) for more information on the NPD’s acquisition of geological data and mapping in unopened areas of the NCS. |