New exploration technology and work processes
Better data, increased knowledge and innovative technology reduce risk and create value.
Finding oil and gas deposits is becoming increasingly difficult. Technological advances have provided better data and improved tools, contributing to new understanding of the geology and making it possible to identify new play and prospect concepts. That could help to reduce exploration risk and make further discoveries. The industry must exploit the possibilities offered by integrating geoscience expertise with digital technology to identify new resources.
Technological progress, improved mapping, more data and greater understanding of the geology can contribute to reducing exploration risk and making further discoveries. Technology development may also cut the cost of hunting for oil and gas, and thereby make more and smaller prospects interesting to explore. Both these considerations could help to expand the resource base on the Norwegian continental shelf (NCS).
The basis for discovering and developing oil and gas resources is created through work to understand the sub-surface, which draws primarily on the geosciences. These disciplines are making constant progress, supplemented by innovative technology and new work processes. Figure 6.1 provides an overview of the data acquired, generated or evaluated in order to take knowledge- based exploration decisions.
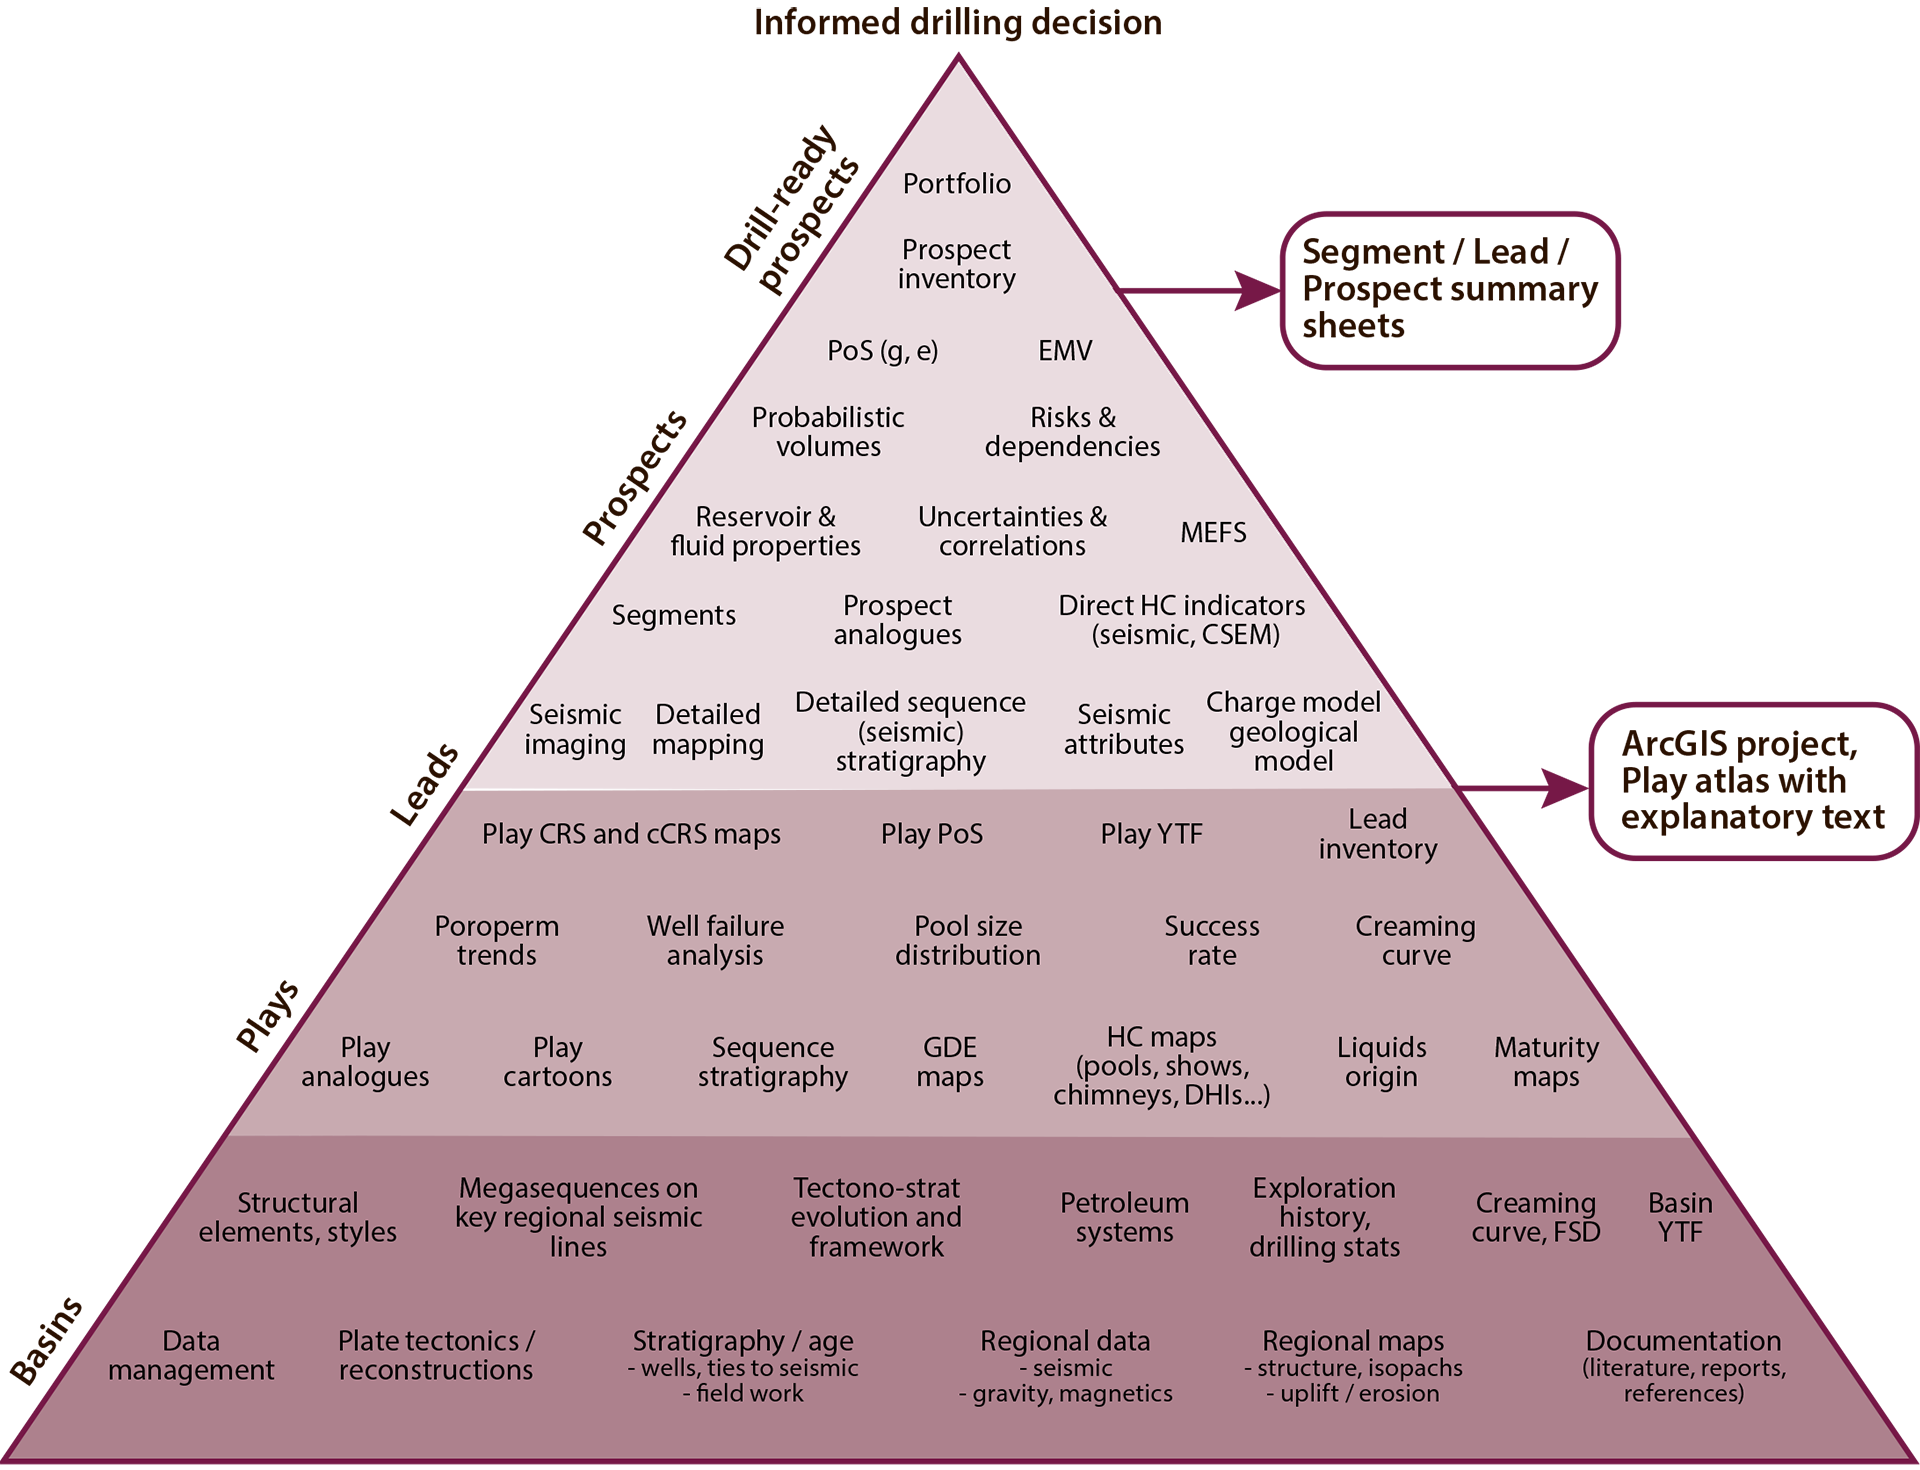
Figure 6.1
Illustration of the exploration process. Based on Milkov 11, 2015.
11 Milkov, A V (2015): Risk tables for less biased and more consistent estimation of probability of geological success (PoS) for segments with conventional oil and gas prospective resources. Earth-Science Reviews, vol. 150, pp. 453–476.
Exploration includes understanding where and how oil and gas form, migrate, become captured in traps and accumulate in sub-surface reservoirs. Good exploration decisions which lead to discoveries require technology and geophysical methods which deliver high-quality images of the sub-surface. Seismic data acquisition is crucial here, while electromagnetic methods and other technologies can serve as valuable supplements.
Advances in seismic data acquisition and processing have led to a marked improvement in sub-surface imaging during recent years. Combined with developments in the geosciences, this has equipped geologists and geophysicists to build good models of the subsurface and thereby identify new exploration opportunities. That can encourage increased drilling and yield more discoveries.
The development of the technical success rate shows that exploration has become steadily more effective (figure 6.2). This rate has remained high since the early 1990s. As discovery size declines, the gap between the technical and commercial success rates is tending to increase.

Figure 6.2
Development of technical and commercial success rates (averages at five-year intervals).
In order to improve understanding of how progress with technology and geological methods has contributed to efficient exploration, the NPD carried out a study in collaboration with consultant Westwood Global Energy Group. This identified a number of important areas within a wider exploration technology concept, such as data acquisition, geosciences and working methods. These have been and will continue to be important for exploration on the NCS. The NPD has grouped these under six main headings: (1) seismic data acquisition, imaging and analysis, (2) electromagnetic methods, (3) basin modelling, (4) drilling technology, (5) the human factor and (6) visualisation, Big Data and machine learning.
SEISMIC DATA ACQUISITION,
IMAGING AND ANALYSIS
SEISMIC DATA ACQUISITION
Seismic data (fact box 6.1) are used to map geological conditions beneath the seabed, and are fundamental in studying opportunities for finding petroleum. Virtually all decisions about exploration drilling today are based on three-dimensional (3D) seismic surveys.
FACT BOX 6.1:
|
|
Seismic (geophysical) survey data are acquired by transmitting sound waves from a source about five to 10 metres below the sea surface. These waves travel through the sub-surface strata and are reflected back to sensors located just under the sea surface, on the seabed or down a well. The data are then processed to form an image of the sub-surface geology. Seismic mapping of the NCS began in 1962. Various types of seismic surveys are conducted:2D seismic data are acquired with a single hydrophone streamer. This yields a two-dimensional seismic line/ cross-section of the sub-surface. 3D seismic data are acquired using several streamers to provide a three-dimensional and detailed image of the sub-surface. Broadband seismic surveying is a technology which utilises a broader spectrum of frequencies than conventional methods. The very low frequencies, in particular, provide a much clearer image of sub-surface structures. Combined with seismic data processing, this method can supply more detailed information with a sharper resolution and improved depiction of the sub-surface. |
At 31 December 2016, 1 600 000 common depth point (CDP) kilometres of two-dimensional (2D) seismic data had been acquired on the NCS (figure 6.3). Such acquisition has declined significantly in recent years.

Figure 6.3
Acquisition of 2D seismic data on the NCS.
The first commercial 3D seismic surveys on the NCS were conducted in the late 1970s. Discovery well 30/6- 17 near the Oseberg field in 1985 was the first wildcat drilled on the basis of 3D data.
The scope of acquired 3D seismic data varied little in 1994-2006, but increased substantially between 2007- 08 and 2014 (figure 6.4).

Figure 6.4
Acquisition of 3D seismic data on the NCS.
IMPROVED IMAGING
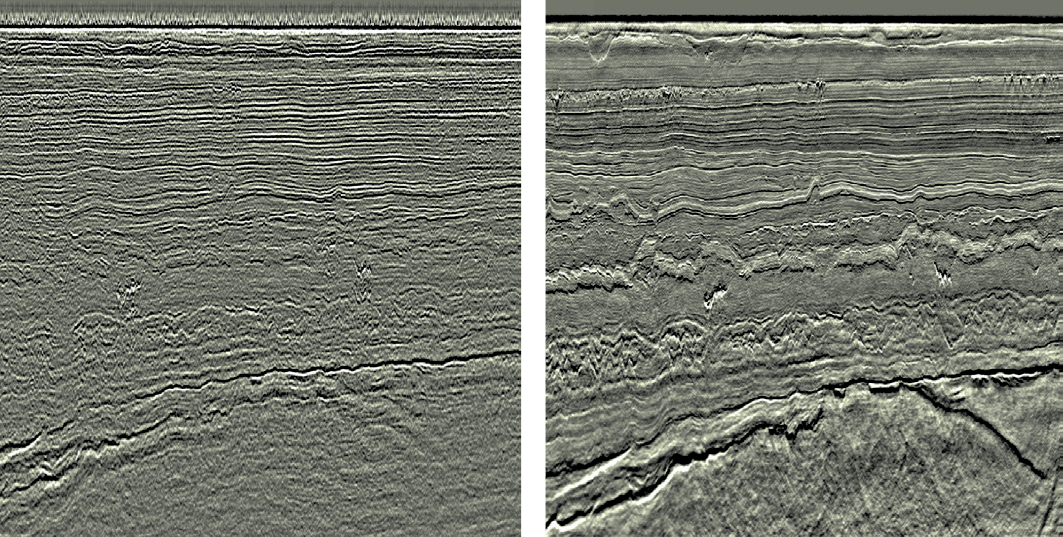
Seismic data quality has gradually improved in recent years (figure 6.5). Advances have occurred in both survey methods and data processing. The biggest technological leap since 2000 has been the development and implementation of broadband seismic surveying (fact box 6.1). Substantial improvements have also been made to processing algorithms, especially with regard to 3D migration. This has made images sharper and positioning more exact, particularly in areas with complex geology.

Figure 6.5
An example of the improvement in seismic data quality between 2007 (left) and 2013 (right). From the Edvard Grieg field.
Images: WesternGeco
Large parts of the NCS, especially the mature areas of the North and Norwegian Seas, have been covered by broadband 3D seismic surveys in recent years. Combined with increased computing power and new interpretation and visualisation tools, this has made it possible to identify new exploration opportunities – even in areas already investigated.
Many of these opportunities are located close to existing infrastructure and can represent substantial value through rapid phasing-in. Resources around today’s fields must be identified while infrastructure is still in place. New seismic data and approaches could also extend the producing life of old fields and lay the basis for decisions on developing stranded discoveries.
The application of broadband technology will probably increase in scope. Developing improved algorithms for processing seismic data is expected to continue, and allow the industry to achieve better results by reprocessing existing data sets.
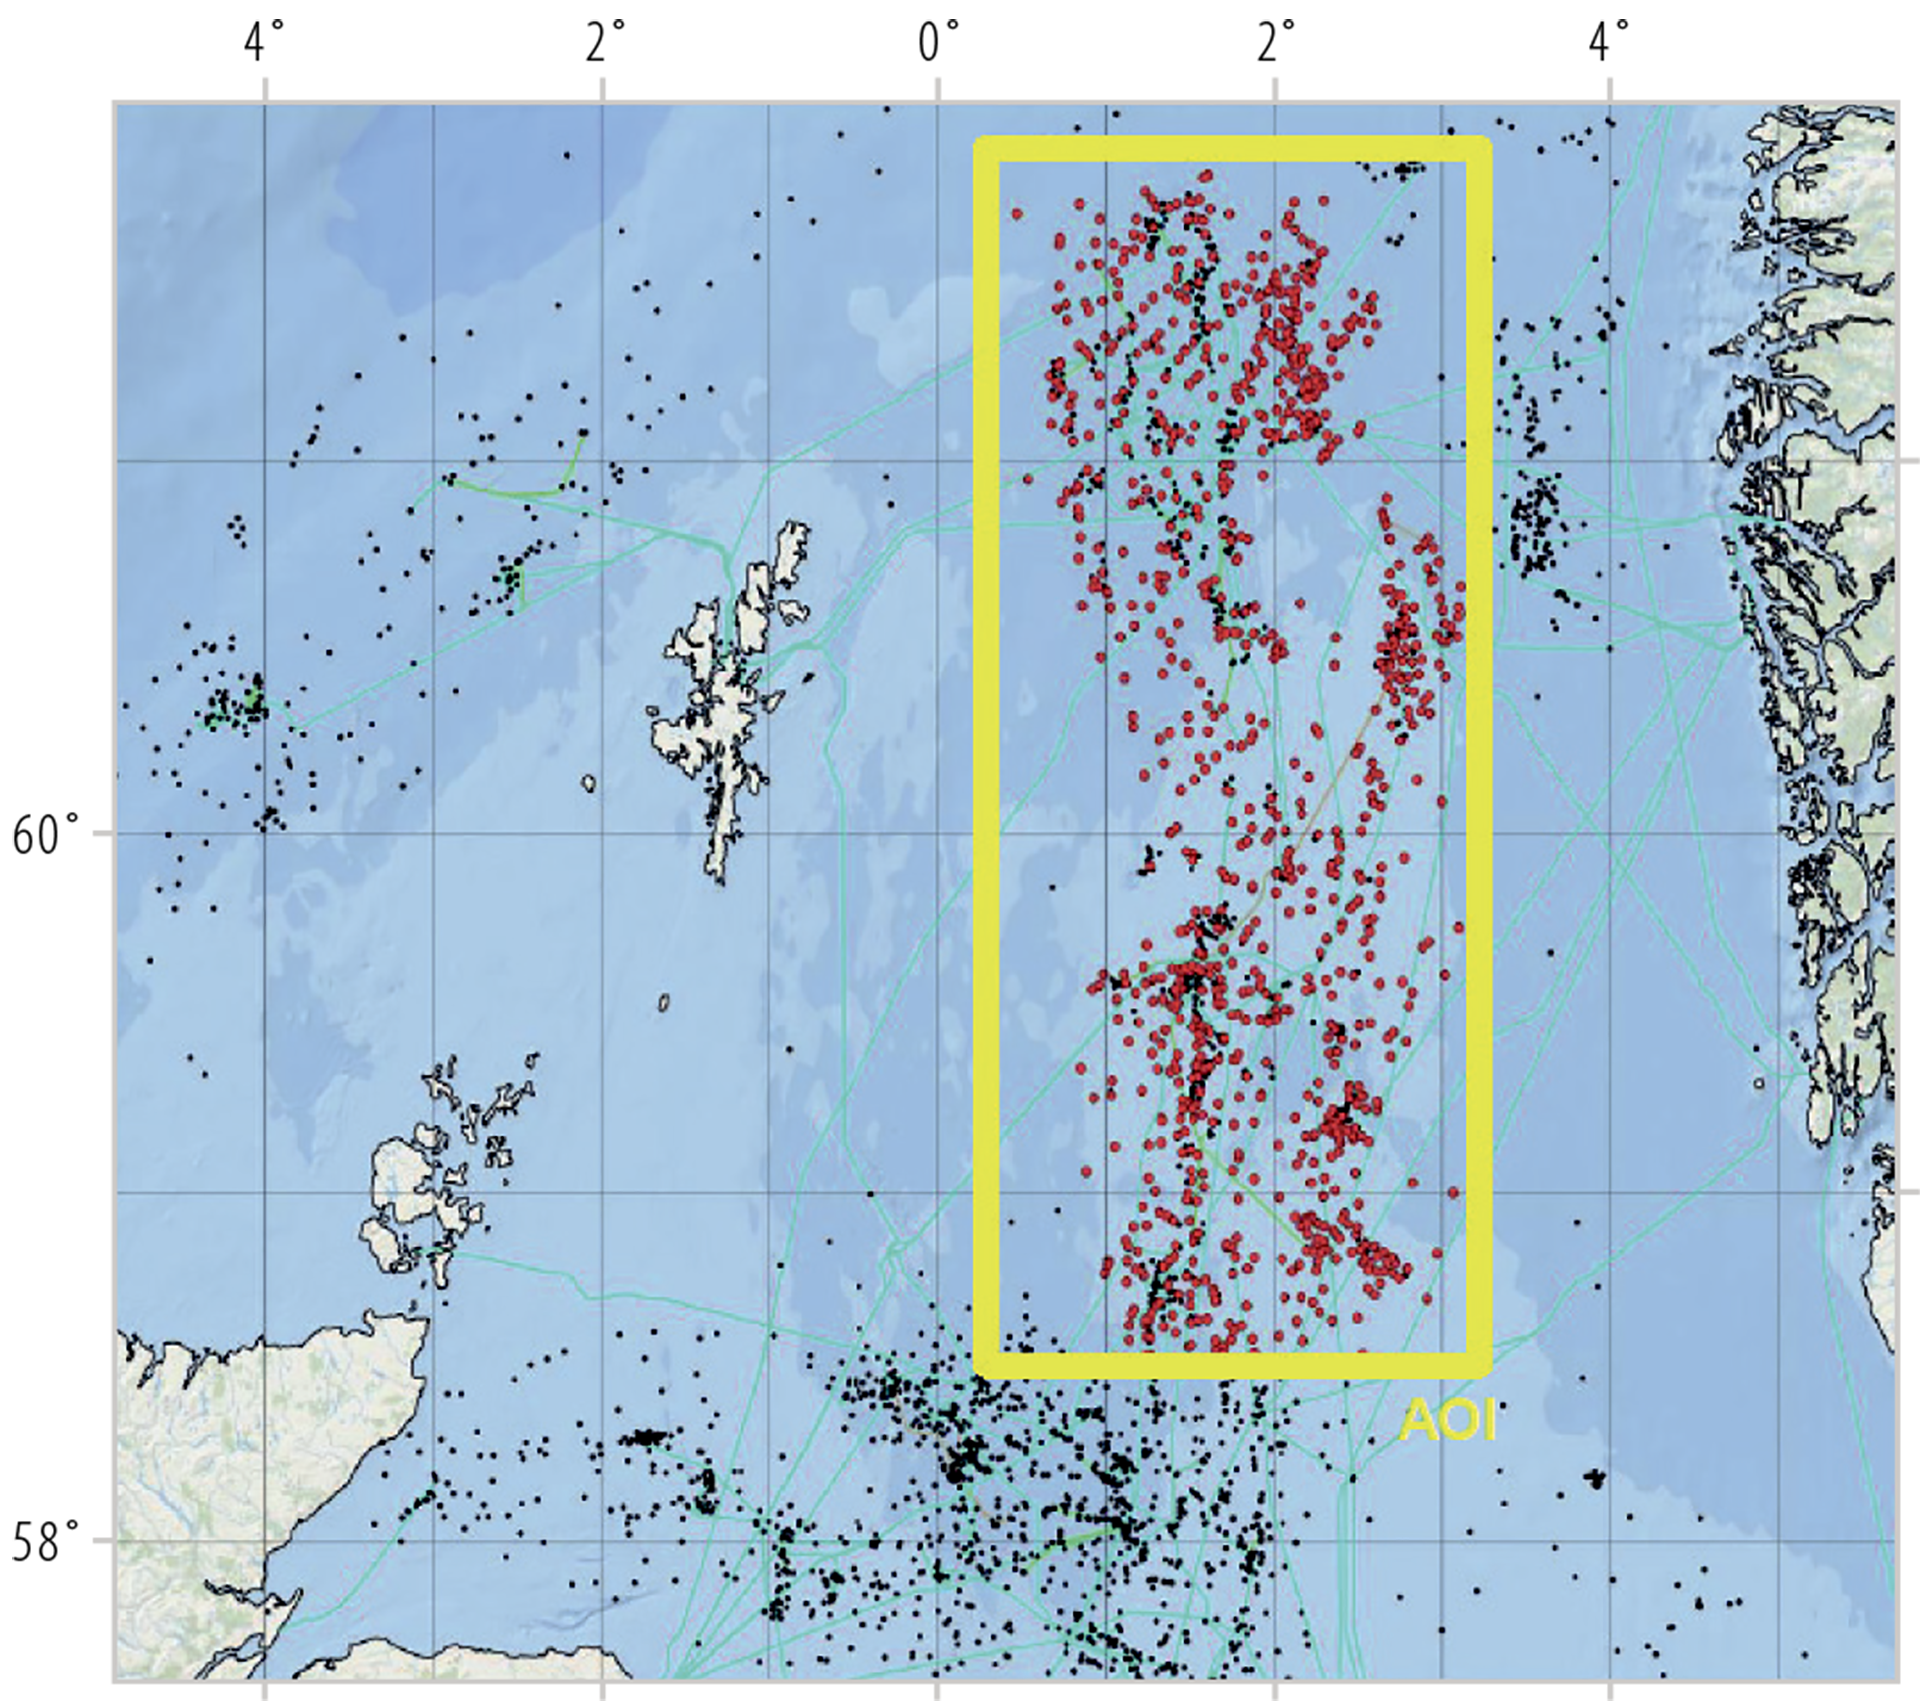
Improved seismic imaging combined with better seismic data analysis could also help to identify more stratigraphic traps. Great interest has been shown in recent years in injectites, one type of such formations. Examples include the 24/9-5 Volund, 25/4-10 S (Viper) and 25/7-5 Kobra discoveries. Prospects with stratigraphic trap types have been less explored on the NCS than on the more mature UK continental shelf (figure 6.6). The British success rate in this kind of prospect has also been higher. That might indicate a potential on the NCS which has yet to be realised, and exchanging experience between the UK continental shelf and the NCS could be important.

Figure 6.6
Trap types and commercial success rates in Norway and the UK, 2008-17.
Source: Westwood
SEISMIC DATA ANALYSIS
The increased scope of acquired seismic data and improvements to its quality since 1990 have contributed to the development of new and better analysis tools and methods. These have resulted in big advances in quantitative seismic data analysis. Increased computing power has also made the calculations substantially faster and more detailed.
That has opened the way to more advanced analysis techniques for seismic data, particularly with amplitude versus offset (AVO) and seismic inversion procedures.
According to Westwood, it appears that the industry often fails to exploit all the opportunities offered by integrating seismic data analysis with geological knowledge and experience. These methods need to become better integrated in the geological evaluation process (figure 6.1).
Greater integration means that people with different technical specialisations must collaborate in new ways and much more closely than before. The technology and methods represent useful and advanced tools. Combining the technology with geological experience and knowledge boosts the probability of making the big discoveries.
ELECTROMAGNETIC METHODS
The controlled source electromagnetic (CSEM) method was introduced and commercialised soon after 2000. This approach allows electrical resistance in rocks and wells to be measured and compared. High electrical resistance could, for instance, indicate the presence of hydrocarbons. The challenge is that other components in the sub-surface can give a similar response in a number of areas. Salt and rocks with a substantial organic content, for example, offer high resistance and can give a “false” response. The accuracy of this method is therefore a bit variable, and good calibration with existing fields and discoveries could be crucial in improving it (figure 6.7).
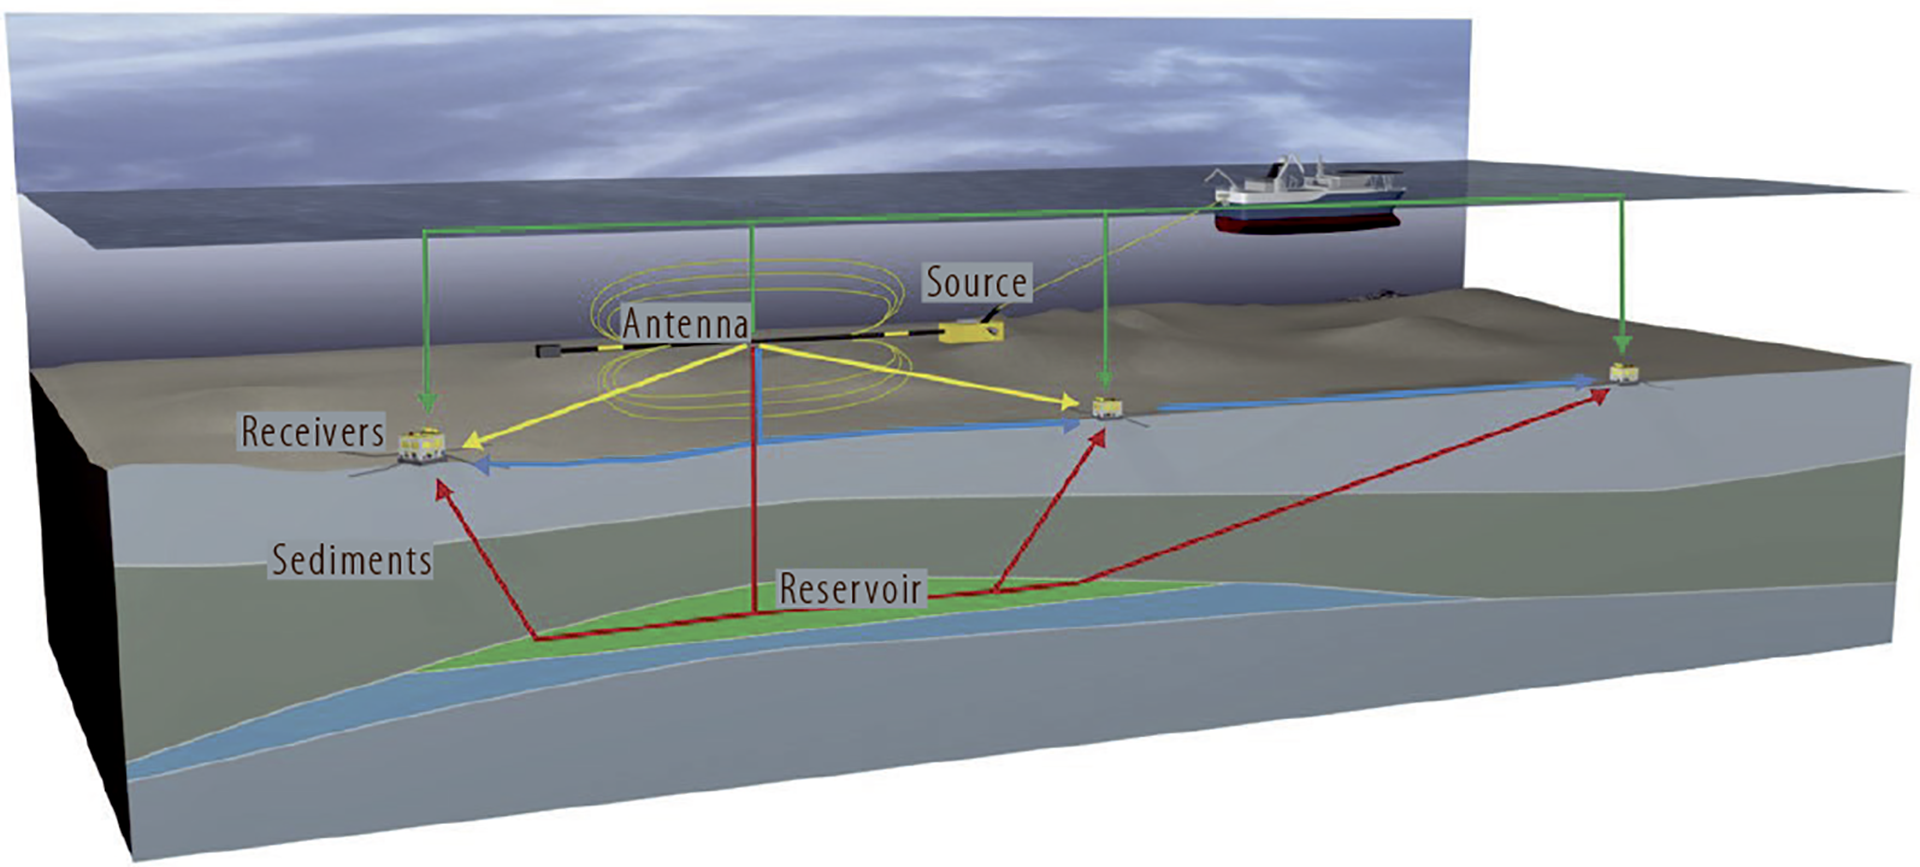
Figure 6.7
Electromagnetic methods.
Artist’s impression: EMGS
Since the introduction of electromagnetic (EM) methods, lack of accuracy at times has meant that part of the industry is sceptical about their benefits.
Data acquired in this way have demonstrated good accuracy in parts of the Barents Sea, particularly where the reservoirs are at shallow depths. The 7324/8-1 (Wisting) discovery lies just 250 metres beneath the seabed, which is ideal for measuring EM response. Such data have been useful in this area.
The technology has been further developed in recent years with the use of 3D acquisition, improved inversion techniques and more powerful sources which can reach deeper reservoirs. CSEM is expected to become more widely used both on the NCS and internationally.
BASIN MODELLING
A substantial increase has occurred in calculation capacity for 3D basin modelling (figure 6.8).
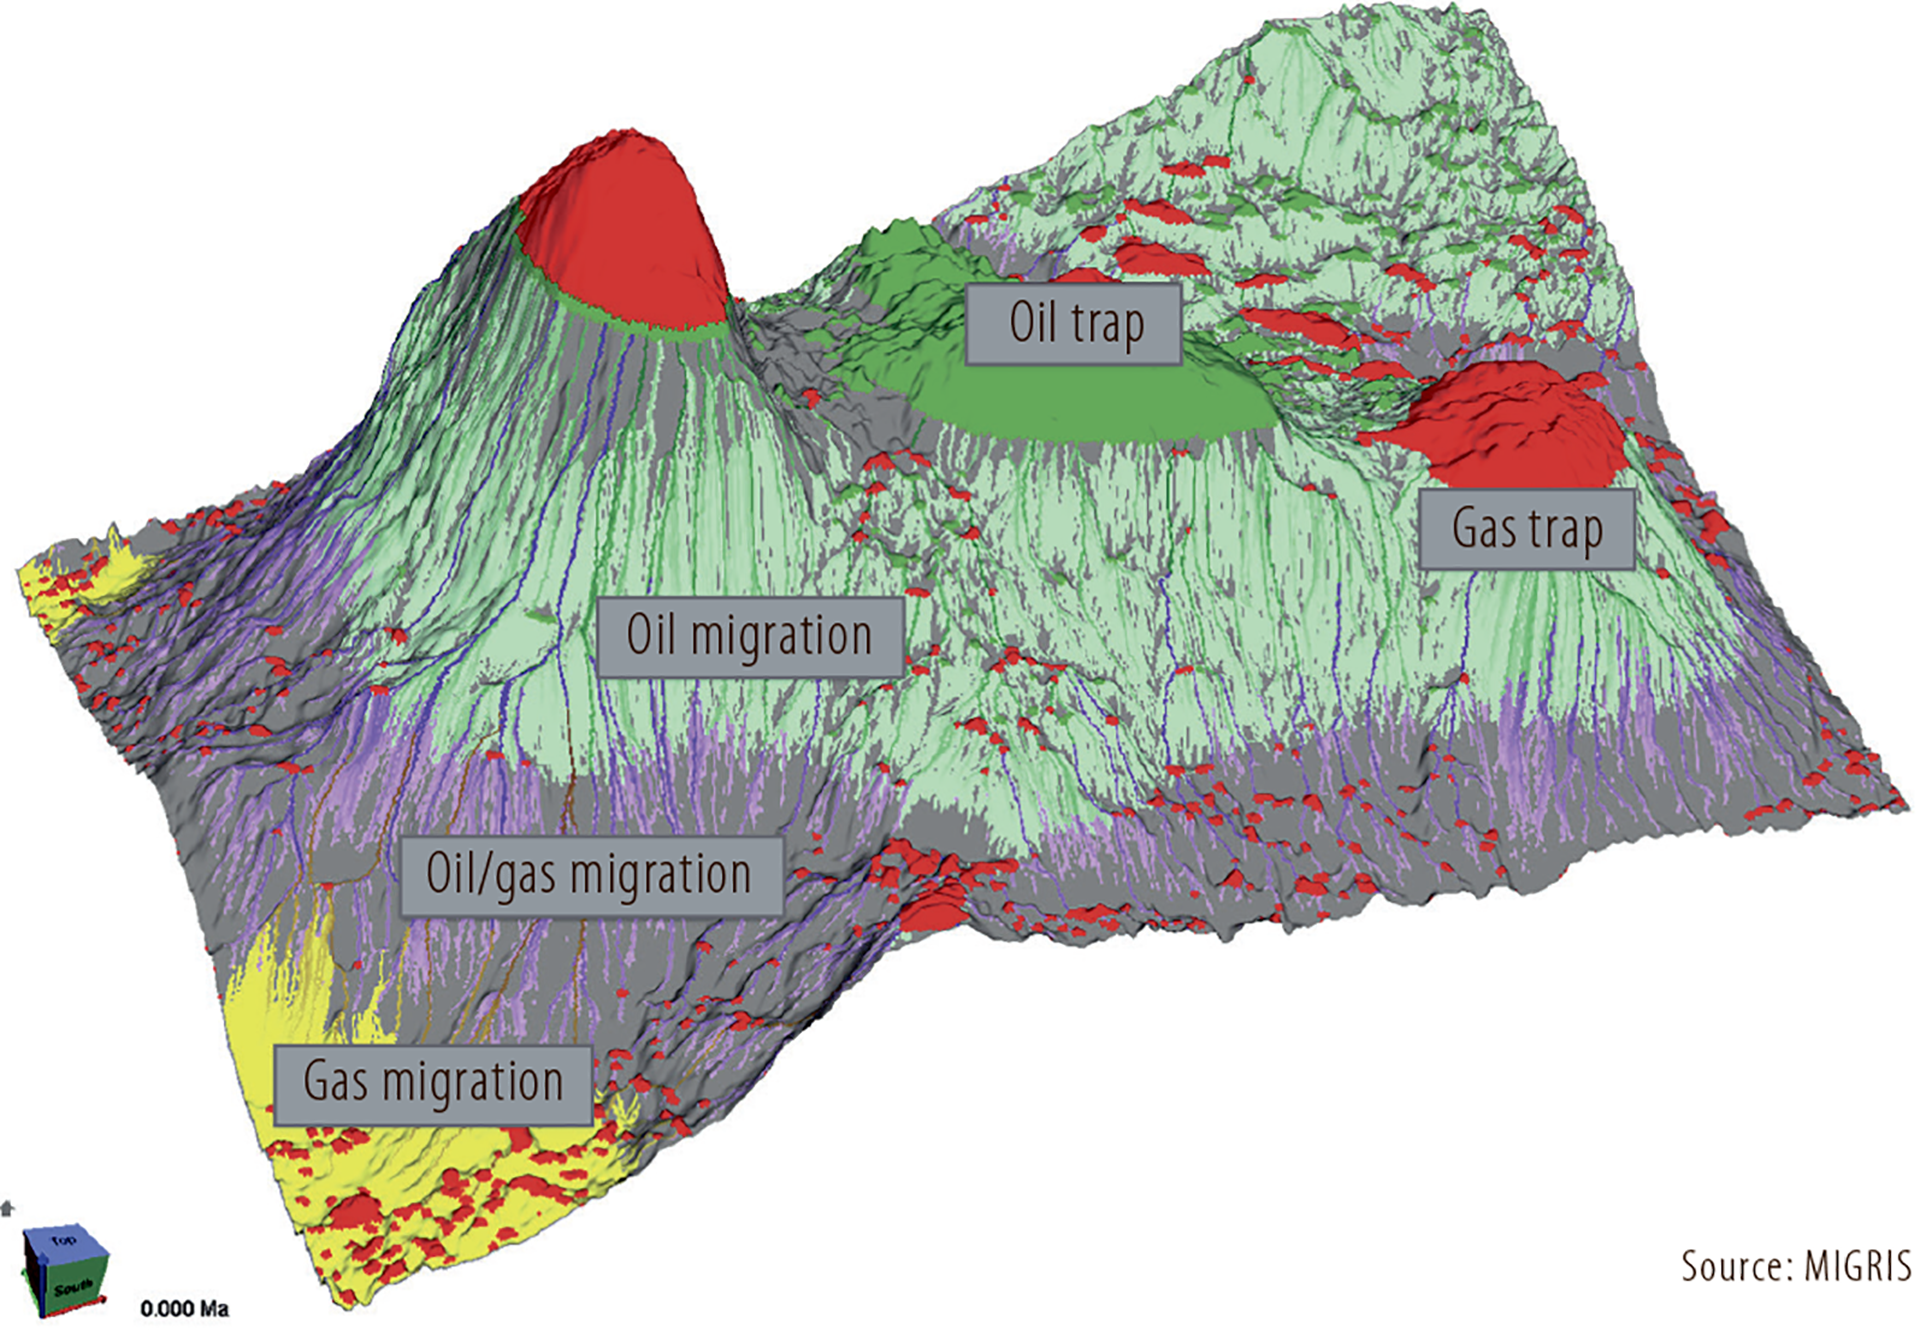
Figure 6.8
Visualisation of 3D basin modelling.
The ability to measure geochemical parameters has made great strides. That includes gas analyses during drilling, more detailed measurement of biomarkers and the implementation of kerogen analyses with the aid of scanning electron microscopy (SEM). Greater computing power and large data volumes will probably contribute to developing and improving the opportunities offered by 3D basin modelling. In geochemistry, new methods of analysing gas in drilling fluids will be important for improved understanding of hydrocarbon migration.
Increased availability of high-quality seismic data from certain basins in other parts of the world has enhanced understanding of sedimentary sub-surface systems. This insight and knowledge are being applied on the NCS, particularly in connection with plays in deepwater areas.
DRILLING TECHNOLOGY
Technological advances mean that neither water depth nor pressure present obstacles to safe drilling of exploration wells.
These are now being drilled in other parts of the world in waters up to 4 000 metres deep. Wildcat 6403/6-1 in the Norwegian Sea currently holds the water-depth record on the NCS. It was drilled for Statoil in 1 721 metres of water during 2006 by the Eirik Raude rig.
Today’s drilling technology and blowout preventers (BOPs) make it possible to drill high pressure, high temperature (HPHT) wells12 with pressures as high as 1 050 bar.
12 Defined as wells with a pressure above 690 bar and/or a bottomhole temperature of 150°C.
Another technology, highly deviated drilling, is now standard practice in field development and makes it possible to investigate exploration targets from existing infrastructure and to tie back possible discoveries for swift production.
Several discoveries have been made only about 200 metres beneath the seabed in recent years. The bestknown example is 7324/8-1 (Wisting) in the Barents Sea, which was drilled 250 metres beneath the seabed. Until operator OMV completed a successful highly deviated well in 2017, doubts were expressed about whether a field development could be based on horizontal wells in such shallow reservoirs (figure 6.9).
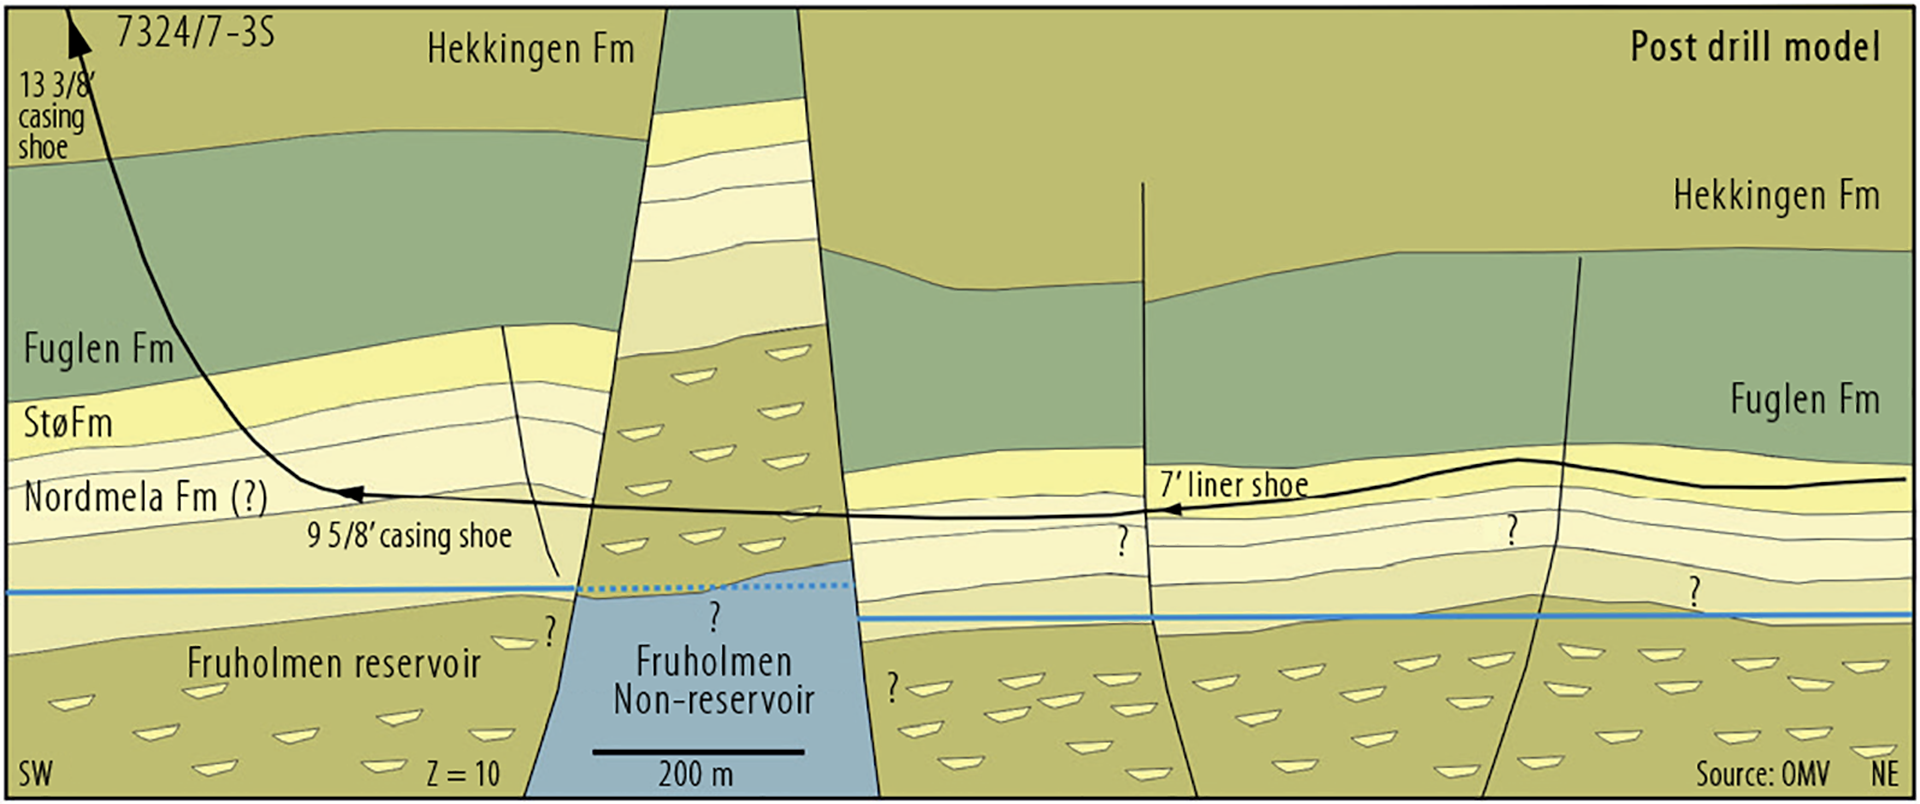
Figure 6.9
Highly deviated drilling on the 7324/8-1 (Wisting) oil discovery.
Appraisal well 7324/7-3 S.
THE HUMAN FACTOR
Studies conducted by government regulators such as the NPD and the UK’s Oil and Gas Authority (OGA) show that oil companies overestimate the volume in prospects, both in their licensing-round applications and when taking drilling decisions. The uncertainty range for these estimates is also often too small.
The oil companies also have a tendency to underestimate the probability of success. Taken together, these factors yield more but smaller discoveries than prognosed. Many oil companies have conducted studies drawing on their own data to publish similar conclusions, often based on global data sets. The issue is not new, and was described in the NPD’s resource report as early as 1997 (chapter 7).
The reasons for this problem are complex, but probably relate more to psychology than to geological knowledge, methodology, software and data. Nor is the issue unique to prospect evaluation. It can arise in all circumstances where people take decisions or make prognoses based on their own assessment of available information. Psychologists Daniel Kahneman and Amos Tversky wrote several articles on the subject in the 1970s and 1980s. They came up with a number of examples of cognitive bias, which results from the way people assess information. Many other types of bias than those described by Kahneman and Tversky have since been identified.
Before biases can be eliminated, they must be recognised and an understanding established of why and how they arise. Many companies are working systematically today to check their estimates against the actual results. Most of them also have various groups for peer assistance in the evaluation phase and quality assurance teams with experienced personnel who assess evaluations across the company. In addition, many provide systematic training on prospect evaluation – including how to avoid estimate bias.
Historically, the companies have perhaps paid greater attention to ranking their prospects on the basis of criteria other than the absolutely unbiased volumes and the probabilities of success. Exploration on the NCS has nevertheless been and remains profitable. However, ensuring that assessments represent unbiased estimates will be increasingly important as the NCS becomes more mature and discoveries get smaller, in order to avoid decisions to drill in unprofitable prospects.
VISUALISATION, BIG DATA AND MACHINE LEARNING
The earliest seismic interpretation and work stations became available in the mid-1980s. They were developed by research institutions or as proprietary software in big oil companies. From the mid-1990s, computer technology and work stations became better tailored to interpreting large quantities of 3D seismic data. Desktop 3D visualisation of seismic, geological and well-related data became possible from the 1990s, but was first effective after 2000. Since then, functionality has steadily improved.
Visualisation of sub-surface data via virtual reality (VR) systems is making continuous progress – so that geological field trips, for example, can now be conducted in this way. Cloud-based solutions accessible from anywhere in the world will eventually become more important. Sub-surface data from various disciplines can now often be integrated on a common platform.
Big Data, machine learning and artificial intelligence (AI) became part of the exploration industry’s vocabulary around 2012. Sub-surface data from seismic surveys and wells contain huge quantities of information, and Big Data analyses could conceivably extract even more information from this. The industry is now trying to understand how that could affect exploration. Many companies have launched major digitalisation projects. In addition, a number of measures have been initiated by such bodies as the NPD, the UK’s OGA and the Oil and Gas Technology Centre (OGTC) in Aberdeen. The aim is to understand how Big Data and machine learning can contribute to better and more efficient exploration (fact box 6.2).
Seismic and well information from the NCS is readily available through Norway’s Diskos data repository, and much of this material has been made publicly available. The quantity of data in Diskos has grown exponentially since 2010 (figure 6.10). A number of discoveries have been made by re-evaluating available historical data with new techniques and technologies, and by collating them in new ways. Big Data analyses may provide fresh insights here. Much of the data are difficult to access for analysis today because they are stored in varying formats on different media (such as scanned paper documents). Efforts are now being made in Diskos to improve the organisation of data, so they can become easier to use in such analyses.

Figure 6.10
Development of data quantities held in Diskos.
FACT BOX 6.2:
|
|
Great quantities of well data have been collected for more than 50 years in the North Sea, and this material contains information which could lead to new discoveries. The drawback is that the data are in different formats, vary in quality and can be time-consuming to process for use in analyses. Aberdeen’s OGTC is convinced that advanced algorithms, such as machine learning, can help to reduce this challenge. Together with Britain’s OGA and the NPD, it has therefore launched a project to seek analysis methods which can quickly and accurately deliver assessments of structured and unstructured well data. The aim is to use this information to identify and classify intervals which could indicate the presence of previously undiscovered or unnoticed petroleum deposits. This project has been established as part of the OGTC’s open innovation programme. It is directed at commercial organisations, academic institutions, innovators and entrepreneurs inside and outside the oil and gas industry who might have ideas on how to overcome these challenges. Large quantities of well data from the northern North Sea will be made available by the NPD, the OGA and the OGTC to those presenting the best proposals. The project will be implemented during 2018.
Figure 6.11
|