Player picture in the exploration phase
A broad variety of companies creates competition, which promotes efficiency and value creation in the exploration phase.
A broad variety of players creates competition and different play and prospect concepts, which promote efficiency and value creation. Even though the number of players has declined somewhat since 2013, diversity remains high in the exploration phase. Through a combination of active and experienced large and medium-sized companies, focused exploration companies and new company creations for both exploration and production, the conditions are in place to continue efficiently exploring the resource potential on the Norwegian continental shelf (NCS).
Ss the NCS has become a more mature petroleum province, facilitating a player picture which ensures efficient exploration, development of discoveries and good resource management have been important for the government.
A broad variety of players creates competition, which promotes exploration efficiency. It also ensures a greater diversity of ideas and interest in different play and prospect concepts, and the adoption of alternative technologies and working methods.
DEVELOPMENT OF THE PLAYER PICTURE
Exploration was initially dominated by a limited number of players, primarily large Norwegian and international companies.9 The number and variety of these players has increased from the mid-2000s, partly as a result of purposeful measures to create greater diversity (figure 5.1 and table 5.1). These included prequalification of new operators and licensees in 2000, the awards in predefined areas (APA) scheme in 2003 and the reimbursement system for exploration costs in 2005.
9 This report uses the term “players” for licensees (operators and partners) in production licences.

Figure 5.1
Companies on the NCS, 2000-17.

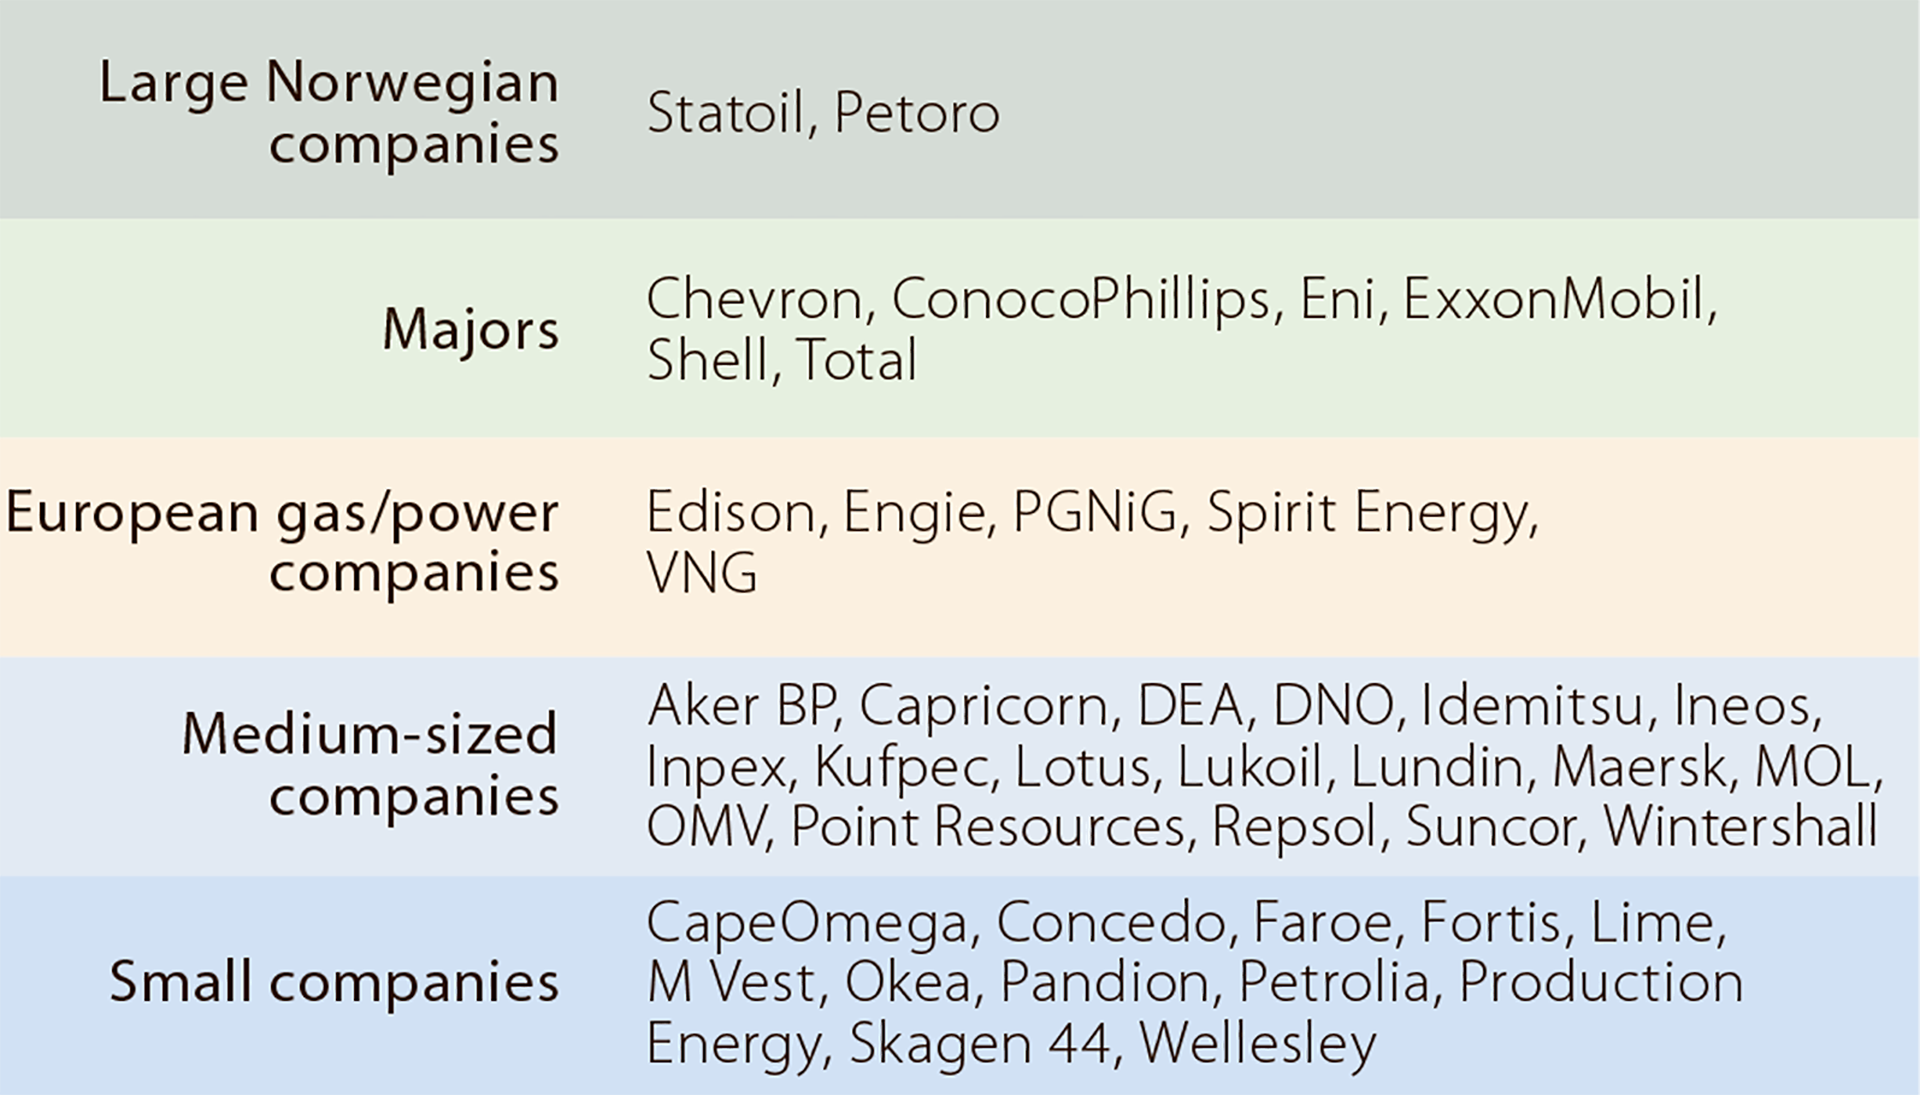
Table 5.1
Licensees at 31 December 2017 by company category.
CHANGING OF THE GUARD?
The position in the industry over the past three years, with falling oil prices, declining exploration and low resource growth, has led to changes in the number of players. While 56 companies had interests in production licences on the NCS in 2013, that number had declined in the wake of the 2014 oil price fall to 43 in 2017 (figure 5.2).

Figure 5.2
Changes to the player picture since 2013.
This reduction has been greatest for European gas/ power companies and small companies. Several of the European gas/power players have opted to withdraw from upstream activities in order to concentrate on the downstream sector and renewable energy. They have accordingly reduced or disposed of their interests. Dong (2017) and Engie (2018), for example, sold their oil and gas operations to medium-sized companies Ineos and Neptune respectively, while Centrica’s oil and gas business and Norwegian operations at Bayerngas have been merged to create Spirit Energy.
Among small companies, several have pulled out or been acquired by others. In addition, Pure E&P, Core Energy and Spike Exploration merged in 2016 to establish Point Resources.
Where medium-sized companies are concerned, America’s Hess sold its entire Norwegian business to Aker BP.
Of the majors, BP Norge merged with Det Norske Oljeselskap to establish Aker BP and Total acquired Maersk’s oil and gas business. ExxonMobil sold its interests in the Balder and Ringhorne Øst fields, which it had operated, to Point Resources in 2017. That left the company without operatorships for producing fields on the NCS. This sale promoted Point Resources into the medium-sized company category.
In recent years, enterprises financed by private equity (PE) companies or funds have made substantial acquisitions on the NCS and the UK continental shelf.10 Transaction activity in 2017 indicates that PE-financed companies have great faith in the NCS (figure 5.3). This category includes two medium-sized and five small companies.
10 PE is a collective term for a special type of fund/company which invests in unlisted enterprises. See Report no 7 (2008-2009) to the Storting on an innovative and sustainable Norway.

Figure 5.3
Farm-ins, farm-outs and swops of licence interests on the NCS in 2017.
Figure 5.3 also shows that the remaining small and medium-sized companies, European gas/power companies and majors are selling more interests than they acquire.
The majors have been important for developments on the NCS since the 1960s. Such enterprises accounted for the bulk of all exploration off Norway in the first 10-15 years. They had the expertise, capacity, financial strength and experience to develop a number of the initial fields, and contributed simultaneously to building up expertise in the Norwegian oil and gas industry.
These companies have drilled fewer exploration wells in recent years, and several have reduced their holdings through farm-outs. Reasons for this could include lack of exploration interest and success, a mature portfolio, optimisation of their international portfolios and a need to increase cash flow.
While some of the majors have reduced their operations, other players have been more active in the most recent licensing rounds. A number of them have thereby strengthened their position. That applies particularly to medium-sized companies making an active commitment to the NCS.
Exploration in 2018 is expected to increase slightly from the two preceding years. The continued combination of active and experienced large and mediumsized companies, more focused exploration companies and new company creations for both exploration and production means that diversity and competition can contribute to efficient exploration of the NCS.
EXPLORATION ACTIVITY BY COMPANY TYPE
The number of production licences has more than doubled since 2000 (figure 5.4). Medium-sized companies have seen the biggest increase in their holdings, and accounted together with large Norwegian companies for about 70 per cent of licence interests in 2017.

Figure 5.4
Production licences by company category in 2000-17.
Investment and wells drilled by companies provide some indication of how actively they participate in exploration.
In 2000-07, the biggest contributors to exploration – both as operators and licensees – were large Norwegian companies and majors (figures 5.5, 5.6 and 5.7). In line with the growth in player numbers, exploration increased substantially from 2007 and the player picture became more diversified. Since 2007, mediumsized and large Norwegian companies have been the most active explorers. European gas/power and small companies have also contributed, but had the biggest reduction in exploration activity over the past two-three years.

Figure 5.5
Wildcats spudded by company category (operators).

Figure 5.6
Wildcats spudded by company category (licensees).
Exploration investment correlates strongly with exploration wells drilled. The medium-sized companies and large Norwegian companies have therefore dominated the investment picture over the past decade (figure 5.7). Following the oil price slump in 2014, exploration investment fell substantially and was down to about a third of the peak 2013 level by 2017. The group of European gas/power companies accounted for the largest percentage decline.

Figure 5.7
Investment in exploration in 2000-17 by company category (licensees).
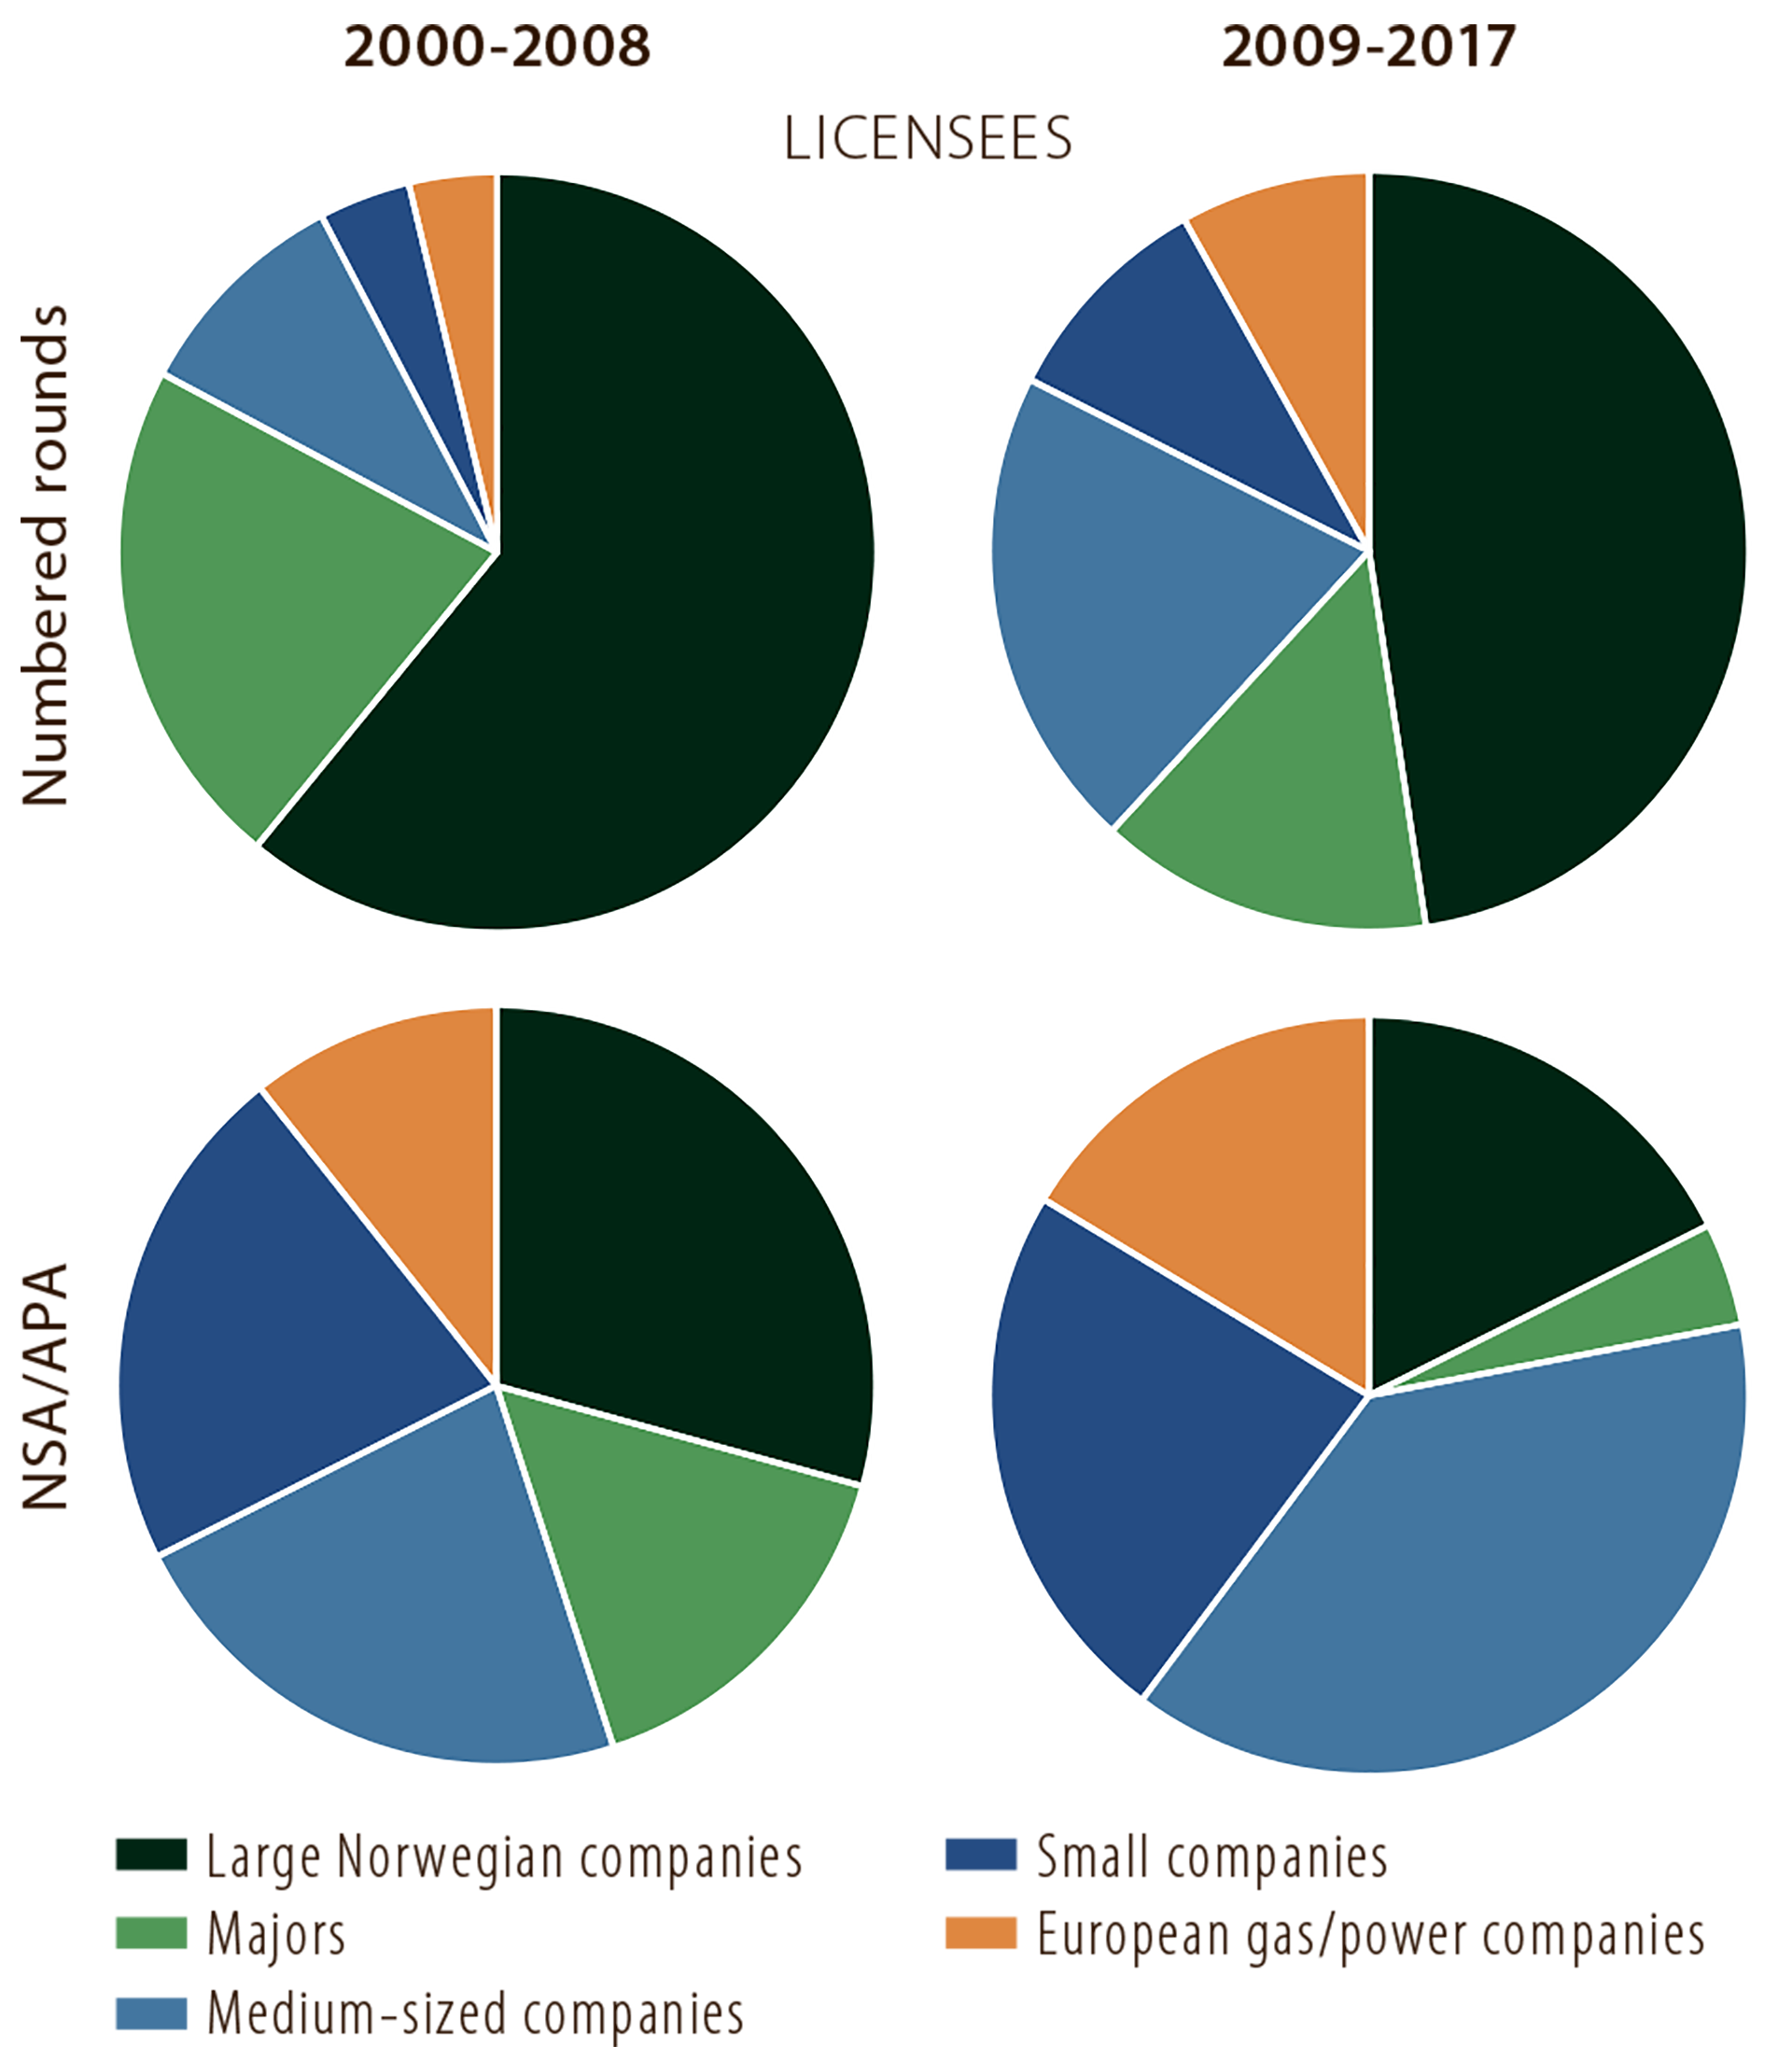
PLAYER PICTURE IN APA AND NUMBERED ROUNDS
The increase in both number and variety of participants has led to a more diversified player picture where exploration is concerned. Figure 5.8 shows greater diversity in drilling activity during 2009-17 than in 2000-08 for both APA and numbered rounds.

Figure 5.8
Proportion of wildcats drilled by company category (licensees) in licences awarded through numbered and APA rounds respectively in 2000-08 and 2009-17.
Large Norwegian companies and majors drilled the majority of the wildcats in production licences awarded in numbered rounds during the first of these periods. During the second, the largest proportion of wells was drilled by large Norwegian and medium-sized companies.
Where acreage awarded in APA rounds is concerned, large Norwegian companies and majors accounted for about 45 per cent of wildcats in 2000-08. That proportion was reduced to about 20 per cent in 2009-17, when medium-sized and small companies accounted for around 60 per cent of drilling activity in the APA area.
EXPLORATION RESULTS FOR THE PAST FIVE YEARS
Exploration results depend on a number of factors – prospectivity in the acreage awarded, where activity takes place, and its scope and quality. Figures 5.9-5.10 present the relationship between the number of wildcats and resource growth over the past five years.

Figure 5.9
Wildcats drilled in 2013-17 by company category (licensees).

Figure 5.10
Resource growth (excl resource class 6) in 2013- 17 by company category (licensees).
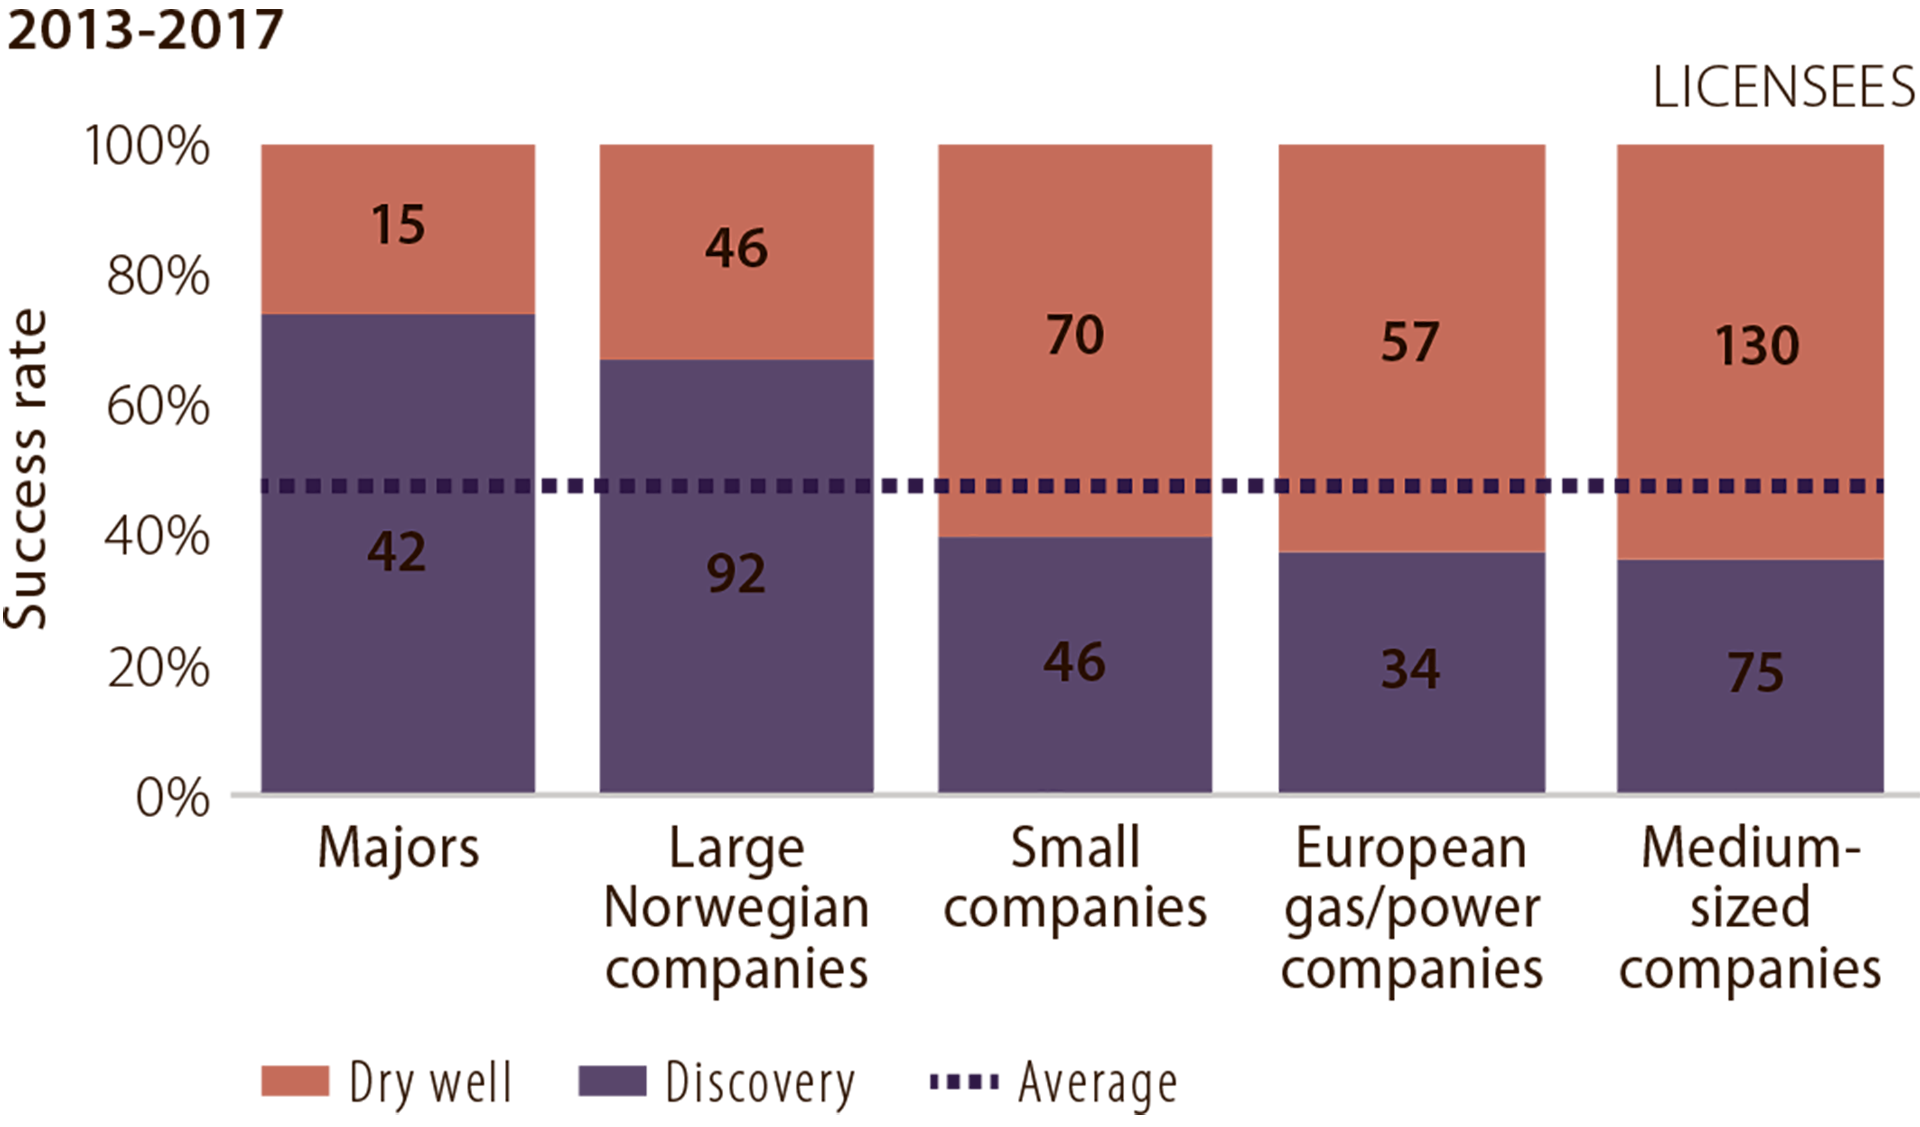
Medium-sized companies drilled most of the wildcats in 2013-17, and had the biggest resource growth. The growth in resources was greatest in the Barents Sea and included such discoveries as 7324/8-1 (Wisting), 7220/11-1 (Alta), 7120/1-3 (Gohta) and 7219/12-1 (Filicudi).
Medium-sized, large Norwegian and small companies showed relatively high resource growth per wildcat. Majors and European gas/power companies had the lowest resource growth and relatively low resource growth per wildcat. However, majors and large Norwegian companies had the highest success rates (figure 5.11).

Figure 5.11
Success rate in 2013-17 by company category (licensees).
LONG-TERM PERSPECTIVE
At 31 December 2017, large Norwegian companies and majors still had the biggest remaining reserves (resources in fields and discoveries sanctioned for production) on the NCS (figure 5.12). However, mediumsized companies strengthened their position and were the player category with the biggest growth in licences and the highest exploration activity in recent years. This yielded a number of finds and led to increases for both reserves and resources in discoveries still not sanctioned for development. Together with large Norwegian companies, this category accounts for almost 70 per cent of the resources in discoveries still not sanctioned for development.
