Check out our key figures in new visualisations!
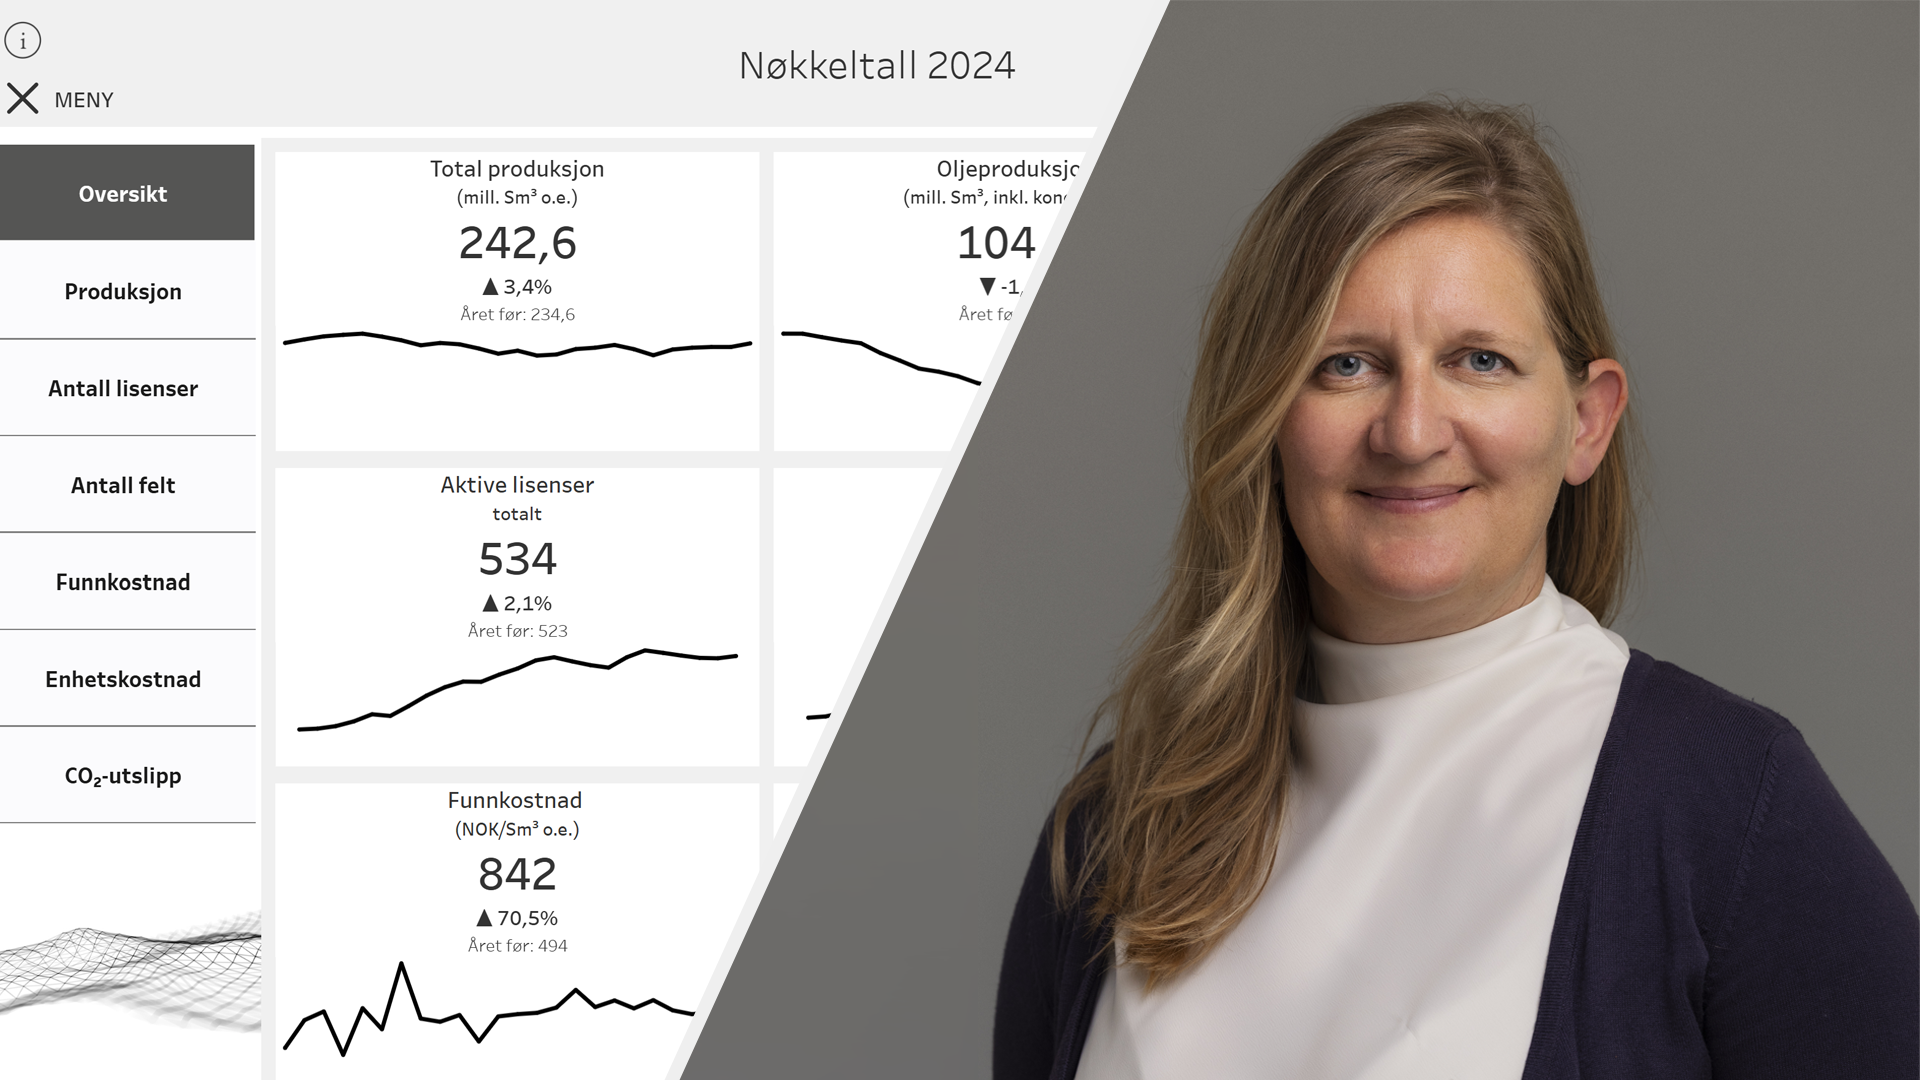
Nadine Mader-Kayser is Assistant Director for Analyses in the Norwegian Offshore Directorate.
6/27/2025 Now you have a quick and easy way to extract key figures associated with petroleum activities on the Norwegian continental shelf (NCS) in an interactive dashboard.
«Collecting, storing and sharing data is part of our social mission, and we've been at it since the beginning,» says Nadine Mader-Kayser, Assistant Director for Analyses in the Norwegian Offshore Directorate.
«The new visualisations mean that the data is even more 'at your fingertips', and they're easier to use. It'll also be easier to analyse trends, since you'll have a more comprehensive overview.»
This is the first dashboard to be made available. The figures are based on reports from the industry, and they are updated on an annual basis.
You'll be able to find visualisations that illustrate the status for 2024 and the development over time in
- Production
- Number of production licences and fields
- Discovery and unit cost
- CO2 emissions
Additional visualisations are scheduled for the not-too-distant future. The next stage will be a dashboard illustrating company and well statistics.
«The Norwegian Offshore Directorate's data, which is also available on FactPages, contributes to knowledge-based public administration, value creation and sustainable resource utilisation. They're frequently used by the industry, authorities, academia and others with an interest in activities on the shelf,» Mader-Kayser says.
Find the visualisation of the key figures here
See the key figures at FactPages
Updated: 6/27/2025