
Production figures August 2026
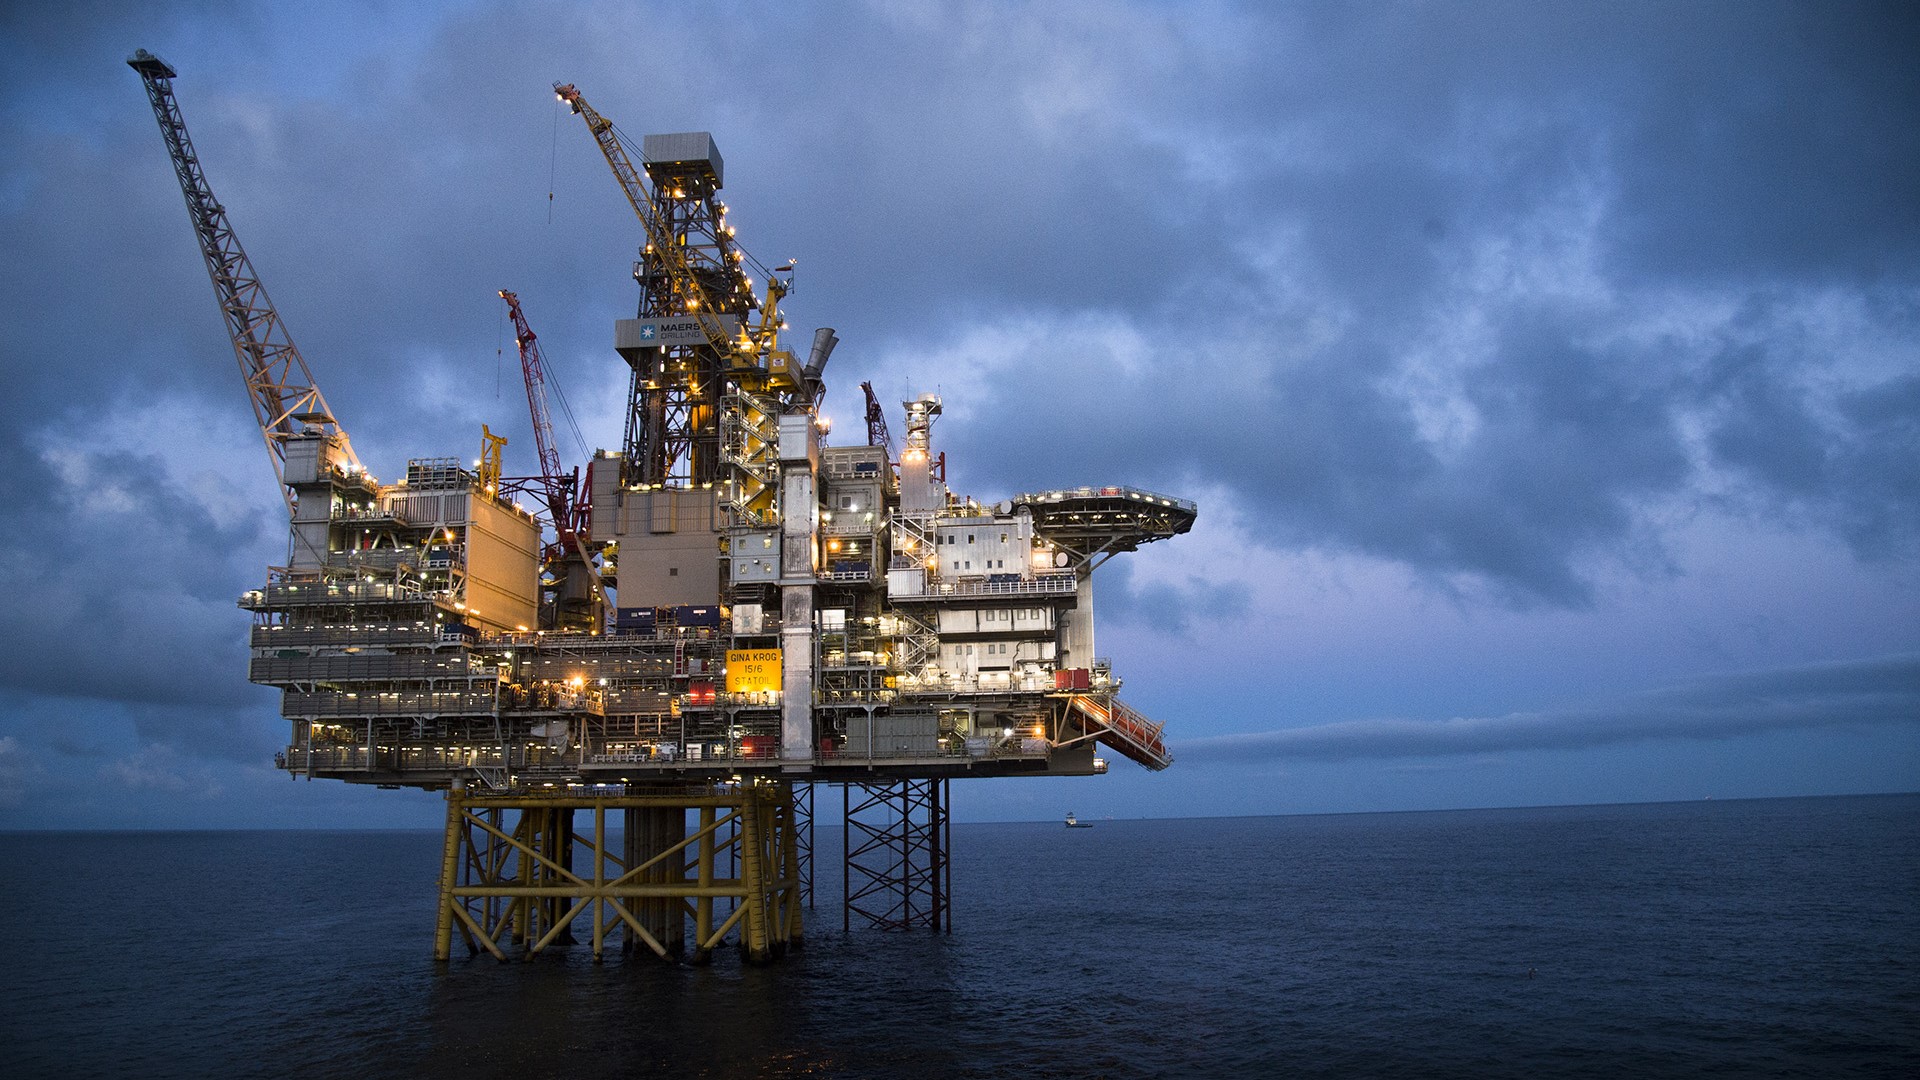
22/09/2026 Preliminary production figures for August 2026 show an average daily production of 2 073 000 barrels of oil, NGL and condensate.
Total gas sales were 10.6 billion Sm3 (GSm3), which is 0.3 (GSm3) less than the previous month.
The average daily production of liquids in August was: 1 882 000 barrels of oil, 175 000 barrels of NGL and 17 000 barrels of condensate.
Production figures August 2026
| Oil mill bbl/day |
Sum liquid mill bbl/day |
Gas MSm³/day |
Total MSm³ o.e/day |
||
|---|---|---|---|---|---|
| Production | August 2026 | 1.882 | 2.073 | 342 | 0.672 |
| Forecast for | August 2026 | 1.803 | 2.022 | 348.6 | 0.670 |
| Deviation from forecast | 0.079 | 0.051 | -6.6 | 0.002 | |
| Deviation from forecaset in % | 4.4 % | 2.5 % | -1.9 % | 0.3 % | |
| Production | July 2026 | 1.784 | 1.986 | 351.7 | 0.668 |
| Deviation from | July 2026 | 0.098 | 0.087 | -9.8 | 0.004 |
| Deviation in % from | July 2026 | 5.5 % | 4.4 % | -2.8 % | 0.6 % |
| Production | August 2025 | 1.956 | 2.160 | 333.8 | 0.677 |
| Deviation from | August 2025 | -0.074 | -0.087 | 8.2 | -0.005 |
| Deviation in % from | August 2025 | -3.8 % | -4 % | 2.5 % | -0.7 % |
Oil production August 2026
Liquid production August 2026
Gas production August 2026
Oil production in August is 4.4 percent more than the NOD’s forecast and 4.6 percent more than the forecast so far this year.
The total petroleum production so far in 2026 is about 163.7 million Sm3 oil equivalents (MSm3 o.e.), broken down as follows: about 72.5 MSm3 o.e. of oil, about 7.2 MSm3 o.e. of NGL and condensate and about 83.3 MSm3 o.e. of gas for sale.
The total volume is 5.5 MSm3 o.e. more than 2025.
Updated: 22/09/2026